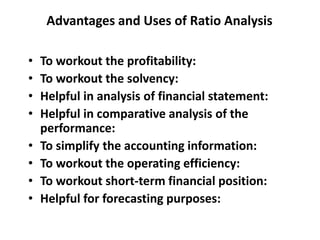
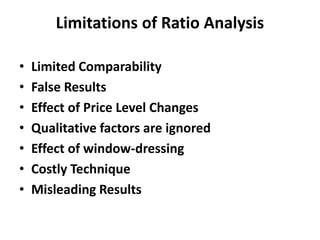
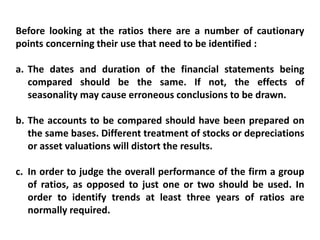
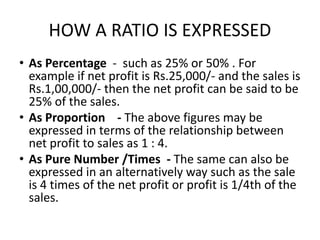
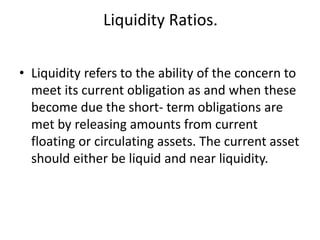
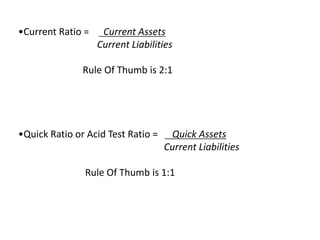
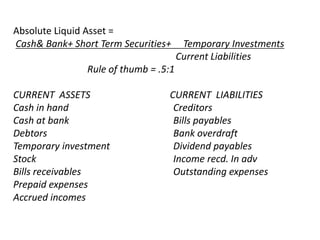
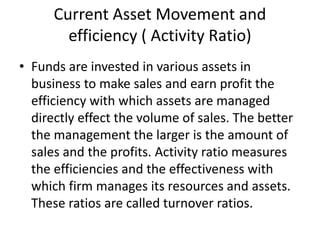
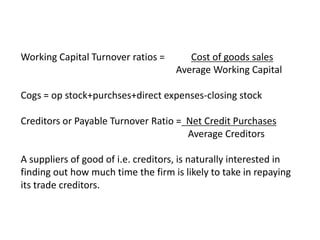
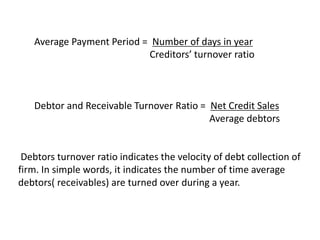
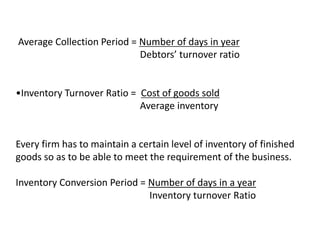
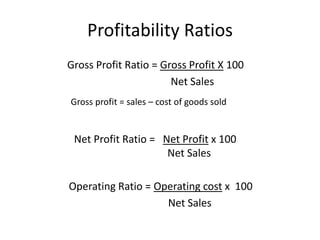
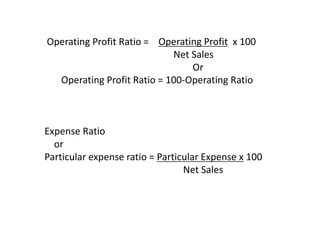
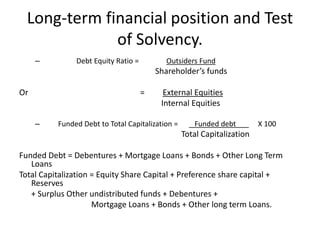
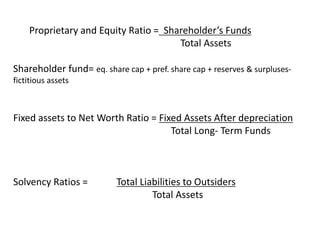
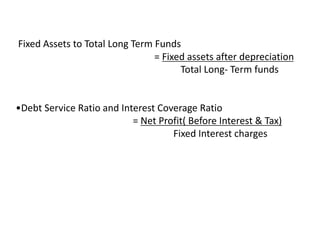
RATIO ANALYSIS
Ratio-analysis means the process of computing,
determining and presenting the relationship of
related items and groups of items of the financial
statements. They provide in a summarized and
concise form of fairly good idea about the
financial position of a unit. They are important
tools for financial analysis.
According to Myers, " Ratio analysis of financial
statements is a study of relationship among
various financial factors in a business as disclosed
by a single set of statements and a study of trend
of these factors as shown in a series of
statements."
Advantages and Uses of Ratio Analysis
• To workout the profitability:
• To workout the solvency:
• Helpful in analysis of financial statement:
• Helpful in comparative analysis of the
performance:
• To simplify the accounting information:
• To workout the operating efficiency:
• To workout short-term financial position:
• Helpful for forecasting purposes:
Limitations of Ratio Analysis
• Limited Comparability
• False Results
• Effect of Price Level Changes
• Qualitative factors are ignored
• Effect of window-dressing
• Costly Technique
• Misleading Results
Before looking at the ratios there are a number of cautionary
points concerning their use that need to be identified :
a. The dates and duration of the financial statements being
compared should be the same. If not, the effects of
seasonality may cause erroneous conclusions to be drawn.
b. The accounts to be compared should have been prepared on
the same bases. Different treatment of stocks or depreciations
or asset valuations will distort the results.
c. In order to judge the overall performance of the firm a group
of ratios, as opposed to just one or two should be used. In
order to identify trends at least three years of ratios are
normally required.
HOW A RATIO IS EXPRESSED
• As Percentage - such as 25% or 50% . For
example if net profit is Rs.25,000/- and the sales is
Rs.1,00,000/- then the net profit can be said to be
25% of the sales.
• As Proportion - The above figures may be
expressed in terms of the relationship between
net profit to sales as 1 : 4.
• As Pure Number /Times - The same can also be
expressed in an alternatively way such as the sale
is 4 times of the net profit or profit is 1/4th of the
sales.
Liquidity Ratios.
• Liquidity refers to the ability of the concern to
meet its current obligation as and when these
become due the short- term obligations are
met by releasing amounts from current
floating or circulating assets. The current asset
should either be liquid and near liquidity.
•Current Ratio = Current Assets
Current Liabilities
Rule Of Thumb is 2:1
•Quick Ratio or Acid Test Ratio = Quick Assets
Current Liabilities
Rule Of Thumb is 1:1
Absolute Liquid Asset =
Cash& Bank+ Short Term Securities+ Temporary Investments
Current Liabilities
Rule of thumb = .5:1
CURRENT ASSETS CURRENT LIABILITIES
Cash in hand Creditors
Cash at bank Bills payables
Debtors Bank overdraft
Temporary investment Dividend payables
Stock Income recd. In adv
Bills receivables Outstanding expenses
Prepaid expenses
Accrued incomes
Current Asset Movement and
efficiency ( Activity Ratio)
• Funds are invested in various assets in
business to make sales and earn profit the
efficiency with which assets are managed
directly effect the volume of sales. The better
the management the larger is the amount of
sales and the profits. Activity ratio measures
the efficiencies and the effectiveness with
which firm manages its resources and assets.
These ratios are called turnover ratios.
Working Capital Turnover ratios = Cost of goods sales
Average Working Capital
Cogs = op stock+purchses+direct expenses-closing stock
Creditors or Payable Turnover Ratio = Net Credit Purchases
Average Creditors
A suppliers of good of i.e. creditors, is naturally interested in
finding out how much time the firm is likely to take in repaying
its trade creditors.
Average Payment Period = Number of days in year
Creditors’ turnover ratio
Debtor and Receivable Turnover Ratio = Net Credit Sales
Average debtors
Debtors turnover ratio indicates the velocity of debt collection of
firm. In simple words, it indicates the number of time average
debtors( receivables) are turned over during a year.
Average Collection Period = Number of days in year
Debtors’ turnover ratio
•Inventory Turnover Ratio = Cost of goods sold
Average inventory
Every firm has to maintain a certain level of inventory of finished
goods so as to be able to meet the requirement of the business.
Inventory Conversion Period = Number of days in a year
Inventory turnover Ratio
Profitability Ratios
Gross Profit Ratio = Gross Profit X 100
Net Sales
Gross profit = sales – cost of goods sold
Net Profit Ratio = Net Profit x 100
Net Sales
Operating Ratio = Operating cost x 100
Net Sales
Operating Profit Ratio = Operating Profit x 100
Net Sales
Or
Operating Profit Ratio = 100-Operating Ratio
Expense Ratio
or
Particular expense ratio = Particular Expense x 100
Net Sales
Long-term financial position and Test
of Solvency.
– Debt Equity Ratio = Outsiders Fund
Shareholder’s funds
Or = External Equities
Internal Equities
– Funded Debt to Total Capitalization = Funded debt X 100
Total Capitalization
Funded Debt = Debentures + Mortgage Loans + Bonds + Other Long Term
Loans
Total Capitalization = Equity Share Capital + Preference share capital +
Reserves
+ Surplus Other undistributed funds + Debentures +
Mortgage Loans + Bonds + Other long term Loans.
Proprietary and Equity Ratio = Shareholder’s Funds
Total Assets
Shareholder fund= eq. share cap + pref. share cap + reserves & surpluses-
fictitious assets
Fixed assets to Net Worth Ratio = Fixed Assets After depreciation
Total Long- Term Funds
Solvency Ratios = Total Liabilities to Outsiders
Total Assets
Fixed Assets to Total Long Term Funds
= Fixed assets after depreciation
Total Long- Term funds
•Debt Service Ratio and Interest Coverage Ratio
= Net Profit( Before Interest & Tax)
Fixed Interest charges

Ratio analysis

  • 1.
    RATIO ANALYSIS Ratio-analysis meansthe process of computing, determining and presenting the relationship of related items and groups of items of the financial statements. They provide in a summarized and concise form of fairly good idea about the financial position of a unit. They are important tools for financial analysis. According to Myers, " Ratio analysis of financial statements is a study of relationship among various financial factors in a business as disclosed by a single set of statements and a study of trend of these factors as shown in a series of statements."
  • 2.
    Advantages and Usesof Ratio Analysis • To workout the profitability: • To workout the solvency: • Helpful in analysis of financial statement: • Helpful in comparative analysis of the performance: • To simplify the accounting information: • To workout the operating efficiency: • To workout short-term financial position: • Helpful for forecasting purposes:
  • 3.
    Limitations of RatioAnalysis • Limited Comparability • False Results • Effect of Price Level Changes • Qualitative factors are ignored • Effect of window-dressing • Costly Technique • Misleading Results
  • 4.
    Before looking atthe ratios there are a number of cautionary points concerning their use that need to be identified : a. The dates and duration of the financial statements being compared should be the same. If not, the effects of seasonality may cause erroneous conclusions to be drawn. b. The accounts to be compared should have been prepared on the same bases. Different treatment of stocks or depreciations or asset valuations will distort the results. c. In order to judge the overall performance of the firm a group of ratios, as opposed to just one or two should be used. In order to identify trends at least three years of ratios are normally required.
  • 5.
    HOW A RATIOIS EXPRESSED • As Percentage - such as 25% or 50% . For example if net profit is Rs.25,000/- and the sales is Rs.1,00,000/- then the net profit can be said to be 25% of the sales. • As Proportion - The above figures may be expressed in terms of the relationship between net profit to sales as 1 : 4. • As Pure Number /Times - The same can also be expressed in an alternatively way such as the sale is 4 times of the net profit or profit is 1/4th of the sales.
  • 6.
    Liquidity Ratios. • Liquidityrefers to the ability of the concern to meet its current obligation as and when these become due the short- term obligations are met by releasing amounts from current floating or circulating assets. The current asset should either be liquid and near liquidity.
  • 7.
    •Current Ratio =Current Assets Current Liabilities Rule Of Thumb is 2:1 •Quick Ratio or Acid Test Ratio = Quick Assets Current Liabilities Rule Of Thumb is 1:1
  • 8.
    Absolute Liquid Asset= Cash& Bank+ Short Term Securities+ Temporary Investments Current Liabilities Rule of thumb = .5:1 CURRENT ASSETS CURRENT LIABILITIES Cash in hand Creditors Cash at bank Bills payables Debtors Bank overdraft Temporary investment Dividend payables Stock Income recd. In adv Bills receivables Outstanding expenses Prepaid expenses Accrued incomes
  • 9.
    Current Asset Movementand efficiency ( Activity Ratio) • Funds are invested in various assets in business to make sales and earn profit the efficiency with which assets are managed directly effect the volume of sales. The better the management the larger is the amount of sales and the profits. Activity ratio measures the efficiencies and the effectiveness with which firm manages its resources and assets. These ratios are called turnover ratios.
  • 10.
    Working Capital Turnoverratios = Cost of goods sales Average Working Capital Cogs = op stock+purchses+direct expenses-closing stock Creditors or Payable Turnover Ratio = Net Credit Purchases Average Creditors A suppliers of good of i.e. creditors, is naturally interested in finding out how much time the firm is likely to take in repaying its trade creditors.
  • 11.
    Average Payment Period= Number of days in year Creditors’ turnover ratio Debtor and Receivable Turnover Ratio = Net Credit Sales Average debtors Debtors turnover ratio indicates the velocity of debt collection of firm. In simple words, it indicates the number of time average debtors( receivables) are turned over during a year.
  • 12.
    Average Collection Period= Number of days in year Debtors’ turnover ratio •Inventory Turnover Ratio = Cost of goods sold Average inventory Every firm has to maintain a certain level of inventory of finished goods so as to be able to meet the requirement of the business. Inventory Conversion Period = Number of days in a year Inventory turnover Ratio
  • 13.
    Profitability Ratios Gross ProfitRatio = Gross Profit X 100 Net Sales Gross profit = sales – cost of goods sold Net Profit Ratio = Net Profit x 100 Net Sales Operating Ratio = Operating cost x 100 Net Sales
  • 14.
    Operating Profit Ratio= Operating Profit x 100 Net Sales Or Operating Profit Ratio = 100-Operating Ratio Expense Ratio or Particular expense ratio = Particular Expense x 100 Net Sales
  • 15.
    Long-term financial positionand Test of Solvency. – Debt Equity Ratio = Outsiders Fund Shareholder’s funds Or = External Equities Internal Equities – Funded Debt to Total Capitalization = Funded debt X 100 Total Capitalization Funded Debt = Debentures + Mortgage Loans + Bonds + Other Long Term Loans Total Capitalization = Equity Share Capital + Preference share capital + Reserves + Surplus Other undistributed funds + Debentures + Mortgage Loans + Bonds + Other long term Loans.
  • 16.
    Proprietary and EquityRatio = Shareholder’s Funds Total Assets Shareholder fund= eq. share cap + pref. share cap + reserves & surpluses- fictitious assets Fixed assets to Net Worth Ratio = Fixed Assets After depreciation Total Long- Term Funds Solvency Ratios = Total Liabilities to Outsiders Total Assets
  • 17.
    Fixed Assets toTotal Long Term Funds = Fixed assets after depreciation Total Long- Term funds •Debt Service Ratio and Interest Coverage Ratio = Net Profit( Before Interest & Tax) Fixed Interest charges