Download to read offline
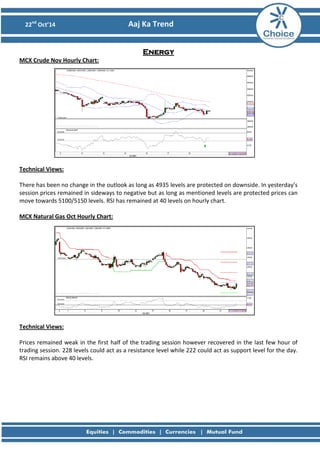
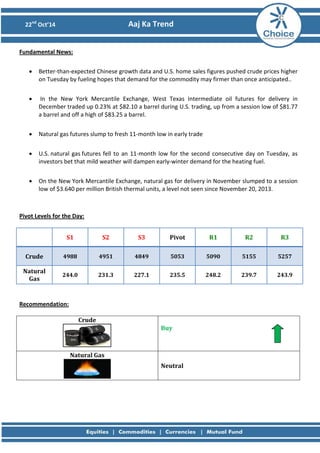


- Gold prices moved higher on news of slower than expected Chinese economic growth weakening the US dollar. Technical analysis indicates gold prices may continue to rise further. - Copper prices declined after data showed China's economy grew at its slowest pace in over 5 years, but technical analysis signals copper prices could rise to new highs if support levels are maintained. - Crude oil prices rose due to better than expected Chinese and US economic data fueling hopes of increased demand, while natural gas futures fell to 11-month lows on expectations of mild winter weather dampening demand.


