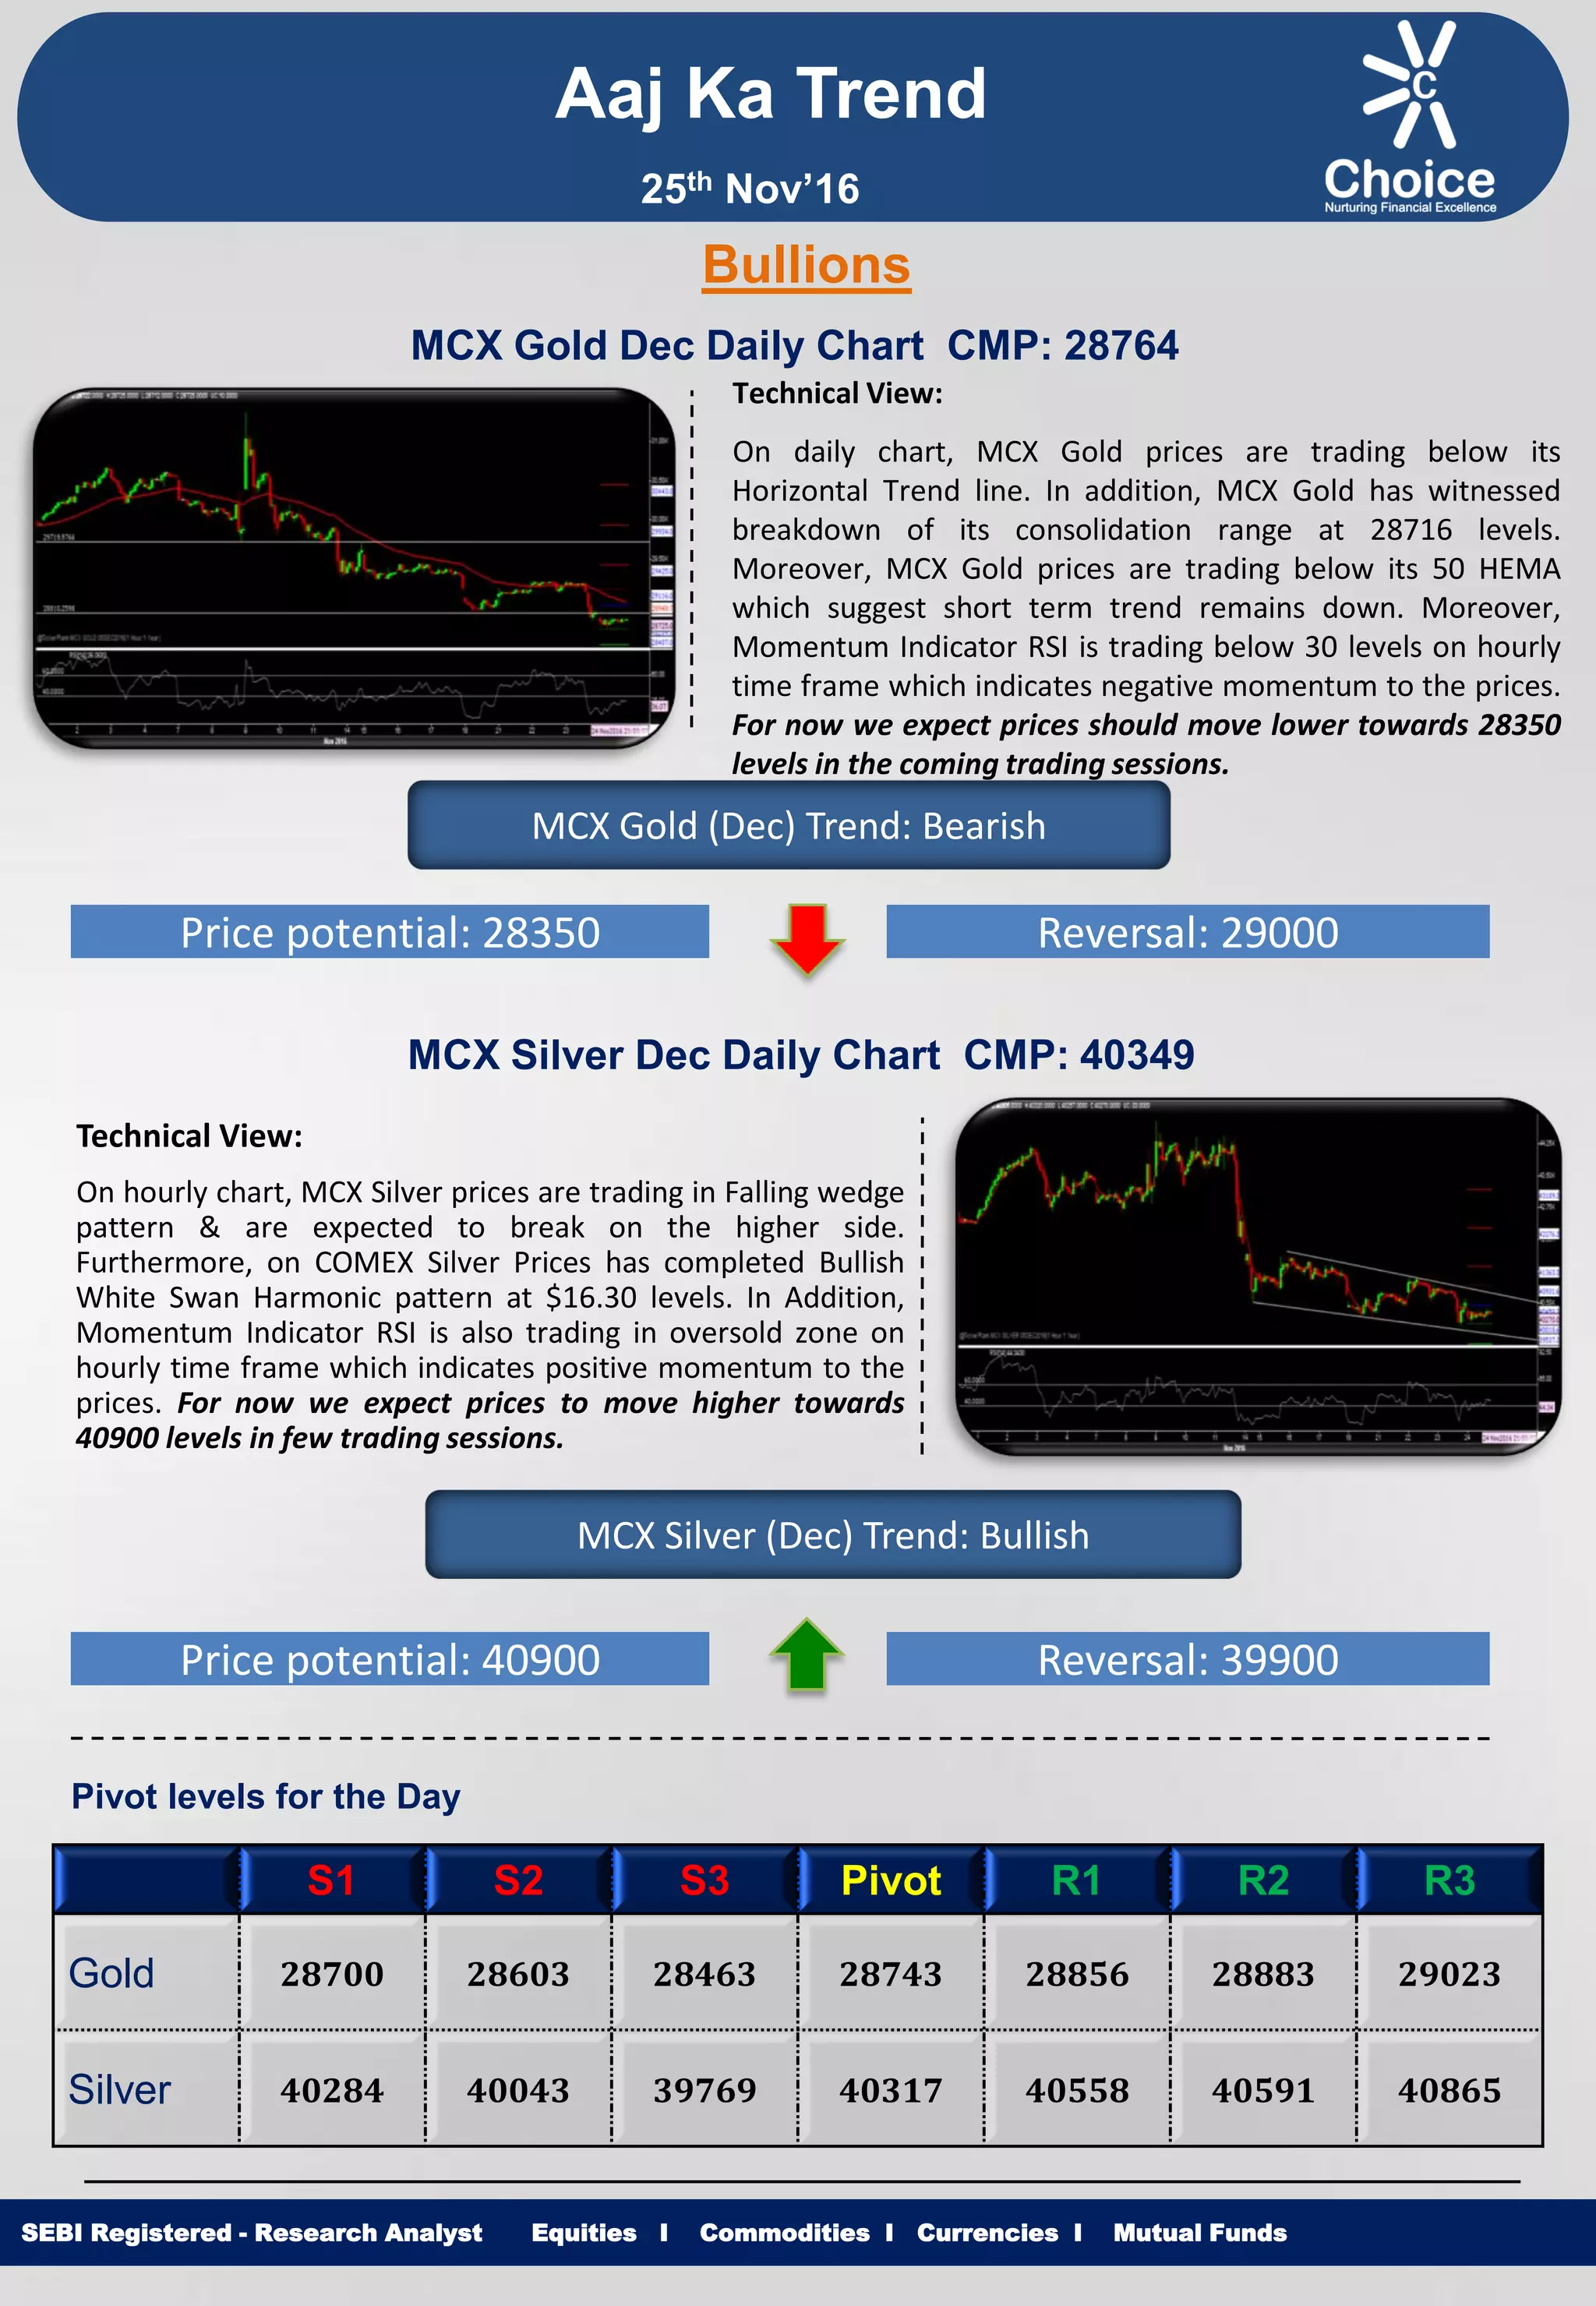
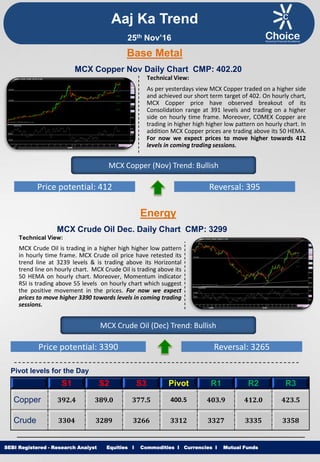
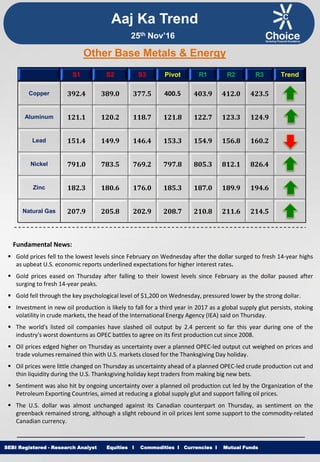
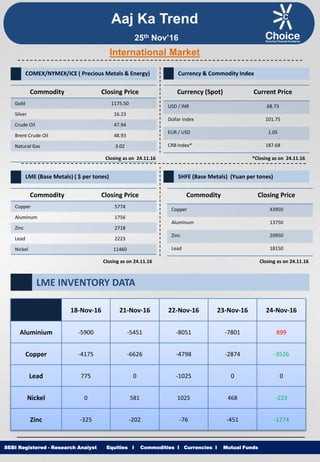
Equities I Commodities I Currencies I Mutual Funds
Aaj Ka Trend
Technical View:
On daily chart, MCX Gold prices are trading below its
Horizontal Trend line. In addition, MCX Gold has witnessed
breakdown of its consolidation range at 28716 levels.
Moreover, MCX Gold prices are trading below its 50 HEMA
which suggest short term trend remains down. Moreover,
Momentum Indicator RSI is trading below 30 levels on hourly
time frame which indicates negative momentum to the prices.
For now we expect prices should move lower towards 28350
levels in the coming trading sessions.
SEBI Registered - Research Analyst Equities I Commodities I Currencies I Mutual Funds
Bullions
MCX Gold Dec Daily Chart CMP: 28764
MCX Gold (Dec) Trend: Bearish
Price potential: 28350 Reversal: 29000
MCX Silver Dec Daily Chart CMP: 40349
Technical View:
On hourly chart, MCX Silver prices are trading in Falling wedge
pattern & are expected to break on the higher side.
Furthermore, on COMEX Silver Prices has completed Bullish
White Swan Harmonic pattern at $16.30 levels. In Addition,
Momentum Indicator RSI is also trading in oversold zone on
hourly time frame which indicates positive momentum to the
prices. For now we expect prices to move higher towards
40900 levels in few trading sessions.
MCX Silver (Dec) Trend: Bullish
Price potential: 40900 Reversal: 39900
Pivot levels for the Day
S1 S2 S3 Pivot R1 R2 R3
Gold 28700 28603 28463 28743 28856 28883 29023
Silver 40284 40043 39769 40317 40558 40591 40865
25th Nov’16
Equities I Commodities I Currencies I Mutual Funds
Technical View:
As per yesterdays view MCX Copper traded on a higher side
and achieved our short term target of 402. On hourly chart,
MCX Copper price have observed breakout of its
Consolidation range at 391 levels and trading on a higher
side on hourly time frame. Moreover, COMEX Copper are
trading in higher high higher low pattern on hourly chart. In
addition MCX Copper prices are trading above its 50 HEMA.
For now we expect prices to move higher towards 412
levels in coming trading sessions.
SEBI Registered - Research Analyst Equities I Commodities I Currencies I Mutual Funds
MCX Copper Nov Daily Chart CMP: 402.20
MCX Copper (Nov) Trend: Bullish
Price potential: 412 Reversal: 395
MCX Crude Oil Dec. Daily Chart CMP: 3299
Technical View:
MCX Crude Oil is trading in a higher high higher low pattern
in hourly time frame. MCX Crude oil price have retested its
trend line at 3239 levels & is trading above its Horizontal
trend line on hourly chart. MCX Crude Oil is trading above its
50 HEMA on hourly chart. Moreover, Momentum indicator
RSI is trading above 55 levels on hourly chart which suggest
the positive movement in the prices. For now we expect
prices to move higher 3390 towards levels in coming trading
sessions.
MCX Crude Oil (Dec) Trend: Bullish
Price potential: 3390 Reversal: 3265
Pivot levels for the Day
S1 S2 S3 Pivot R1 R2 R3
Copper 392.4 389.0 377.5 400.5 403.9 412.0 423.5
Crude 3304 3289 3266 3312 3327 3335 3358
Base Metal
Energy
Aaj Ka Trend
25th Nov’16
Equities I Commodities I Currencies I Mutual FundsSEBI Registered - Research Analyst Equities I Commodities I Currencies I Mutual Funds
Other Base Metals & Energy
S1 S2 S3 Pivot R1 R2 R3 Trend
Copper 392.4 389.0 377.5 400.5 403.9 412.0 423.5
Aluminum 121.1 120.2 118.7 121.8 122.7 123.3 124.9
Lead 151.4 149.9 146.4 153.3 154.9 156.8 160.2
Nickel 791.0 783.5 769.2 797.8 805.3 812.1 826.4
Zinc 182.3 180.6 176.0 185.3 187.0 189.9 194.6
Natural Gas 207.9 205.8 202.9 208.7 210.8 211.6 214.5
Fundamental News:
 Gold prices fell to the lowest levels since February on Wednesday after the dollar surged to fresh 14-year highs
as upbeat U.S. economic reports underlined expectations for higher interest rates.
 Gold prices eased on Thursday after falling to their lowest levels since February as the dollar paused after
surging to fresh 14-year peaks.
 Gold fell through the key psychological level of $1,200 on Wednesday, pressured lower by the strong dollar.
 Investment in new oil production is likely to fall for a third year in 2017 as a global supply glut persists, stoking
volatility in crude markets, the head of the International Energy Agency (IEA) said on Thursday.
 The world's listed oil companies have slashed oil output by 2.4 percent so far this year during one of the
industry's worst downturns as OPEC battles to agree on its first production cut since 2008.
 Oil prices edged higher on Thursday as uncertainty over a planned OPEC-led output cut weighed on prices and
trade volumes remained thin with U.S. markets closed for the Thanksgiving Day holiday.
 Oil prices were little changed on Thursday as uncertainty ahead of a planned OPEC-led crude production cut and
thin liquidity during the U.S. Thanksgiving holiday kept traders from making big new bets.
 Sentiment was also hit by ongoing uncertainty over a planned oil production cut led by the Organization of the
Petroleum Exporting Countries, aimed at reducing a global supply glut and support falling oil prices.
 The U.S. dollar was almost unchanged against its Canadian counterpart on Thursday, as sentiment on the
greenback remained strong, although a slight rebound in oil prices lent some support to the commodity-related
Canadian currency.
Aaj Ka Trend
25th Nov’16
Equities I Commodities I Currencies I Mutual FundsSEBI Registered - Research Analyst Equities I Commodities I Currencies I Mutual Funds
International Market
Commodity Closing Price
Gold 1175.50
Silver 16.23
Crude Oil 47.94
Brent Crude Oil 48.93
Natural Gas 3.02
COMEX/NYMEX/ICE ( Precious Metals & Energy) Currency & Commodity Index
Currency (Spot) Current Price
USD / INR 68.73
Dollar Index 101.75
EUR / USD 1.05
CRB Index* 187.68
Closing as on 24.11.16 *Closing as on 24.11.16
LME (Base Metals) ( $ per tones)
Commodity Closing Price
Copper 5774
Aluminum 1756
Zinc 2718
Lead 2223
Nickel 11460
SHFE (Base Metals) (Yuan per tones)
Commodity Closing Price
Copper 43950
Aluminum 13750
Zinc 20950
Lead 18150
Closing as on 24.11.16 Closing as on 24.11.16
LME INVENTORY DATA
Aaj Ka Trend
18-Nov-16 21-Nov-16 22-Nov-16 23-Nov-16 24-Nov-16
Aluminium -5900 -5451 -8051 -7801 899
Copper -4175 -6626 -4798 -2874 -3526
Lead 775 0 -1025 0 0
Nickel 0 581 1025 468 -223
Zinc -325 -202 -76 -451 -1274
25th Nov’16
Equities I Commodities I Currencies I Mutual Funds
This is solely for information of clients of Choice Broking and does not construe to be an investment advice. It is also not intended as an offer or solicitation
for the purchase and sale of any financial instruments. Any action taken by you on the basis of the information contained herein is your responsibility alone
and Choice Broking its subsidiaries or its employees or associates will not be liable in any manner for the consequences of such action taken by you. We
have exercised due diligence in checking the correctness and authenticity of the information contained in this recommendation, but Choice Broking or any of
its subsidiaries or associates or employees shall not be in any way responsible for any loss or damage that may arise to any person from any inadvertent
error in the information contained in this recommendation or any action taken on basis of this information. Technical analysis studies market psychology,
price patterns and volume levels. It is used to forecast future price and market movements. Technical analysis is complementary to fundamental analysis
and news sources. The recommendations issued herewith might be contrary to recommendations issued by Choice Broking in the company research
undertaken as the recommendations stated in this report is derived purely from technical analysis. Choice Broking has based this document on information
obtained from sources it believes to be reliable but which it has not independently verified; Choice Broking makes no guarantee, representation or warranty
and accepts no responsibility or liability as to its accuracy or completeness. The opinions contained within the report are based upon publicly available
information at the time of publication and are subject to change without notice. The information and any disclosures provided herein are in summary form
and have been prepared for informational purposes. The recommendations and suggested price levels are intended purely for trading purposes. The
recommendations are valid for the day of the report however trading trends and volumes might vary substantially on an intraday basis and the
recommendations may be subject to change. The information and any disclosures provided herein may be considered confidential. Any use, distribution,
modification, copying, forwarding or disclosure by any person is strictly prohibited. The information and any disclosures provided herein do not constitute a
solicitation or offer to purchase or sell any security or other financial product or instrument. The current performance may be unaudited. Past performance
does not guarantee future returns. There can be no assurance that investments will achieve any targeted rates of return, and there is no guarantee against
the loss of your entire investment.
POTENTIAL CONFLICT OF INTEREST DISCLOSURE (as on date of report) Disclosure of interest statement – • Analyst interest of the stock
/Instrument(s): - No. • Firm interest of the stock / Instrument (s): - No.
Disclaimer
Contact Us
Amit Pathania
Research Associate
amit.pathania@choiceindia.com
Rohan Patil
Research Associate
rohan.patil@choiceindia.com
www.choicebroking.incustomercare@choiceindia.com
SEBI Registered - Research Analyst Equities I Commodities I Currencies I Mutual Funds
Aaj Ka Trend
25th Nov’16
Neeraj Yadav
Research Advisor
neeraj.yadav@choiceindia.com
Anish Vyas
Senior Research Associate
anish.vyas@choiceindia.com
Amit Pathania
Digitally signed by Amit Pathania
DN: cn=Amit Pathania, o=Choice Equity Broking Pvt. ltd,
ou=Research Department,
email=amit.pathania@choiceindia.com, c=IN
Date: 2016.11.25 08:43:58 +05'30'

Aaj ka trend 25.11.16

  • 1.
    Equities I CommoditiesI Currencies I Mutual Funds Aaj Ka Trend Technical View: On daily chart, MCX Gold prices are trading below its Horizontal Trend line. In addition, MCX Gold has witnessed breakdown of its consolidation range at 28716 levels. Moreover, MCX Gold prices are trading below its 50 HEMA which suggest short term trend remains down. Moreover, Momentum Indicator RSI is trading below 30 levels on hourly time frame which indicates negative momentum to the prices. For now we expect prices should move lower towards 28350 levels in the coming trading sessions. SEBI Registered - Research Analyst Equities I Commodities I Currencies I Mutual Funds Bullions MCX Gold Dec Daily Chart CMP: 28764 MCX Gold (Dec) Trend: Bearish Price potential: 28350 Reversal: 29000 MCX Silver Dec Daily Chart CMP: 40349 Technical View: On hourly chart, MCX Silver prices are trading in Falling wedge pattern & are expected to break on the higher side. Furthermore, on COMEX Silver Prices has completed Bullish White Swan Harmonic pattern at $16.30 levels. In Addition, Momentum Indicator RSI is also trading in oversold zone on hourly time frame which indicates positive momentum to the prices. For now we expect prices to move higher towards 40900 levels in few trading sessions. MCX Silver (Dec) Trend: Bullish Price potential: 40900 Reversal: 39900 Pivot levels for the Day S1 S2 S3 Pivot R1 R2 R3 Gold 28700 28603 28463 28743 28856 28883 29023 Silver 40284 40043 39769 40317 40558 40591 40865 25th Nov’16
  • 2.
    Equities I CommoditiesI Currencies I Mutual Funds Technical View: As per yesterdays view MCX Copper traded on a higher side and achieved our short term target of 402. On hourly chart, MCX Copper price have observed breakout of its Consolidation range at 391 levels and trading on a higher side on hourly time frame. Moreover, COMEX Copper are trading in higher high higher low pattern on hourly chart. In addition MCX Copper prices are trading above its 50 HEMA. For now we expect prices to move higher towards 412 levels in coming trading sessions. SEBI Registered - Research Analyst Equities I Commodities I Currencies I Mutual Funds MCX Copper Nov Daily Chart CMP: 402.20 MCX Copper (Nov) Trend: Bullish Price potential: 412 Reversal: 395 MCX Crude Oil Dec. Daily Chart CMP: 3299 Technical View: MCX Crude Oil is trading in a higher high higher low pattern in hourly time frame. MCX Crude oil price have retested its trend line at 3239 levels & is trading above its Horizontal trend line on hourly chart. MCX Crude Oil is trading above its 50 HEMA on hourly chart. Moreover, Momentum indicator RSI is trading above 55 levels on hourly chart which suggest the positive movement in the prices. For now we expect prices to move higher 3390 towards levels in coming trading sessions. MCX Crude Oil (Dec) Trend: Bullish Price potential: 3390 Reversal: 3265 Pivot levels for the Day S1 S2 S3 Pivot R1 R2 R3 Copper 392.4 389.0 377.5 400.5 403.9 412.0 423.5 Crude 3304 3289 3266 3312 3327 3335 3358 Base Metal Energy Aaj Ka Trend 25th Nov’16
  • 3.
    Equities I CommoditiesI Currencies I Mutual FundsSEBI Registered - Research Analyst Equities I Commodities I Currencies I Mutual Funds Other Base Metals & Energy S1 S2 S3 Pivot R1 R2 R3 Trend Copper 392.4 389.0 377.5 400.5 403.9 412.0 423.5 Aluminum 121.1 120.2 118.7 121.8 122.7 123.3 124.9 Lead 151.4 149.9 146.4 153.3 154.9 156.8 160.2 Nickel 791.0 783.5 769.2 797.8 805.3 812.1 826.4 Zinc 182.3 180.6 176.0 185.3 187.0 189.9 194.6 Natural Gas 207.9 205.8 202.9 208.7 210.8 211.6 214.5 Fundamental News:  Gold prices fell to the lowest levels since February on Wednesday after the dollar surged to fresh 14-year highs as upbeat U.S. economic reports underlined expectations for higher interest rates.  Gold prices eased on Thursday after falling to their lowest levels since February as the dollar paused after surging to fresh 14-year peaks.  Gold fell through the key psychological level of $1,200 on Wednesday, pressured lower by the strong dollar.  Investment in new oil production is likely to fall for a third year in 2017 as a global supply glut persists, stoking volatility in crude markets, the head of the International Energy Agency (IEA) said on Thursday.  The world's listed oil companies have slashed oil output by 2.4 percent so far this year during one of the industry's worst downturns as OPEC battles to agree on its first production cut since 2008.  Oil prices edged higher on Thursday as uncertainty over a planned OPEC-led output cut weighed on prices and trade volumes remained thin with U.S. markets closed for the Thanksgiving Day holiday.  Oil prices were little changed on Thursday as uncertainty ahead of a planned OPEC-led crude production cut and thin liquidity during the U.S. Thanksgiving holiday kept traders from making big new bets.  Sentiment was also hit by ongoing uncertainty over a planned oil production cut led by the Organization of the Petroleum Exporting Countries, aimed at reducing a global supply glut and support falling oil prices.  The U.S. dollar was almost unchanged against its Canadian counterpart on Thursday, as sentiment on the greenback remained strong, although a slight rebound in oil prices lent some support to the commodity-related Canadian currency. Aaj Ka Trend 25th Nov’16
  • 4.
    Equities I CommoditiesI Currencies I Mutual FundsSEBI Registered - Research Analyst Equities I Commodities I Currencies I Mutual Funds International Market Commodity Closing Price Gold 1175.50 Silver 16.23 Crude Oil 47.94 Brent Crude Oil 48.93 Natural Gas 3.02 COMEX/NYMEX/ICE ( Precious Metals & Energy) Currency & Commodity Index Currency (Spot) Current Price USD / INR 68.73 Dollar Index 101.75 EUR / USD 1.05 CRB Index* 187.68 Closing as on 24.11.16 *Closing as on 24.11.16 LME (Base Metals) ( $ per tones) Commodity Closing Price Copper 5774 Aluminum 1756 Zinc 2718 Lead 2223 Nickel 11460 SHFE (Base Metals) (Yuan per tones) Commodity Closing Price Copper 43950 Aluminum 13750 Zinc 20950 Lead 18150 Closing as on 24.11.16 Closing as on 24.11.16 LME INVENTORY DATA Aaj Ka Trend 18-Nov-16 21-Nov-16 22-Nov-16 23-Nov-16 24-Nov-16 Aluminium -5900 -5451 -8051 -7801 899 Copper -4175 -6626 -4798 -2874 -3526 Lead 775 0 -1025 0 0 Nickel 0 581 1025 468 -223 Zinc -325 -202 -76 -451 -1274 25th Nov’16
  • 5.
    Equities I CommoditiesI Currencies I Mutual Funds This is solely for information of clients of Choice Broking and does not construe to be an investment advice. It is also not intended as an offer or solicitation for the purchase and sale of any financial instruments. Any action taken by you on the basis of the information contained herein is your responsibility alone and Choice Broking its subsidiaries or its employees or associates will not be liable in any manner for the consequences of such action taken by you. We have exercised due diligence in checking the correctness and authenticity of the information contained in this recommendation, but Choice Broking or any of its subsidiaries or associates or employees shall not be in any way responsible for any loss or damage that may arise to any person from any inadvertent error in the information contained in this recommendation or any action taken on basis of this information. Technical analysis studies market psychology, price patterns and volume levels. It is used to forecast future price and market movements. Technical analysis is complementary to fundamental analysis and news sources. The recommendations issued herewith might be contrary to recommendations issued by Choice Broking in the company research undertaken as the recommendations stated in this report is derived purely from technical analysis. Choice Broking has based this document on information obtained from sources it believes to be reliable but which it has not independently verified; Choice Broking makes no guarantee, representation or warranty and accepts no responsibility or liability as to its accuracy or completeness. The opinions contained within the report are based upon publicly available information at the time of publication and are subject to change without notice. The information and any disclosures provided herein are in summary form and have been prepared for informational purposes. The recommendations and suggested price levels are intended purely for trading purposes. The recommendations are valid for the day of the report however trading trends and volumes might vary substantially on an intraday basis and the recommendations may be subject to change. The information and any disclosures provided herein may be considered confidential. Any use, distribution, modification, copying, forwarding or disclosure by any person is strictly prohibited. The information and any disclosures provided herein do not constitute a solicitation or offer to purchase or sell any security or other financial product or instrument. The current performance may be unaudited. Past performance does not guarantee future returns. There can be no assurance that investments will achieve any targeted rates of return, and there is no guarantee against the loss of your entire investment. POTENTIAL CONFLICT OF INTEREST DISCLOSURE (as on date of report) Disclosure of interest statement – • Analyst interest of the stock /Instrument(s): - No. • Firm interest of the stock / Instrument (s): - No. Disclaimer Contact Us Amit Pathania Research Associate amit.pathania@choiceindia.com Rohan Patil Research Associate rohan.patil@choiceindia.com www.choicebroking.incustomercare@choiceindia.com SEBI Registered - Research Analyst Equities I Commodities I Currencies I Mutual Funds Aaj Ka Trend 25th Nov’16 Neeraj Yadav Research Advisor neeraj.yadav@choiceindia.com Anish Vyas Senior Research Associate anish.vyas@choiceindia.com Amit Pathania Digitally signed by Amit Pathania DN: cn=Amit Pathania, o=Choice Equity Broking Pvt. ltd, ou=Research Department, email=amit.pathania@choiceindia.com, c=IN Date: 2016.11.25 08:43:58 +05'30'