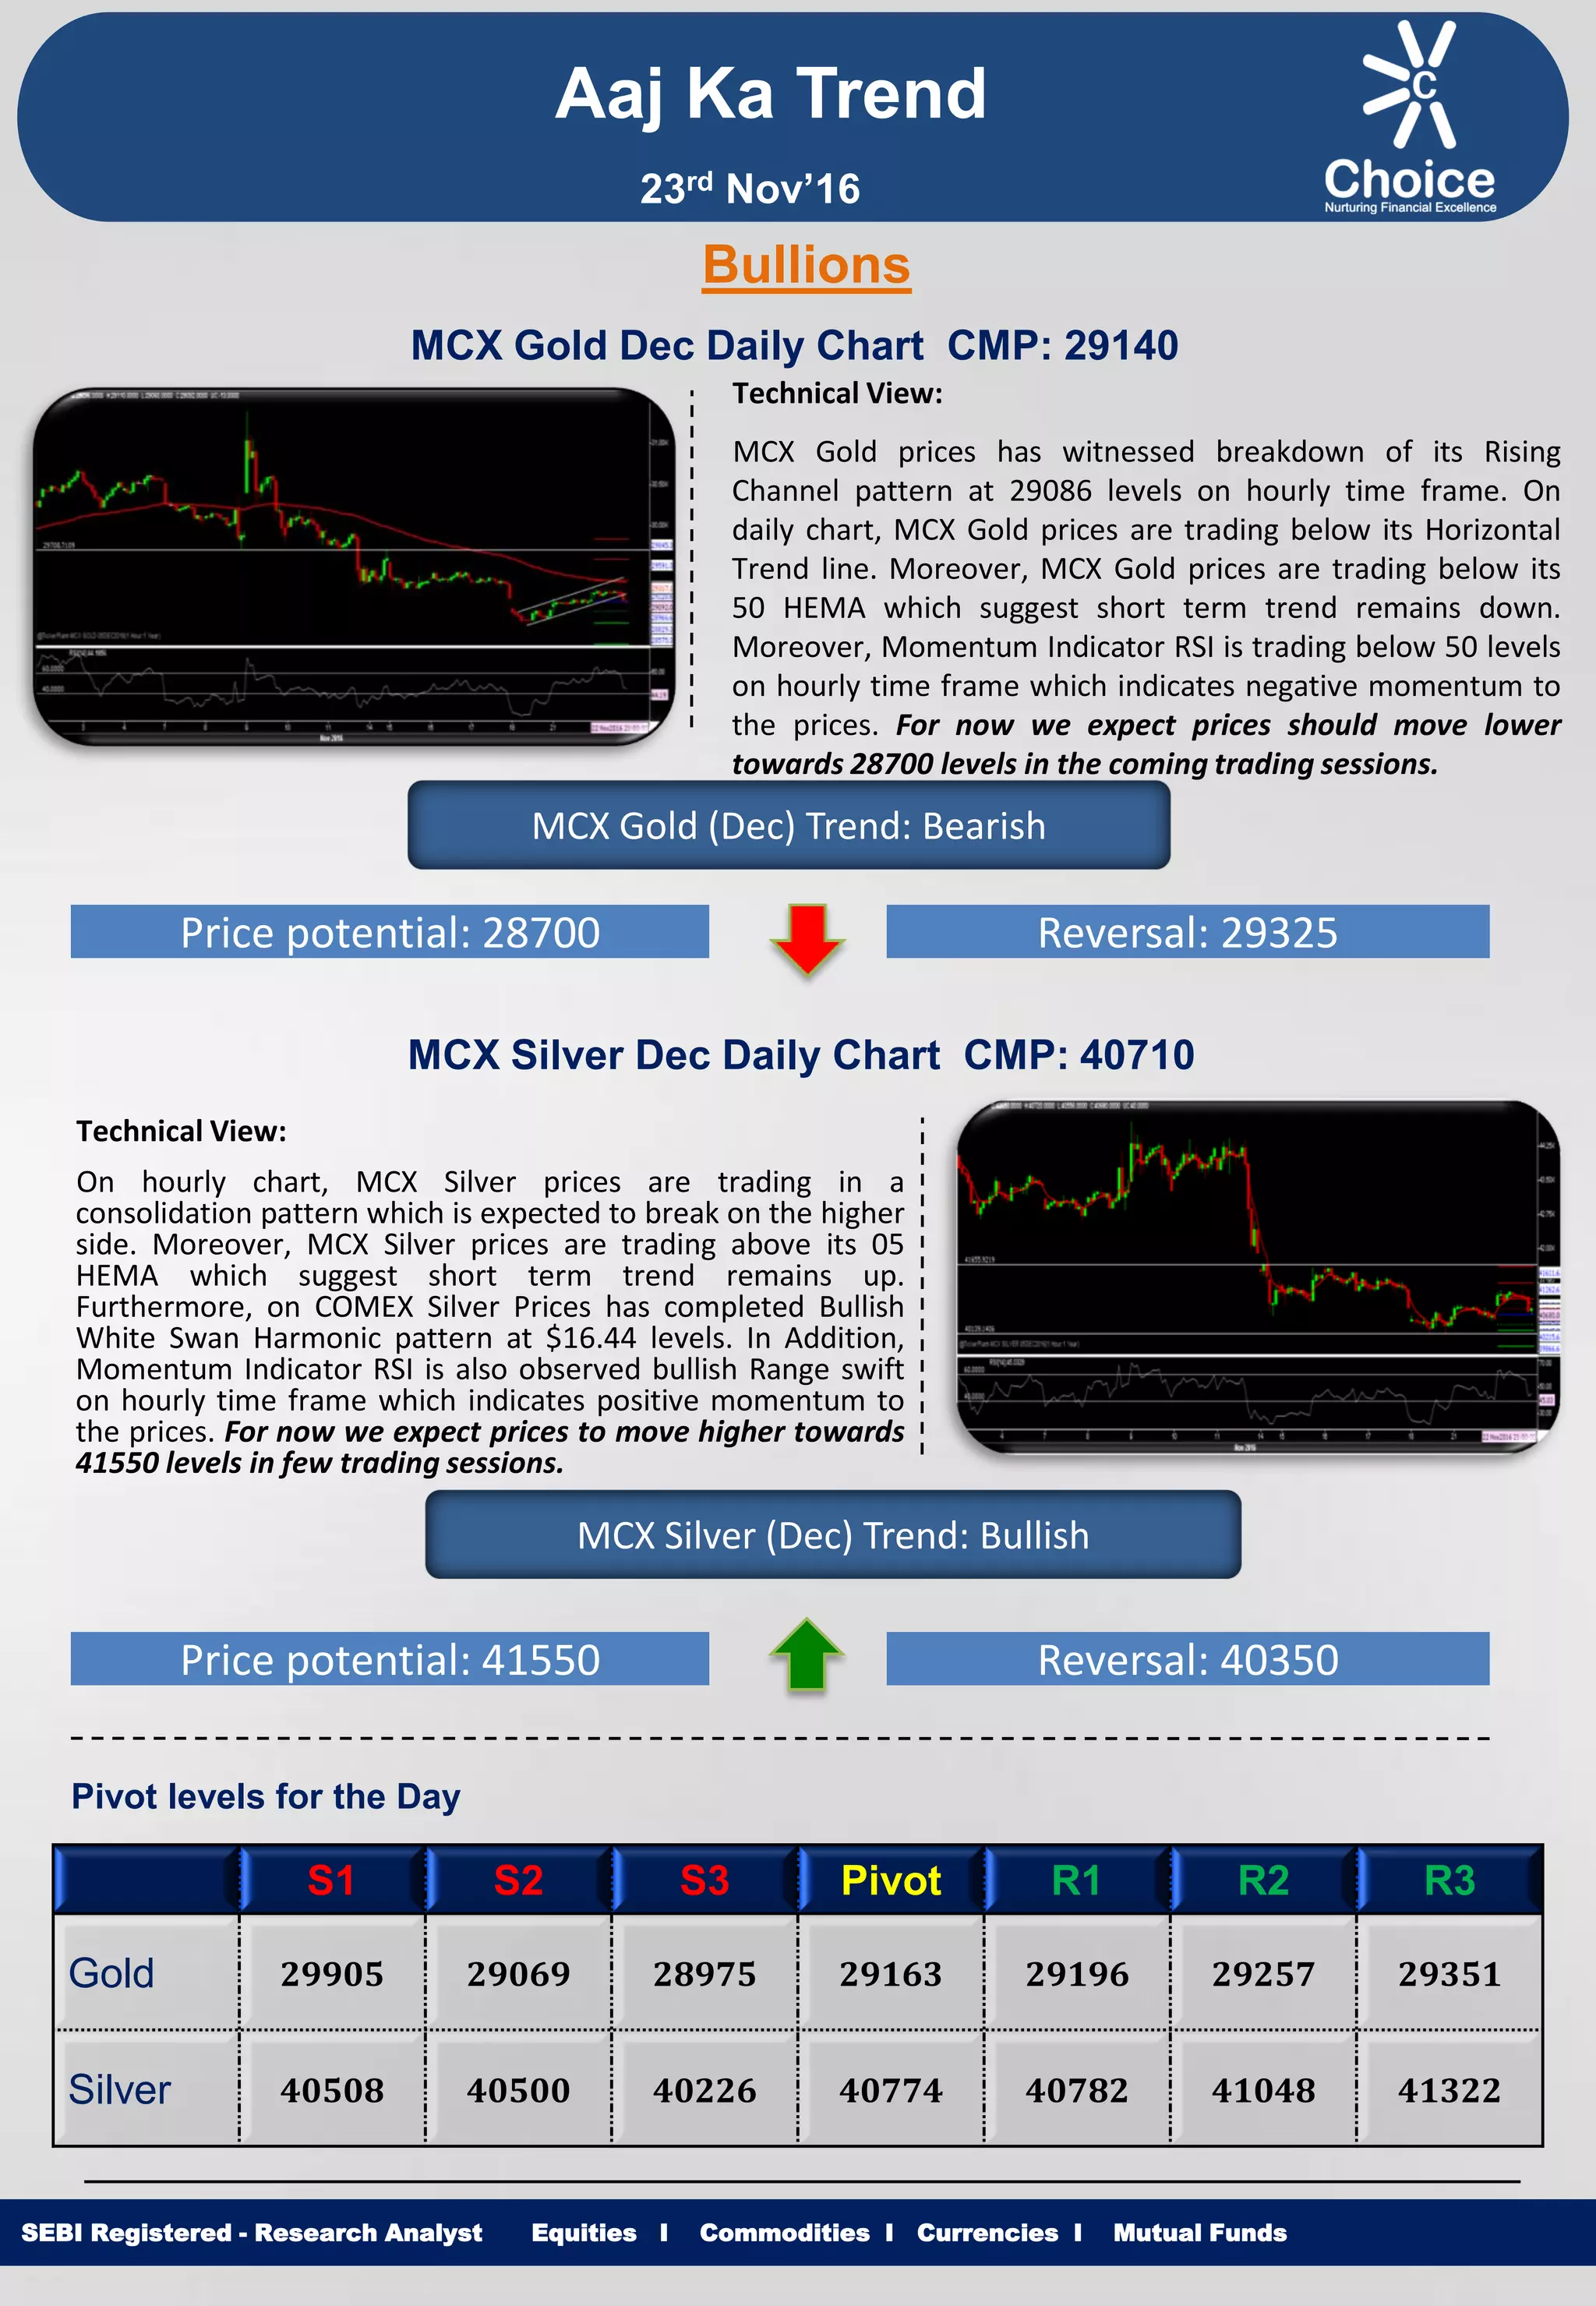
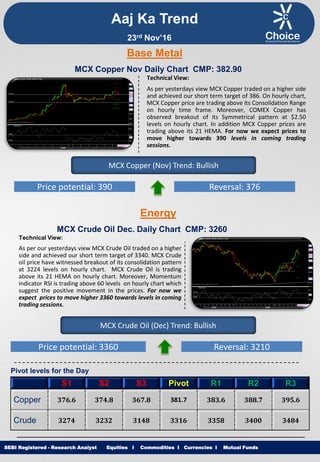
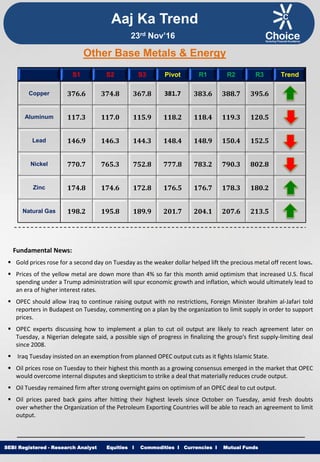
Equities I Commodities I Currencies I Mutual Funds
Aaj Ka Trend
Technical View:
MCX Gold prices has witnessed breakdown of its Rising
Channel pattern at 29086 levels on hourly time frame. On
daily chart, MCX Gold prices are trading below its Horizontal
Trend line. Moreover, MCX Gold prices are trading below its
50 HEMA which suggest short term trend remains down.
Moreover, Momentum Indicator RSI is trading below 50 levels
on hourly time frame which indicates negative momentum to
the prices. For now we expect prices should move lower
towards 28700 levels in the coming trading sessions.
SEBI Registered - Research Analyst Equities I Commodities I Currencies I Mutual Funds
Bullions
MCX Gold Dec Daily Chart CMP: 29140
MCX Gold (Dec) Trend: Bearish
Price potential: 28700 Reversal: 29325
MCX Silver Dec Daily Chart CMP: 40710
Technical View:
On hourly chart, MCX Silver prices are trading in a
consolidation pattern which is expected to break on the higher
side. Moreover, MCX Silver prices are trading above its 05
HEMA which suggest short term trend remains up.
Furthermore, on COMEX Silver Prices has completed Bullish
White Swan Harmonic pattern at $16.44 levels. In Addition,
Momentum Indicator RSI is also observed bullish Range swift
on hourly time frame which indicates positive momentum to
the prices. For now we expect prices to move higher towards
41550 levels in few trading sessions.
MCX Silver (Dec) Trend: Bullish
Price potential: 41550 Reversal: 40350
Pivot levels for the Day
S1 S2 S3 Pivot R1 R2 R3
Gold 29905 29069 28975 29163 29196 29257 29351
Silver 40508 40500 40226 40774 40782 41048 41322
23rd Nov’16
Equities I Commodities I Currencies I Mutual Funds
Technical View:
As per yesterdays view MCX Copper traded on a higher side
and achieved our short term target of 386. On hourly chart,
MCX Copper price are trading above its Consolidation Range
on hourly time frame. Moreover, COMEX Copper has
observed breakout of its Symmetrical pattern at $2.50
levels on hourly chart. In addition MCX Copper prices are
trading above its 21 HEMA. For now we expect prices to
move higher towards 390 levels in coming trading
sessions.
SEBI Registered - Research Analyst Equities I Commodities I Currencies I Mutual Funds
MCX Copper Nov Daily Chart CMP: 382.90
MCX Copper (Nov) Trend: Bullish
Price potential: 390 Reversal: 376
MCX Crude Oil Dec. Daily Chart CMP: 3260
Technical View:
As per our yesterdays view MCX Crude Oil traded on a higher
side and achieved our short term target of 3340. MCX Crude
oil price have witnessed breakout of its consolidation pattern
at 3224 levels on hourly chart. MCX Crude Oil is trading
above its 21 HEMA on hourly chart. Moreover, Momentum
indicator RSI is trading above 60 levels on hourly chart which
suggest the positive movement in the prices. For now we
expect prices to move higher 3360 towards levels in coming
trading sessions.
MCX Crude Oil (Dec) Trend: Bullish
Price potential: 3360 Reversal: 3210
Pivot levels for the Day
S1 S2 S3 Pivot R1 R2 R3
Copper 376.6 374.8 367.8 381.7 383.6 388.7 395.6
Crude 3274 3232 3148 3316 3358 3400 3484
Base Metal
Energy
Aaj Ka Trend
23rd Nov’16
Equities I Commodities I Currencies I Mutual FundsSEBI Registered - Research Analyst Equities I Commodities I Currencies I Mutual Funds
Other Base Metals & Energy
S1 S2 S3 Pivot R1 R2 R3 Trend
Copper 376.6 374.8 367.8 381.7 383.6 388.7 395.6
Aluminum 117.3 117.0 115.9 118.2 118.4 119.3 120.5
Lead 146.9 146.3 144.3 148.4 148.9 150.4 152.5
Nickel 770.7 765.3 752.8 777.8 783.2 790.3 802.8
Zinc 174.8 174.6 172.8 176.5 176.7 178.3 180.2
Natural Gas 198.2 195.8 189.9 201.7 204.1 207.6 213.5
Fundamental News:
 Gold prices rose for a second day on Tuesday as the weaker dollar helped lift the precious metal off recent lows.
 Prices of the yellow metal are down more than 4% so far this month amid optimism that increased U.S. fiscal
spending under a Trump administration will spur economic growth and inflation, which would ultimately lead to
an era of higher interest rates.
 OPEC should allow Iraq to continue raising output with no restrictions, Foreign Minister Ibrahim al-Jafari told
reporters in Budapest on Tuesday, commenting on a plan by the organization to limit supply in order to support
prices.
 OPEC experts discussing how to implement a plan to cut oil output are likely to reach agreement later on
Tuesday, a Nigerian delegate said, a possible sign of progress in finalizing the group's first supply-limiting deal
since 2008.
 Iraq Tuesday insisted on an exemption from planned OPEC output cuts as it fights Islamic State.
 Oil prices rose on Tuesday to their highest this month as a growing consensus emerged in the market that OPEC
would overcome internal disputes and skepticism to strike a deal that materially reduces crude output.
 Oil Tuesday remained firm after strong overnight gains on optimism of an OPEC deal to cut output.
 Oil prices pared back gains after hitting their highest levels since October on Tuesday, amid fresh doubts
over whether the Organization of the Petroleum Exporting Countries will be able to reach an agreement to limit
output.
Aaj Ka Trend
23rd Nov’16
Equities I Commodities I Currencies I Mutual FundsSEBI Registered - Research Analyst Equities I Commodities I Currencies I Mutual Funds
International Market
Commodity Closing Price
Gold 1214.50
Silver 16.70
Crude Oil 47.92
Brent Crude Oil 49.03
Natural Gas 2.94
COMEX/NYMEX/ICE ( Precious Metals & Energy) Currency & Commodity Index
Currency (Spot) Current Price
USD / INR 68.40
Dollar Index 101.05
EUR / USD 1.06
CRB Index* 187.56
Closing as on 22.11.16 *Closing as on 22.11.16
LME (Base Metals) ( $ per tones)
Commodity Closing Price
Copper 5610
Aluminum 1764
Zinc 2580
Lead 2180
Nickel 11250
SHFE (Base Metals) (Yuan per tones)
Commodity Closing Price
Copper 43900
Aluminum 13550
Zinc 20820
Lead 17950
Closing as on 22.11.16 Closing as on 22.11.16
LME INVENTORY DATA
Aaj Ka Trend
16-Nov-16 17-Nov-16 18-Nov-16 21-Nov-16 22-Nov-16
Aluminium 61525 3401 -5900 -5451 -8051
Copper -4100 2275 -4175 -6626 -4798
Lead 600 -25 775 0 -1025
Nickel -144 48 0 581 1025
Zinc -100 -375 -325 -202 -76
23rd Nov’16
Equities I Commodities I Currencies I Mutual Funds
This is solely for information of clients of Choice Broking and does not construe to be an investment advice. It is also not intended as an offer or solicitation
for the purchase and sale of any financial instruments. Any action taken by you on the basis of the information contained herein is your responsibility alone
and Choice Broking its subsidiaries or its employees or associates will not be liable in any manner for the consequences of such action taken by you. We
have exercised due diligence in checking the correctness and authenticity of the information contained in this recommendation, but Choice Broking or any of
its subsidiaries or associates or employees shall not be in any way responsible for any loss or damage that may arise to any person from any inadvertent
error in the information contained in this recommendation or any action taken on basis of this information. Technical analysis studies market psychology,
price patterns and volume levels. It is used to forecast future price and market movements. Technical analysis is complementary to fundamental analysis
and news sources. The recommendations issued herewith might be contrary to recommendations issued by Choice Broking in the company research
undertaken as the recommendations stated in this report is derived purely from technical analysis. Choice Broking has based this document on information
obtained from sources it believes to be reliable but which it has not independently verified; Choice Broking makes no guarantee, representation or warranty
and accepts no responsibility or liability as to its accuracy or completeness. The opinions contained within the report are based upon publicly available
information at the time of publication and are subject to change without notice. The information and any disclosures provided herein are in summary form
and have been prepared for informational purposes. The recommendations and suggested price levels are intended purely for trading purposes. The
recommendations are valid for the day of the report however trading trends and volumes might vary substantially on an intraday basis and the
recommendations may be subject to change. The information and any disclosures provided herein may be considered confidential. Any use, distribution,
modification, copying, forwarding or disclosure by any person is strictly prohibited. The information and any disclosures provided herein do not constitute a
solicitation or offer to purchase or sell any security or other financial product or instrument. The current performance may be unaudited. Past performance
does not guarantee future returns. There can be no assurance that investments will achieve any targeted rates of return, and there is no guarantee against
the loss of your entire investment.
POTENTIAL CONFLICT OF INTEREST DISCLOSURE (as on date of report) Disclosure of interest statement – • Analyst interest of the stock
/Instrument(s): - No. • Firm interest of the stock / Instrument (s): - No.
Disclaimer
Contact Us
Amit Pathania
Research Associate
amit.pathania@choiceindia.com
Rohan Patil
Research Associate
rohan.patil@choiceindia.com
www.choicebroking.incustomercare@choiceindia.com
SEBI Registered - Research Analyst Equities I Commodities I Currencies I Mutual Funds
Aaj Ka Trend
23rd Nov’16
Neeraj Yadav
Research Advisor
neeraj.yadav@choiceindia.com
Anish Vyas
Senior Research Associate
anish.vyas@choiceindia.com
Amit Pathania
Digitally signed by Amit Pathania
DN: cn=Amit Pathania, o=Choice Equity Broking Pvt. ltd,
ou=Research Department,
email=amit.pathania@choiceindia.com, c=IN
Date: 2016.11.23 08:44:32 +05'30'

Aaj ka trend 23.11.16

  • 1.
    Equities I CommoditiesI Currencies I Mutual Funds Aaj Ka Trend Technical View: MCX Gold prices has witnessed breakdown of its Rising Channel pattern at 29086 levels on hourly time frame. On daily chart, MCX Gold prices are trading below its Horizontal Trend line. Moreover, MCX Gold prices are trading below its 50 HEMA which suggest short term trend remains down. Moreover, Momentum Indicator RSI is trading below 50 levels on hourly time frame which indicates negative momentum to the prices. For now we expect prices should move lower towards 28700 levels in the coming trading sessions. SEBI Registered - Research Analyst Equities I Commodities I Currencies I Mutual Funds Bullions MCX Gold Dec Daily Chart CMP: 29140 MCX Gold (Dec) Trend: Bearish Price potential: 28700 Reversal: 29325 MCX Silver Dec Daily Chart CMP: 40710 Technical View: On hourly chart, MCX Silver prices are trading in a consolidation pattern which is expected to break on the higher side. Moreover, MCX Silver prices are trading above its 05 HEMA which suggest short term trend remains up. Furthermore, on COMEX Silver Prices has completed Bullish White Swan Harmonic pattern at $16.44 levels. In Addition, Momentum Indicator RSI is also observed bullish Range swift on hourly time frame which indicates positive momentum to the prices. For now we expect prices to move higher towards 41550 levels in few trading sessions. MCX Silver (Dec) Trend: Bullish Price potential: 41550 Reversal: 40350 Pivot levels for the Day S1 S2 S3 Pivot R1 R2 R3 Gold 29905 29069 28975 29163 29196 29257 29351 Silver 40508 40500 40226 40774 40782 41048 41322 23rd Nov’16
  • 2.
    Equities I CommoditiesI Currencies I Mutual Funds Technical View: As per yesterdays view MCX Copper traded on a higher side and achieved our short term target of 386. On hourly chart, MCX Copper price are trading above its Consolidation Range on hourly time frame. Moreover, COMEX Copper has observed breakout of its Symmetrical pattern at $2.50 levels on hourly chart. In addition MCX Copper prices are trading above its 21 HEMA. For now we expect prices to move higher towards 390 levels in coming trading sessions. SEBI Registered - Research Analyst Equities I Commodities I Currencies I Mutual Funds MCX Copper Nov Daily Chart CMP: 382.90 MCX Copper (Nov) Trend: Bullish Price potential: 390 Reversal: 376 MCX Crude Oil Dec. Daily Chart CMP: 3260 Technical View: As per our yesterdays view MCX Crude Oil traded on a higher side and achieved our short term target of 3340. MCX Crude oil price have witnessed breakout of its consolidation pattern at 3224 levels on hourly chart. MCX Crude Oil is trading above its 21 HEMA on hourly chart. Moreover, Momentum indicator RSI is trading above 60 levels on hourly chart which suggest the positive movement in the prices. For now we expect prices to move higher 3360 towards levels in coming trading sessions. MCX Crude Oil (Dec) Trend: Bullish Price potential: 3360 Reversal: 3210 Pivot levels for the Day S1 S2 S3 Pivot R1 R2 R3 Copper 376.6 374.8 367.8 381.7 383.6 388.7 395.6 Crude 3274 3232 3148 3316 3358 3400 3484 Base Metal Energy Aaj Ka Trend 23rd Nov’16
  • 3.
    Equities I CommoditiesI Currencies I Mutual FundsSEBI Registered - Research Analyst Equities I Commodities I Currencies I Mutual Funds Other Base Metals & Energy S1 S2 S3 Pivot R1 R2 R3 Trend Copper 376.6 374.8 367.8 381.7 383.6 388.7 395.6 Aluminum 117.3 117.0 115.9 118.2 118.4 119.3 120.5 Lead 146.9 146.3 144.3 148.4 148.9 150.4 152.5 Nickel 770.7 765.3 752.8 777.8 783.2 790.3 802.8 Zinc 174.8 174.6 172.8 176.5 176.7 178.3 180.2 Natural Gas 198.2 195.8 189.9 201.7 204.1 207.6 213.5 Fundamental News:  Gold prices rose for a second day on Tuesday as the weaker dollar helped lift the precious metal off recent lows.  Prices of the yellow metal are down more than 4% so far this month amid optimism that increased U.S. fiscal spending under a Trump administration will spur economic growth and inflation, which would ultimately lead to an era of higher interest rates.  OPEC should allow Iraq to continue raising output with no restrictions, Foreign Minister Ibrahim al-Jafari told reporters in Budapest on Tuesday, commenting on a plan by the organization to limit supply in order to support prices.  OPEC experts discussing how to implement a plan to cut oil output are likely to reach agreement later on Tuesday, a Nigerian delegate said, a possible sign of progress in finalizing the group's first supply-limiting deal since 2008.  Iraq Tuesday insisted on an exemption from planned OPEC output cuts as it fights Islamic State.  Oil prices rose on Tuesday to their highest this month as a growing consensus emerged in the market that OPEC would overcome internal disputes and skepticism to strike a deal that materially reduces crude output.  Oil Tuesday remained firm after strong overnight gains on optimism of an OPEC deal to cut output.  Oil prices pared back gains after hitting their highest levels since October on Tuesday, amid fresh doubts over whether the Organization of the Petroleum Exporting Countries will be able to reach an agreement to limit output. Aaj Ka Trend 23rd Nov’16
  • 4.
    Equities I CommoditiesI Currencies I Mutual FundsSEBI Registered - Research Analyst Equities I Commodities I Currencies I Mutual Funds International Market Commodity Closing Price Gold 1214.50 Silver 16.70 Crude Oil 47.92 Brent Crude Oil 49.03 Natural Gas 2.94 COMEX/NYMEX/ICE ( Precious Metals & Energy) Currency & Commodity Index Currency (Spot) Current Price USD / INR 68.40 Dollar Index 101.05 EUR / USD 1.06 CRB Index* 187.56 Closing as on 22.11.16 *Closing as on 22.11.16 LME (Base Metals) ( $ per tones) Commodity Closing Price Copper 5610 Aluminum 1764 Zinc 2580 Lead 2180 Nickel 11250 SHFE (Base Metals) (Yuan per tones) Commodity Closing Price Copper 43900 Aluminum 13550 Zinc 20820 Lead 17950 Closing as on 22.11.16 Closing as on 22.11.16 LME INVENTORY DATA Aaj Ka Trend 16-Nov-16 17-Nov-16 18-Nov-16 21-Nov-16 22-Nov-16 Aluminium 61525 3401 -5900 -5451 -8051 Copper -4100 2275 -4175 -6626 -4798 Lead 600 -25 775 0 -1025 Nickel -144 48 0 581 1025 Zinc -100 -375 -325 -202 -76 23rd Nov’16
  • 5.
    Equities I CommoditiesI Currencies I Mutual Funds This is solely for information of clients of Choice Broking and does not construe to be an investment advice. It is also not intended as an offer or solicitation for the purchase and sale of any financial instruments. Any action taken by you on the basis of the information contained herein is your responsibility alone and Choice Broking its subsidiaries or its employees or associates will not be liable in any manner for the consequences of such action taken by you. We have exercised due diligence in checking the correctness and authenticity of the information contained in this recommendation, but Choice Broking or any of its subsidiaries or associates or employees shall not be in any way responsible for any loss or damage that may arise to any person from any inadvertent error in the information contained in this recommendation or any action taken on basis of this information. Technical analysis studies market psychology, price patterns and volume levels. It is used to forecast future price and market movements. Technical analysis is complementary to fundamental analysis and news sources. The recommendations issued herewith might be contrary to recommendations issued by Choice Broking in the company research undertaken as the recommendations stated in this report is derived purely from technical analysis. Choice Broking has based this document on information obtained from sources it believes to be reliable but which it has not independently verified; Choice Broking makes no guarantee, representation or warranty and accepts no responsibility or liability as to its accuracy or completeness. The opinions contained within the report are based upon publicly available information at the time of publication and are subject to change without notice. The information and any disclosures provided herein are in summary form and have been prepared for informational purposes. The recommendations and suggested price levels are intended purely for trading purposes. The recommendations are valid for the day of the report however trading trends and volumes might vary substantially on an intraday basis and the recommendations may be subject to change. The information and any disclosures provided herein may be considered confidential. Any use, distribution, modification, copying, forwarding or disclosure by any person is strictly prohibited. The information and any disclosures provided herein do not constitute a solicitation or offer to purchase or sell any security or other financial product or instrument. The current performance may be unaudited. Past performance does not guarantee future returns. There can be no assurance that investments will achieve any targeted rates of return, and there is no guarantee against the loss of your entire investment. POTENTIAL CONFLICT OF INTEREST DISCLOSURE (as on date of report) Disclosure of interest statement – • Analyst interest of the stock /Instrument(s): - No. • Firm interest of the stock / Instrument (s): - No. Disclaimer Contact Us Amit Pathania Research Associate amit.pathania@choiceindia.com Rohan Patil Research Associate rohan.patil@choiceindia.com www.choicebroking.incustomercare@choiceindia.com SEBI Registered - Research Analyst Equities I Commodities I Currencies I Mutual Funds Aaj Ka Trend 23rd Nov’16 Neeraj Yadav Research Advisor neeraj.yadav@choiceindia.com Anish Vyas Senior Research Associate anish.vyas@choiceindia.com Amit Pathania Digitally signed by Amit Pathania DN: cn=Amit Pathania, o=Choice Equity Broking Pvt. ltd, ou=Research Department, email=amit.pathania@choiceindia.com, c=IN Date: 2016.11.23 08:44:32 +05'30'