The document discusses calculating the area between two curves. It explains that this area is defined as the limit of the sum of the areas of rectangles between the curves as the number of rectangles approaches infinity, which is represented by a definite integral. It provides examples of finding the area between curves defined by various functions through setting up and evaluating the appropriate definite integral.


![“Proof”
Find the limit of the area of rectangles given by a
representative rectangle:
The area would be the limit of
the sum of the areas of infinite
representative rectangles with
infinitely small intervals (n → ∞):
n
lim ∑ [ f ( xi ) − g ( xi ) ] ∆x
n →∞
i −1
This is the integral:
b
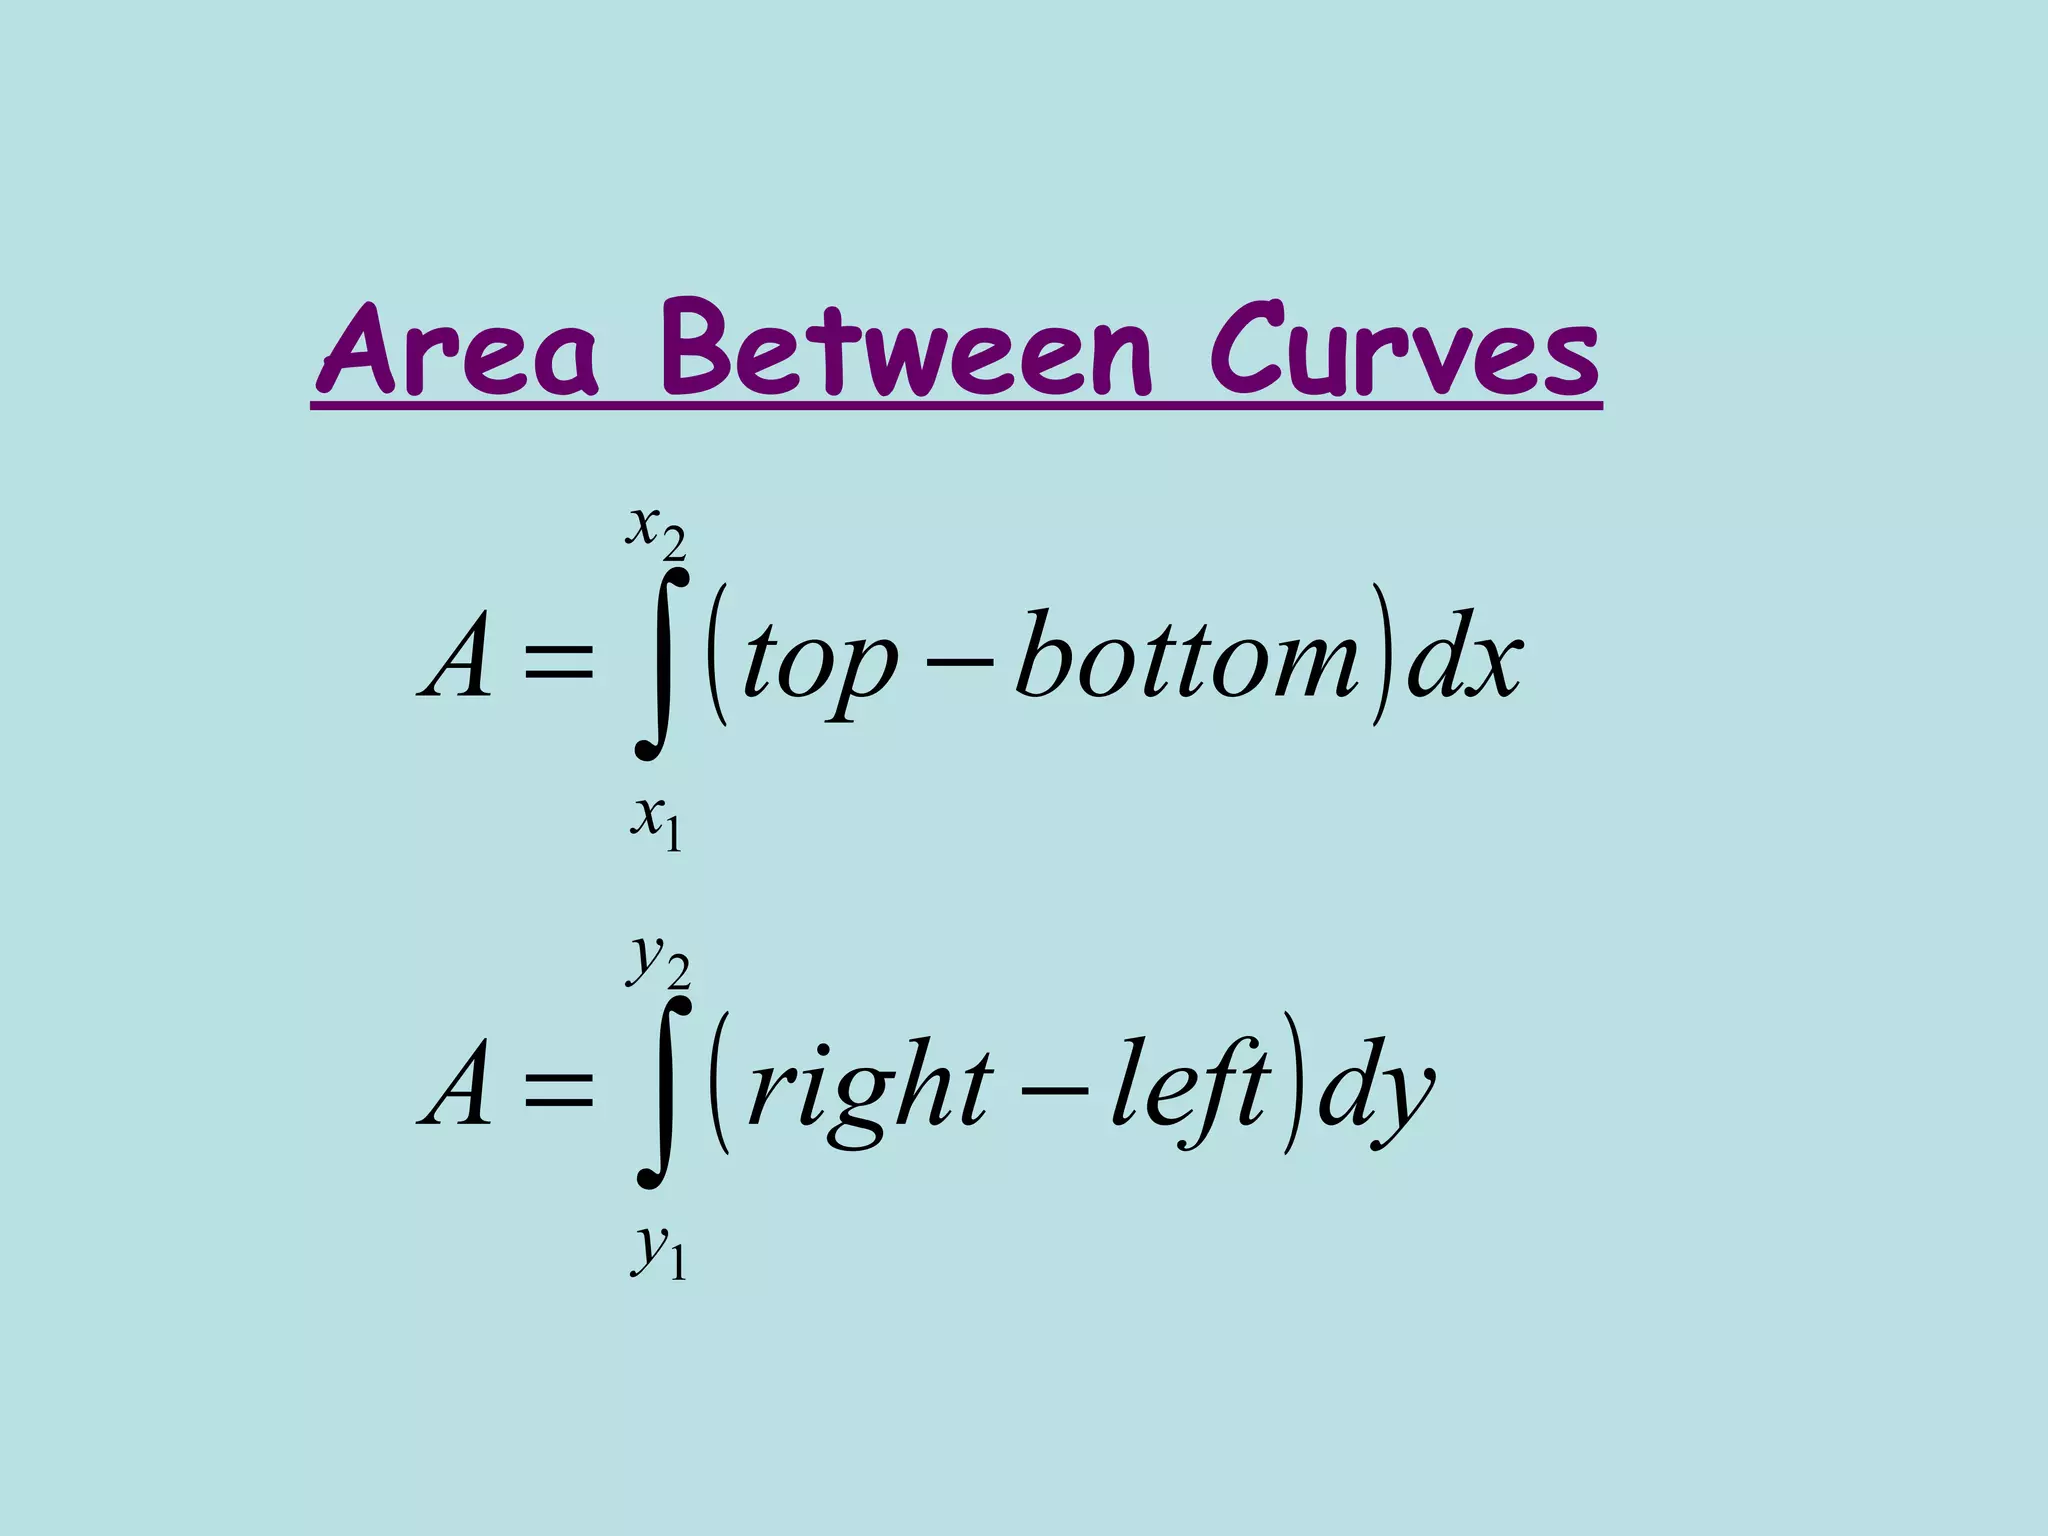
∫ [ f ( x ) − g ( x ) ] dx
a](https://image.slidesharecdn.com/7-131206203704-phpapp02/75/7-1-area-between-curves-3-2048.jpg)