Download to read offline

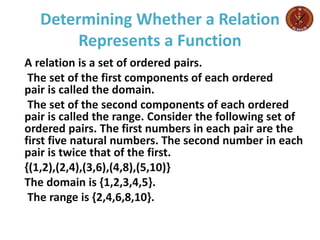
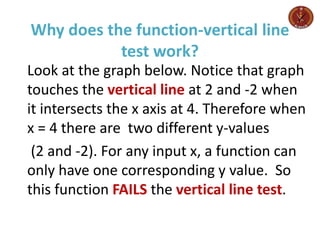
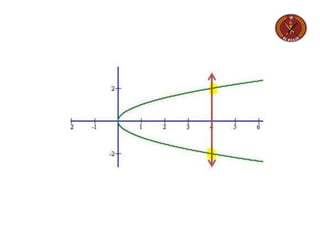
![Example ; Finding an Equation of a Function
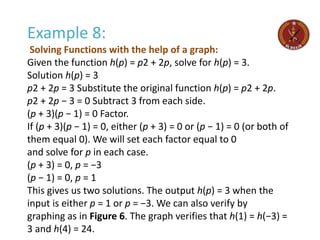
Express the relationship 2n + 6p = 12 as a function p = f (n), if possible.
Solution To express the relationship in this form, we need to be able to write
the relationship where p is a function
of n, which means writing it as p = [expression involving n].
2n + 6p = 12
6p = 12 − 2n Subtract 2n from both sides.
p =2-1/3 n.
Therefore, p as a function of n is written as
p = f (n) = 2-1/3 n.
Analysis;
It is important to note that not every relationship expressed by
an equation can also be expressed as a function
with a formula.](https://image.slidesharecdn.com/functionnotationbysadiq-210805025455/85/Function-notation-by-sadiq-26-320.jpg)
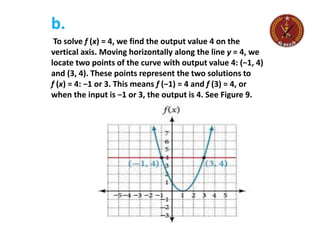


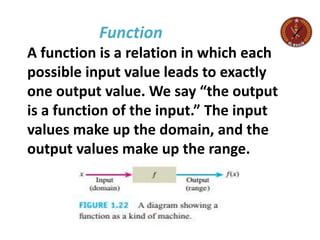
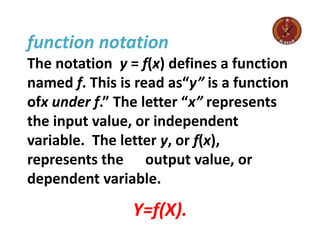
This document provides an overview of function notation and how to work with functions. It defines what a function is as a relation that assigns a single output value to each input value. It shows how functions can be represented using standard notation like f(x) and discusses evaluating functions by inputting values. Examples are provided of determining if a relationship represents a function, evaluating functions from tables and graphs, and solving functional equations.