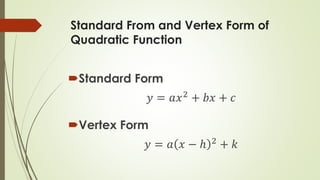
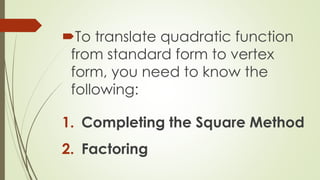
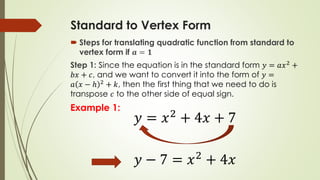
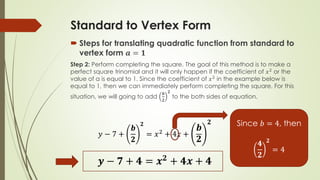
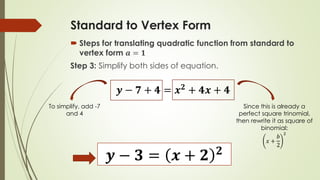
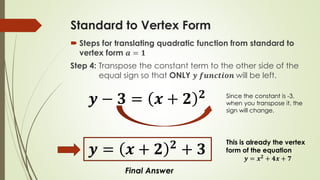
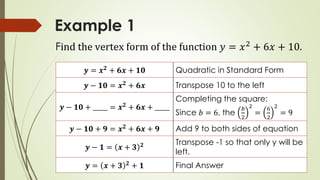
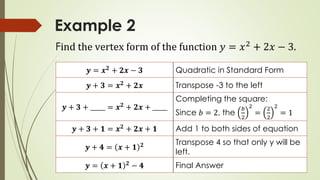
Hello!
This presentation contains step by step process on how to translate quadratic function from standard form into vertex form when the value of a is equal to 1.
Quadratic Equations (Quadratic Formula) Using PowerPointrichrollo
This document summarizes the steps to solve a quadratic equation using the quadratic formula. It works through solving the specific equation 5y^2 - 8y + 3 = 0 as an example. The key steps are: 1) Identifying the coefficients a, b, and c; 2) Plugging these into the quadratic formula; 3) Simplifying the terms; 4) Isolating the variable to find the solutions of 1 and 0.6. These solutions are then checked by substituting them back into the original equation.
The document provides an overview of quadratic functions including definitions of key terms like quadratic function, parabola, quadratic equation, and vertex form. It discusses how to graph quadratic functions, solve quadratic equations using methods like the quadratic formula, and find the maximums and minimums of quadratic functions. It includes examples of using these techniques to solve word problems involving quadratic applications. The document aims to teach students about the basic concepts of quadratic functions.
The document discusses solving quadratic equations by finding the roots or solutions of the equation. It explains that a quadratic equation is of the form ax^2 + bx + c = 0, where a ≠ 0. The roots are the values of x that make the equation equal to 0. To solve the equation, it is set equal to 0 and the square root property, that if x^2 = k then x = ±√k, is applied to find the two roots of the quadratic equation. Several examples are shown step-by-step to demonstrate solving quadratic equations to find their two roots.
This document discusses using the point-slope form to find the equation of a line given a slope and point. It provides the point-slope form equation, and examples of finding the line equation for different slopes and points. Exercises are provided for the reader to practice finding additional line equations using given slopes and points.
This document discusses solving quadratic inequalities. It provides examples of single-variable quadratic inequalities and explains how to find the solution set by first setting the inequality equal to an equation, solving for the roots, and then testing values within the intervals formed by the roots. The document also introduces quadratic inequalities with two variables and how to represent them. It defines a quadratic inequality and explains the process of solving them by relating it back to solving a quadratic equation.
This document introduces methods for solving quadratic equations beyond factoring, including the square root property, completing the square, and the quadratic formula. It discusses how to determine the number and type of solutions based on the discriminant. The key steps are presented for solving quadratics, graphing quadratic functions as parabolas, and finding the domain and range. Piecewise-defined quadratic functions are also explained.
The document discusses linear equations in two variables. It defines a linear equation as one that can be written in the standard form Ax + By = C, where A, B, and C are real numbers and A and B cannot both be zero. Examples are provided of determining if equations are linear and identifying the A, B, and C components if they are linear. The document also discusses using ordered pairs as solutions to linear equations and finding multiple solutions to a given linear equation.
This document provides an overview of linear functions and equations. It defines linear equations as having the standard form Ax + By = C, with examples and how to identify linear vs. nonlinear equations. Linear functions are defined as having the form f(x) = mx + b. The document discusses slope, x-intercepts, y-intercepts, and how to graph linear equations from these components. It also covers representing linear functions in slope-intercept form as y = mx + b, and point-slope form as y - y1 = m(x - x1).
solving quadratic equations using quadratic formulamaricel mas
The document discusses how to use the quadratic formula to solve quadratic equations. It provides the formula: x = (-b ± √(b2 - 4ac)) / 2a. It then works through examples of writing quadratic equations in standard form (ax2 + bx + c = 0) and using the formula to solve them. Specifically, it solves the equations: 1) 1x2 + 3x - 27 = 0, 2) 2x2 + 7x + 5 = 0, 3) x2 - 2x = 8, and 4) x2 - 7x = 10. It concludes by providing 3 additional equations to solve using the quadratic formula.
This document provides examples for solving quadratic equations by factoring. It explains how to solve equations of the form ax^2 + bx = 0 and ax^2 + bx + c = 0 by factoring and setting each factor equal to zero. Some example problems are worked out step-by-step, including solving 11x^2 - 13x = 8x - 3x^2 and 7x^2 + 18x = 10x^2 + 12x. The document also discusses using the fact that the roots of ax^2 + bx = 0 are x = 0 and x = -b/a to solve equations without factoring. It concludes by explaining how to use the zero product property to solve a quadratic
This powerpoint presentation discusses or talks about the topic or lesson Functions. It also discusses and explains the rules, steps and examples of Quadratic Functions.
1) This document discusses how to solve quadratic equations by graphing, including identifying the terms of a quadratic equation, finding the solutions by graphing, and graphing quadratic functions.
2) The key steps for graphing a quadratic function are to find the axis of symmetry using the standard form equation, find the vertex point, and find two other points to reflect across the axis of symmetry to complete the parabolic graph.
3) An example problem walks through graphing the quadratic equation y = x^2 - 4x by first finding the roots, vertex, and axis of symmetry, and then constructing a table to plot points and graph the parabola.
This document discusses graphing quadratic functions. It defines a quadratic function as having the form y = ax^2 + bx + c, where a is not equal to 0. The graph of a quadratic function is a U-shaped parabola. It discusses finding the vertex and axis of symmetry in standard form, vertex form, and intercept form. Examples are provided for graphing quadratic functions written in these three forms.
This document contains a lesson on slope of a line from a mathematics course. It includes examples of calculating slope given two points on a line, identifying whether graphs represent constant or variable rates of change, and word problems applying slope to real-world contexts like cost of fruit and gas. The key points are that slope is defined as the ratio of rise over run, or change in y over change in x, and represents the constant rate of change for linear equations and functions.
This document provides information about radicals and working with radical expressions. It defines square roots, principal and negative square roots, radicands, perfect squares, cube roots, nth roots, and the product, quotient, and power rules for radicals. It discusses simplifying radical expressions using these rules as well as adding, subtracting, multiplying, and dividing radicals. The document also covers rationalizing denominators, solving radical equations, and using the Pythagorean theorem and distance formula.
Finding Slope Given A Graph And Two PointsGillian Guiang
The student will learn to find the slope of a line given two points on a graph or explicitly given the points. Slope is defined as the steepness or rise over run of a line between two points. You can find the slope by taking the difference in the y-values and dividing by the difference in the x-values of the two points. Slope can be positive, negative, zero if horizontal, or undefined if vertical. Examples are worked through of finding the slope given two points on a graph or the points explicitly.
Here are some things you did well and could improve on:
WWW:
- You explained the key concepts around writing the equation of a circle clearly and concisely. Breaking it down step-by-step makes it easy to understand.
- Providing examples with worked solutions is very helpful for reinforcement. The visual diagrams additionally aid comprehension.
- Giving practice problems for students to try on their own, along with answers, allows for application of the material.
EBI:
- Some of the text could be formatted for easier reading (e.g. consistent formatting of equations).
- Adding brief summaries or recaps after sections of explanation may aid retention.
- Providing guidance on common errors
This document defines slope and provides examples for teaching students about slope. It explains that slope is the ratio of vertical to horizontal change and can be positive, negative, zero, or undefined. The objectives are for students to identify slope from graphs, calculate slope using rise over run, and apply the slope formula to find slope given two points. Examples are provided to demonstrate calculating slope from graphs and points using rise over run and the slope formula.
A quadratic inequality is an inequality involving a quadratic expression, such as ax^2 + bx + c < 0. To solve a quadratic inequality, we first find the solutions to the corresponding equation (set the inequality equal to 0) and then test values on either side of those solutions in the original inequality to determine the solutions to the inequality. The solutions to the inequality will be all values of the variable that satisfy the given relationship.
Nature of Roots of Quadratic Equation.pptxssuser2b0f3a
This document discusses the nature of roots of quadratic equations based on the discriminant. It defines the discriminant as the number used to describe the nature of roots, with the formula d = b^2 - 4ac. It then outlines the nature of roots for different values of the discriminant: if d > 0 the roots are two real and unequal, if d = 0 the root is one real, and if d < 0 there are no real roots. It provides examples of finding the discriminant and describing the nature of roots for quadratic equations.
For more instructional resources, CLICK me here!
https://tinyurl.com/y9muob6q
LIKE and FOLLOW me here!
https://tinyurl.com/ycjp8r7u
https://tinyurl.com/ybo27k2u
This document provides instructions for solving systems of equations using elimination. It demonstrates eliminating variables by adding or subtracting equations. Sample systems are worked through, showing the steps of identifying which variable to eliminate, combining the equations accordingly, solving for one variable, then substituting back into the original equations to solve for the other. The solutions are checked in both equations to verify they satisfy the system.
The document introduces two methods for solving quadratic equations - factoring and graphing. It provides examples of equations that cannot be solved using these methods. It then introduces the quadratic formula as the method to use for equations that cannot be factored or graphed easily. It walks through identifying the a, b, and c coefficients needed for the quadratic formula. It provides examples of using the formula and encourages practicing with a worksheet.
This document provides steps for solving radical equations:
1) Isolate the radical on one side of the equation by performing inverse operations
2) Raise both sides of the equation to a power equal to the index of the radical to eliminate the radical
3) Solve the remaining polynomial equation
It includes examples of solving simpler radical equations as well as more complex equations involving fractions and multiple radicals. Checking solutions is emphasized as extraneous solutions may occasionally occur. Graphing calculators can also help visualize and find solutions to radical equations.
The document provides an overview of quadratic equations, including:
1) Quadratic equations take the form of ax^2 + bx + c = 0 and involve an unknown (x) and known coefficients (a, b, c).
2) Quadratic equations can be solved through factoring, completing the square, using the quadratic formula, or graphing.
3) The quadratic formula provides the general solution for quadratic equations as x = (-b ± √(b^2 - 4ac))/2a.
Graphing Quadratic Functions in Standard Formcmorgancavo
This document discusses graphing quadratic functions of the form y = ax^2 + bx + c. It provides the following key points:
- Quadratic functions produce parabolic graphs that open up or down depending on whether a is positive or negative.
- The vertex of the parabola is the point of minimum or maximum, which corresponds to the line of symmetry that passes through it.
- To graph a quadratic, one finds the line of symmetry, determines the vertex coordinates, and plots at least four other points to connect into a smooth curve.
The document discusses proportional relationships in triangles using theorems about parallel lines and angle bisectors. It provides examples of applying the side-splitter theorem and triangle-angle-bisector theorem to find unknown values in various geometric figures by setting up proportional relationships between corresponding sides or segments. Readers are given practice problems applying these proportional relationship theorems to find specific variable values in diagrams.
This document provides a lesson on writing and graphing linear equations in slope-intercept form. It begins with examples of finding the slope and y-intercept of lines and writing the equation in the form y = mx + b. Then it shows how to graph lines from their equations in slope-intercept form. Applications include writing cost functions and finding values. A quiz reviews writing equations from slopes and points and graphing lines from their equations.
Translating vertex form into standard form when a=1ChristianManzo5
Hello!
This presentation contains step by step process on how to translate quadratic function from vertex form back to standard form when the value of a is equal to 1.
Translating vertex form into standard form when a is not equal to 1ChristianManzo5
The document provides steps for translating a quadratic function from vertex form to standard form when a ≠ 1. It explains that the vertex form can be written as the square of a binomial. Using FOIL multiplication and the distributive property, the terms can be distributed and combined to obtain the standard form. Two examples are provided and worked through to demonstrate the process.
A quadratic equation is any equation that can be written in the form ax^2 + bx + c = 0, where a, b, and c are constants and a ≠ 0. It is an equation of the second degree that contains at least one term that is squared. The ax^2 term is called the quadratic term, the bx term is the linear term, and c is the constant term. There are several methods for solving quadratic equations, including factoring, completing the square, and using the quadratic formula.
This document provides instruction on solving quadratic equations by completing the square. It begins by defining a quadratic equation and explaining why the coefficient of the quadratic term cannot be zero. It then presents the steps to solve a quadratic equation by completing the square, which involves transforming the equation into the form (x - h)2 = k. An example problem is worked through to demonstrate the process.
This document discusses solving quadratic equations by completing the square. It begins by stating the objectives and key understandings of quadratic equations and the completing the square method. It then outlines the steps to complete the square, which involves rewriting the equation as a perfect square trinomial. Several examples are shown using algebra tiles and calculations. Finally, applications of completing the square to real-life problems in physics, engineering, architecture and economics are described.
This document discusses different types of functions including polynomials, rational functions, radical functions, absolute value functions, exponential functions, logarithmic functions, and trigonometric functions. It provides examples of how to sketch graphs of various functions by completing the square, reflecting, shifting, compressing/expanding, and using properties of exponentials, logarithms, and trigonometric functions. Key aspects like periodicity and domains/ranges are also covered.
Basic concepts of integration, definite and indefinite integrals,properties of definite integral, problem based on properties,method of integration, substitution, partial fraction, rational , irrational function integration, integration by parts, reduction formula, improper integral, convergent and divergent of integration
This document provides information about quadratic functions including:
1. Quadratic functions have graphs that form a U-shaped curve called a parabola with a single turning point called the vertex.
2. The axis of symmetry of the parabola passes through the vertex and divides the graph into two symmetrical parts.
3. Quadratic functions can be transformed between the standard form f(x)=ax^2 + bx + c and the vertex form f(x)=a(x-h)^2 + k using completing the square. This allows finding the vertex (h,k) of the parabola.
4. Examples show how to transform quadratic functions between the standard and vertex
Methods of integration, integration of rational algebraic functions, integration of irrational algebraic functions, definite integrals, properties of definite integral, integration by parts, Bernoulli's theorem, reduction formula
The document discusses quadratic functions and parabolas. It defines a quadratic function as any function of the form f(x) = ax^2 + bx + c, where a, b, and c are real numbers and a ≠ 0. The graph of a quadratic function is called a parabola. Parabolas are symmetric and have an axis of symmetry, with a vertex point where the axis intersects the parabola. Standard and vertex forms for writing quadratic functions are presented, along with examples of finding the vertex and axis of symmetry from a given quadratic equation. Additional examples demonstrate how to graph parabolas and write the equation of a parabola given its graph.
How to Find the Slope of a Tangent Line? The slope of a tangent line at a point is its derivative at that point. If a tangent line is drawn for a curve y = f(x) at a point (x0, y0), then its slope (m) is obtained by simply substituting the point in the derivative of the function. i.e., m = (f '(x))(x0, y0).
The document discusses determining the equation of a circle given its diameter or radius and center. It provides an example of finding the standard form equation of a circle given the endpoints of its diameter (-3,6) and (3,-2). It also presents a word problem about determining if a point (3,3) lies within a danger zone defined as a circle of radius 4km centered at the origin. It shows solving this graphically and by substituting the point into the standard form equation.
1. This document discusses graph transformations of functions, including translations, stretches, and reflections. It provides rules for how modifications inside and outside the function f(x) will affect the x-values and y-values of the graph.
2. Examples are given of applying transformation rules to specific points on a graph and determining the new coordinates. The document also demonstrates sketching a transformed graph using key points.
3. An exercise section provides multiple choice and short answer questions to test understanding of describing transformations and finding coordinates of transformed points.
Solving Quadratic Equation by Completing the Square.pptxDebbieranteErmac
This document provides instructions for solving quadratic equations using the completing the square method. It begins with examples of perfect square trinomials and how to create them. It then walks through the steps to solve quadratic equations by completing the square, which involves getting the quadratic term alone on one side, finding the term to complete the square, factoring the resulting perfect square trinomial, and taking the square root of each side to solve for the roots. Several examples are worked through and similar problems are provided for practice.
The document discusses the transformation of coordinates from rectangular to polar coordinates and vice versa. It provides definitions and examples of how to perform these transformations using trigonometric functions. It also explains how to perform translations and rotations of coordinate axes, providing examples of transforming equations under these changes of coordinates. Finally, it discusses representing a circle and parabola using polar coordinate equations.
The derivative of a function represents the rate of change of one variable with respect to another at a given point. It is a slope and itself a function that varies across points. To find the derivative of a function f(x) at a point, we use the slope formula and take the limit as the change in x approaches 0. For example, the derivative of x^2 is 2x, meaning the slope or rate of change of x^2 is 2x at any point. There are various rules for finding derivatives, such as the power rule, sum and difference rules, product rule and quotient rule.
The document discusses function notation and transformations of functions. It provides examples of writing quadratic, cubic, and rational functions in function notation. It also demonstrates how functions are translated vertically by adding or subtracting a number from the original function. Translating a function f(x) by a results in the new function f(x)+a or f(x)-a.
Ejercicios resueltos de analisis matematico 1tinardo
The document describes the logarithmic differentiation method used to derive functions where the exponent is a variable. It explains the steps: take the natural log of both sides, apply logarithm properties, derive both terms, isolate the function, and substitute back in. Examples are provided and solved, such as deriving y=xx, y=sen(x)(x3+6x), and y=ln x3 + 5x2cos(x). Related activities are summarized with solutions to practice problems applying this method.
This document defines and provides examples of key concepts related to lines in geometry, including:
- Distance between two points, which is calculated using a formula involving the x- and y-coordinates of the points.
- Midpoint of a line segment, whose coordinates are the average of the x- and y-coordinates of the two endpoints.
- Slope of a line, which is calculated as the rise over the run between two points and defines the line's angle of inclination.
- Equation of a line, which can be written in point-slope or standard form using the slope and coordinates of a point on the line.
Several examples are provided of calculating the distance, midpoint, slope,
Similar to Translating standard form into vertex form if a=1 (20)
Walmart Business+ and Spark Good for Nonprofits.pdfTechSoup
"Learn about all the ways Walmart supports nonprofit organizations.
You will hear from Liz Willett, the Head of Nonprofits, and hear about what Walmart is doing to help nonprofits, including Walmart Business and Spark Good. Walmart Business+ is a new offer for nonprofits that offers discounts and also streamlines nonprofits order and expense tracking, saving time and money.
The webinar may also give some examples on how nonprofits can best leverage Walmart Business+.
The event will cover the following::
Walmart Business + (https://business.walmart.com/plus) is a new shopping experience for nonprofits, schools, and local business customers that connects an exclusive online shopping experience to stores. Benefits include free delivery and shipping, a 'Spend Analytics” feature, special discounts, deals and tax-exempt shopping.
Special TechSoup offer for a free 180 days membership, and up to $150 in discounts on eligible orders.
Spark Good (walmart.com/sparkgood) is a charitable platform that enables nonprofits to receive donations directly from customers and associates.
Answers about how you can do more with Walmart!"
A workshop hosted by the South African Journal of Science aimed at postgraduate students and early career researchers with little or no experience in writing and publishing journal articles.
How to Setup Warehouse & Location in Odoo 17 InventoryCeline George
In this slide, we'll explore how to set up warehouses and locations in Odoo 17 Inventory. This will help us manage our stock effectively, track inventory levels, and streamline warehouse operations.
ISO/IEC 27001, ISO/IEC 42001, and GDPR: Best Practices for Implementation and...PECB
Denis is a dynamic and results-driven Chief Information Officer (CIO) with a distinguished career spanning information systems analysis and technical project management. With a proven track record of spearheading the design and delivery of cutting-edge Information Management solutions, he has consistently elevated business operations, streamlined reporting functions, and maximized process efficiency.
Certified as an ISO/IEC 27001: Information Security Management Systems (ISMS) Lead Implementer, Data Protection Officer, and Cyber Risks Analyst, Denis brings a heightened focus on data security, privacy, and cyber resilience to every endeavor.
His expertise extends across a diverse spectrum of reporting, database, and web development applications, underpinned by an exceptional grasp of data storage and virtualization technologies. His proficiency in application testing, database administration, and data cleansing ensures seamless execution of complex projects.
What sets Denis apart is his comprehensive understanding of Business and Systems Analysis technologies, honed through involvement in all phases of the Software Development Lifecycle (SDLC). From meticulous requirements gathering to precise analysis, innovative design, rigorous development, thorough testing, and successful implementation, he has consistently delivered exceptional results.
Throughout his career, he has taken on multifaceted roles, from leading technical project management teams to owning solutions that drive operational excellence. His conscientious and proactive approach is unwavering, whether he is working independently or collaboratively within a team. His ability to connect with colleagues on a personal level underscores his commitment to fostering a harmonious and productive workplace environment.
Date: May 29, 2024
Tags: Information Security, ISO/IEC 27001, ISO/IEC 42001, Artificial Intelligence, GDPR
-------------------------------------------------------------------------------
Find out more about ISO training and certification services
Training: ISO/IEC 27001 Information Security Management System - EN | PECB
ISO/IEC 42001 Artificial Intelligence Management System - EN | PECB
General Data Protection Regulation (GDPR) - Training Courses - EN | PECB
Webinars: https://pecb.com/webinars
Article: https://pecb.com/article
-------------------------------------------------------------------------------
For more information about PECB:
Website: https://pecb.com/
LinkedIn: https://www.linkedin.com/company/pecb/
Facebook: https://www.facebook.com/PECBInternational/
Slideshare: http://www.slideshare.net/PECBCERTIFICATION
Main Java[All of the Base Concepts}.docxadhitya5119
This is part 1 of my Java Learning Journey. This Contains Custom methods, classes, constructors, packages, multithreading , try- catch block, finally block and more.
This presentation was provided by Steph Pollock of The American Psychological Association’s Journals Program, and Damita Snow, of The American Society of Civil Engineers (ASCE), for the initial session of NISO's 2024 Training Series "DEIA in the Scholarly Landscape." Session One: 'Setting Expectations: a DEIA Primer,' was held June 6, 2024.
A review of the growth of the Israel Genealogy Research Association Database Collection for the last 12 months. Our collection is now passed the 3 million mark and still growing. See which archives have contributed the most. See the different types of records we have, and which years have had records added. You can also see what we have for the future.
How to Manage Your Lost Opportunities in Odoo 17 CRMCeline George
Odoo 17 CRM allows us to track why we lose sales opportunities with "Lost Reasons." This helps analyze our sales process and identify areas for improvement. Here's how to configure lost reasons in Odoo 17 CRM
How to Make a Field Mandatory in Odoo 17Celine George
In Odoo, making a field required can be done through both Python code and XML views. When you set the required attribute to True in Python code, it makes the field required across all views where it's used. Conversely, when you set the required attribute in XML views, it makes the field required only in the context of that particular view.
2. Standard From and Vertex Form of
Quadratic Function
Standard Form
𝑦 = 𝑎𝑥2
+ 𝑏𝑥 + 𝑐
Vertex Form
𝑦 = 𝑎 𝑥 − ℎ 2
+ 𝑘
3. To translate quadratic function
from standard form to vertex
form, you need to know the
following:
1. Completing the Square Method
2. Factoring
4. Standard to Vertex Form
Steps for translating quadratic function from standard to
vertex form if 𝒂 = 𝟏
Step 1: Since the equation is in the standard form 𝑦 = 𝑎𝑥2 +
𝑏𝑥 + 𝑐, and we want to convert it into the form of 𝑦 =
𝑎 𝑥 − ℎ 2 + 𝑘, then the first thing that we need to do is
transpose 𝑐 to the other side of equal sign.
Example 1:
𝑦 = 𝑥2 + 4𝑥 + 7
𝑦 − 7 = 𝑥2
+ 4𝑥
5. Standard to Vertex Form
Steps for translating quadratic function from standard to
vertex form 𝒂 = 𝟏
Step 2: Perform completing the square. The goal of this method is to make a
perfect square trinomial and it will only happen if the coefficient of 𝑥2
or the
value of a is equal to 1. Since the coefficient of 𝑥2
in the example below is
equal to 1, then we can immediately perform completing the square. For this
situation, we will going to add
𝒃
𝟐
𝟐
to the both sides of equation.
𝑦 − 7 +
𝒃
𝟐
𝟐
= 𝑥2 + 4𝑥 +
𝒃
𝟐
𝟐
𝒚 − 𝟕 + 𝟒 = 𝒙 𝟐
+ 𝟒𝒙 + 𝟒
Since 𝑏 = 4, then
𝟒
𝟐
𝟐
= 4
6. Standard to Vertex Form
Steps for translating quadratic function from standard to
vertex form 𝒂 = 𝟏
Step 3: Simplify both sides of equation.
𝒚 − 𝟕 + 𝟒 = 𝒙 𝟐
+ 𝟒𝒙 + 𝟒
To simplify, add -7
and 4
Since this is already a
perfect square trinomial,
then rewrite it as square of
binomial:
𝑥 +
𝑏
2
2
𝒚 − 𝟑 = 𝒙 + 𝟐 𝟐
7. Standard to Vertex Form
Steps for translating quadratic function from standard to
vertex form 𝒂 = 𝟏
Step 4: Transpose the constant term to the other side of the
equal sign so that ONLY 𝒚 𝒇𝒖𝒏𝒄𝒕𝒊𝒐𝒏 will be left.
𝒚 − 𝟑 = 𝒙 + 𝟐 𝟐 Since the constant is -3,
when you transpose it, the
sign will change.
𝒚 = 𝒙 + 𝟐 𝟐
+ 𝟑
This is already the vertex
form of the equation
𝒚 = 𝒙 𝟐 + 𝟒𝒙 + 𝟕
Final Answer
9. Example 1
𝒚 = 𝒙 𝟐
+ 𝟔𝒙 + 𝟏𝟎 Quadratic in Standard Form
𝒚 − 𝟏𝟎 = 𝒙 𝟐
+ 𝟔𝒙 Transpose 10 to the left
𝒚 − 𝟏𝟎 + _____ = 𝒙 𝟐 + 𝟔𝒙 + _____
Completing the square:
Since 𝑏 = 6, the
𝑏
2
2
=
6
2
2
= 9
𝒚 − 𝟏𝟎 + 𝟗 = 𝒙 𝟐 + 𝟔𝒙 + 𝟗 Add 9 to both sides of equation
𝒚 − 𝟏 = 𝒙 + 𝟑 𝟐 Transpose -1 so that only y will be
left.
𝒚 = 𝒙 + 𝟑 𝟐
+ 𝟏 Final Answer
Find the vertex form of the function 𝑦 = 𝑥2
+ 6𝑥 + 10.
10. Example 2
𝒚 = 𝒙 𝟐
+ 𝟐𝒙 − 𝟑 Quadratic in Standard Form
𝒚 + 𝟑 = 𝒙 𝟐
+ 𝟐𝒙 Transpose -3 to the left
𝒚 + 𝟑 + _____ = 𝒙 𝟐 + 𝟐𝒙 + _____
Completing the square:
Since 𝑏 = 2, the
𝑏
2
2
=
2
2
2
= 1
𝒚 + 𝟑 + 𝟏 = 𝒙 𝟐 + 𝟐𝒙 + 𝟏 Add 1 to both sides of equation
𝒚 + 𝟒 = 𝒙 + 𝟏 𝟐 Transpose 4 so that only y will be
left.
𝒚 = 𝒙 + 𝟏 𝟐
− 𝟒 Final Answer
Find the vertex form of the function 𝑦 = 𝑥2
+ 2𝑥 − 3.