Downloaded 73 times


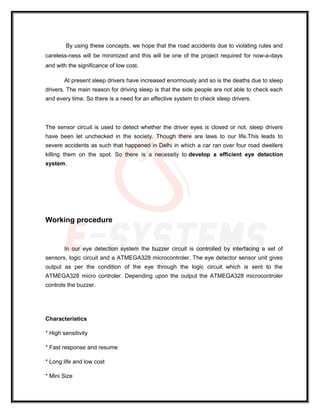
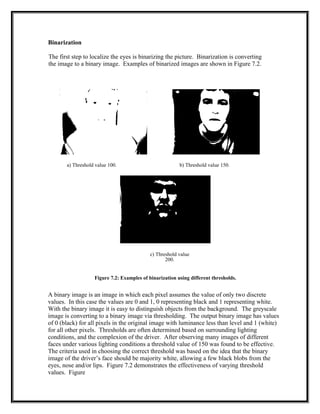
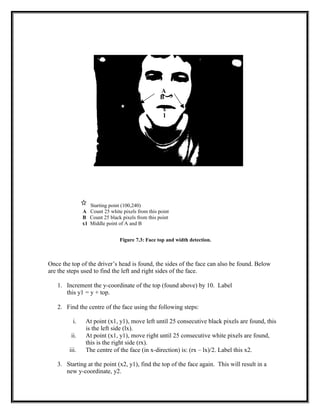
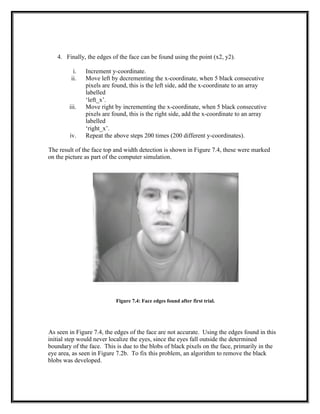
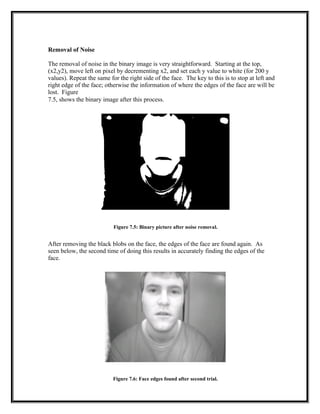
![Chapter 1
Introduction
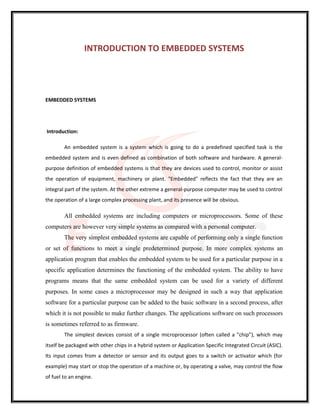
Driver fatigue is a significant factor in a large number of vehicle accidents. Recent
statistics estimate that annually 1,200 deaths and 76,000 injuries can be attributed to fatigue
related crashes [9].
The development of technologies for detecting or preventing drowsiness at the wheel is a
major challenge in the field of accident avoidance systems. Because of the hazard that
drowsiness presents on the road, methods need to be developed for counteracting its affects.
The aim of this project is to develop a prototype drowsiness detection system. The focus
will be placed on designing a system that will accurately monitor the open or closed state of
the driver’s eyes in real-time.
By monitoring the eyes, it is believed that the symptoms of driver fatigue can be detected
early enough to avoid a car accident. Detection of fatigue involves a sequence of images of
a face, and the observation of eye movements and blink patterns.
The analysis of face images is a popular research area with applications such as face
recognition, virtual tools, and human identification security systems. This project is
focused on the localization of the eyes, which involves looking at the entire image of the
face, and determining the position of the eyes by a self developed image-processing
algorithm. Once the position of the eyes is located, the system is designed to determine
whether the eyes are opened or closed, and detect fatigue.
8](https://image.slidesharecdn.com/5-drowsy-detector-150220102032-conversion-gate02/85/5-drowsy-detector-6-320.jpg)


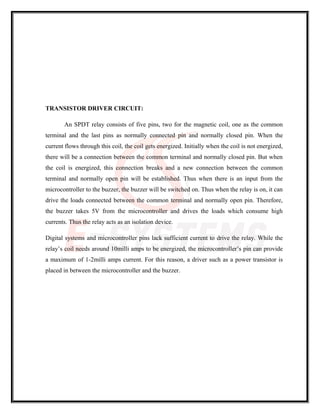

![Chapter 4
Literature Review
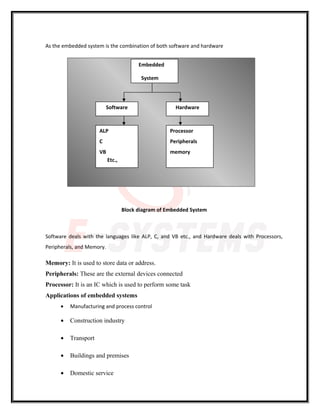
4.1 Techniques for Detecting Drowsy Drivers
Possible techniques for detecting drowsiness in drivers can be generally divided into the
following categories: sensing of physiological characteristics, sensing of driver
operation, sensing of vehicle response, monitoring the response of driver.
4.1.1 Monitoring Physiological Characteristics
Among these methods, the techniques that are best, based on accuracy are the ones based on
human physiological phenomena [9]. This technique is implemented in two ways:
measuring changes in physiological signals, such as brain waves, heart rate, and eye
blinking; and measuring physical changes such as sagging posture, leaning of the driver’s
head and the open/closed states of the eyes [9]. The first technique, while most accurate, is
not realistic, since sensing electrodes would have to be attached directly onto the driver’s
body, and hence be annoying and distracting to the driver. In addition, long time driving
would result in perspiration on the sensors, diminishing their ability to monitor accurately.
The second technique is well suited for real world driving conditions since it can be non-
intrusive by using optical sensors of video cameras to detect changes.
4.1.2 Other Methods
Driver operation and vehicle behaviour can be implemented by monitoring the steering
wheel movement, accelerator or brake patterns, vehicle speed, lateral acceleration, and
lateral displacement. These too are non-intrusive ways of detecting drowsiness, but are
limited to vehicle type and driver conditions. The final technique for detecting drowsiness is
by
1
1](https://image.slidesharecdn.com/5-drowsy-detector-150220102032-conversion-gate02/85/5-drowsy-detector-38-320.jpg)

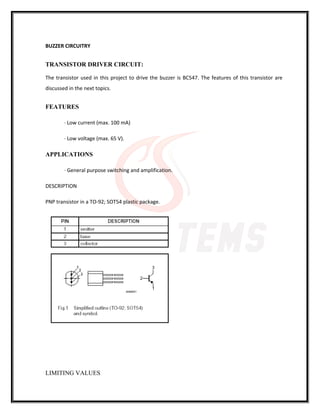
![Chapter 5
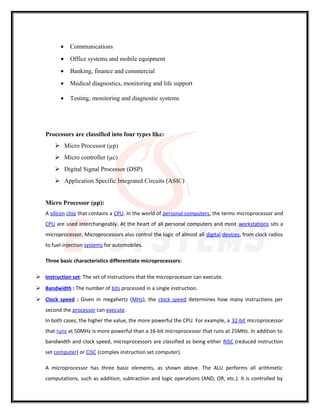
Design Issues
The most important aspect of implementing a machine vision system is the image
acquisition. Any deficiencies in the acquired images can cause problems with image
analysis and interpretation. Examples of such problems are a lack of detail due to
insufficient contrast or poor positioning of the camera: this can cause the objects to be
unrecognizable, so the purpose of vision cannot be fulfilled.
5.1 Illumination
A correct illumination scheme is a crucial part of insuring that the image has the correct
amount of contrast to allow to correctly process the image. In case of the drowsy driver
detection system, the light source is placed in such a way that the maximum light being
reflected back is from the face. The driver’s face will be illuminated using a 60W light
source. To prevent the light source from distracting the driver, an 850nm filter is placed
over the source. Since 850nm falls in the infrared region, the illumination cannot be
detected by the human eye, and hence does not agitate the driver. Since the algorithm
behind the eye monitoring system is highly dependant on light, the following important
illumination factors to consider are [1]:
1. Different parts of objects are lit differently, because of variations in the angle
of incidence, and hence have different brightness as seen by the camera.
2. Brightness values vary due to the degree of reflectivness of the object.
3. Parts of the background and surrounding objects are in shadow, and can also
affect the brightness values in different regions of the object.
4. Surrounding light sources (such as daylight) can diminish the effect of the
light source on the object.
1
3](https://image.slidesharecdn.com/5-drowsy-detector-150220102032-conversion-gate02/85/5-drowsy-detector-40-320.jpg)
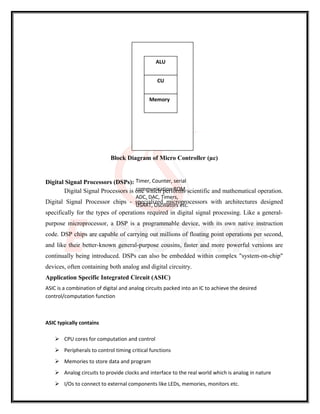
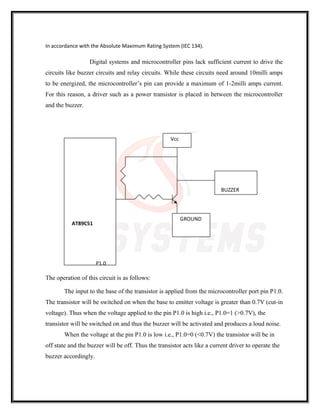
![5.2 Camera Hardware
The next item to be considered in image acquisition is the video camera. Review of several
journal articles reveals that face monitoring systems use an infrared-sensitive camera to
generate the eye images [3],[5],[6],[7]. This is due to the infrared light source used to
illuminate the driver’s face. CCD cameras have a spectral range of 400-1000nm, and peak
at approximately 800nm. The camera used in this system is a Sony CCD black and white
camera. CCD camera digitize the image from the outset, although in one respect – that
signal amplitude represents light intensity – the image is still analog.
5.3 Frame Grabbers and Capture Hardware
The next stage of any image acquisition system must convert the video signal into a format,
which can be processed by a computer. The common solution is a frame grabber board that
attaches to a computer and provides the complete video signal to the computer. The
resulting data is an array of greyscale values, and may then be analysed by a processor to
extract the required features. Two options were investigated when choosing the system’s
capture hardware. The first option is designing a homemade frame grabber, and the second
option is purchasing a commercial frame grabber. The two options are discussed below.
5.3.1 Homemade Frame Grabbers: Using the Parallel Port
Initially, a homemade frame grabber was going to be used. The design used was based
on the ‘Dirt Cheap Frame Grabber (DCFG)’, developed by Michael Day [2].
A detailed circuit description of the DCFG is beyond the scope of this report, but important
observations of this design were made. The DCFG assumes that the video signal will be
NTSC type compiling to the RS170 video standard. Although the DCFG successfully grabs
the video signal and digitizes it, the limitation to this design was that the parallel port could
not transfer the signal fast enough for real-time purposes. The DCFG was tested on two
different computers, a PC (Pentium I – 233MHz) and a laptop (Pentium III – 700MHz).
The laptop parallel port was much slower than the PC’s. Using the PC, which has a parallel
port of 4MHz, it was calculated that it would take approximately a minute to transfer a 480
x 640 pixel image. Because of the slow transfer rate of the parallel port it was concluded
that this type of frame grabber could not be used.
Another option was to build a frame grabber similar to the commercial versions. This
option was not pursued, since the main objective of the project is not to build a frame
grabber. Building a complete frame grabber is a thesis project in itself, and since the
parallel port design could not be used for real-time applications, the final option was
purchasing a commercial frame grabber.
1
4](https://image.slidesharecdn.com/5-drowsy-detector-150220102032-conversion-gate02/85/5-drowsy-detector-41-320.jpg)

![Chapter 6
Design
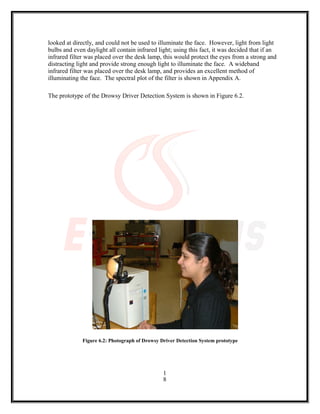
This chapter aims to present my design of the Drowsy Driver Detection System. Each
design decision will be presented and rationalized, and sufficient detail will be given to
allow the reader to examine each element in its entirety.
6.1 Concept Design
As seen in the various references [3],[5],[6],[7],[8],[9], there are several different
algorithms and methods for eye tracking, and monitoring. Most of them in some way
relate to features of the eye (typically reflections from the eye) within a video image of the
driver.
The original aim of this project was to use the retinal reflection (only) as a means to finding
the eyes on the face, and then using the absence of this reflection as a way of detecting
when the eyes are closed. It was then found that this method might not be the best method
of monitoring the eyes fort two reasons. First, in lower lighting conditions, the amount of
retinal reflection decreases; and second, if the person has small eyes the reflection may not
show, as seen below in Figure 6.1.
Figure 6.1: Case where no retinal reflection present.
1](https://image.slidesharecdn.com/5-drowsy-detector-150220102032-conversion-gate02/85/5-drowsy-detector-43-320.jpg)

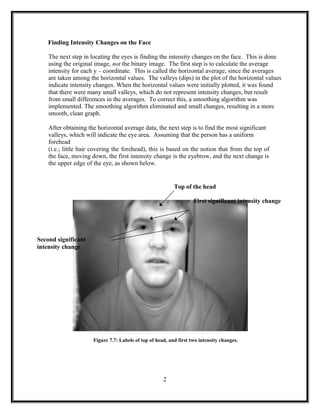
![As the project progressed, the basis of the horizontal intensity changes idea from paper [7]
was used. One similarity among all faces is that eyebrows are significantly different from
the skin in intensity, and that the next significant change in intensity, in the y-direction, is
the eyes. This facial characteristic is the centre of finding the eyes on the face, which will
allow the system to monitor the eyes and detect long periods of eye closure.
Each of the following sections describes the design of the drowsy driver detection system.
6.2 System Configuration
6.2.1 Background and Ambient Light
Because the eye tracking system is based on intensity changes on the face, it is crucial that
the background does not contain any object with strong intensity changes. Highly reflective
object behind the driver, can be picked up by the camera, and be consequently mistaken as
the eyes. Since this design is a prototype, a controlled lighting area was set up for testing.
Low surrounding light (ambient light) is also important, since the only significant light
illuminating the face should come from the drowsy driver system. If there is a lot of
ambient light, the effect of the light source diminishes. The testing area included a black
background, and low ambient light (in this case, the ceiling light was physically high, and
hence had low illumination). This setup is somewhat realistic since inside a vehicle, there is
no direct light, and the background is fairly uniform.
6.2.2 Camera
The drowsy driver detection system consists of a CCD camera that takes images of the
driver’s face. This type of drowsiness detection system is based on the use of image
processing technology that will be able to accommodate individual driver differences. The
camera is placed in front of the driver, approximately 30 cm away from the face. The
camera must be positioned such that the following criteria are met:
1. The driver’s face takes up the majority of the image.
2. The driver’s face is approximately in the centre of the image.
The facial image data is in 480x640 pixel format and is stored as an array through
the predefined Picolo driver functions (as described in a later section).
6.2.3 Light Source
For conditions when ambient light is poor (night time), a light source must be present to
compensate. Initially, the construction of an infrared light source using infrared LED was
going to be implemented. It was later found that at least 50 LEDs would be needed so
create a source that would be able to illuminate the entire face. To cut down cost, a simple
desk light was used. Using the desk light alone could not work, since the bright light is
blinding if
1
7](https://image.slidesharecdn.com/5-drowsy-detector-150220102032-conversion-gate02/85/5-drowsy-detector-45-320.jpg)


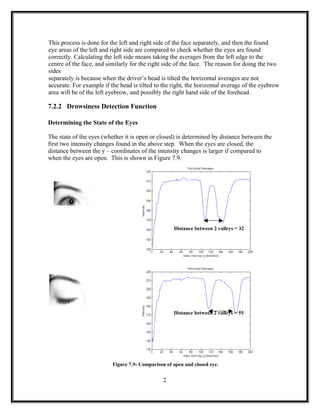

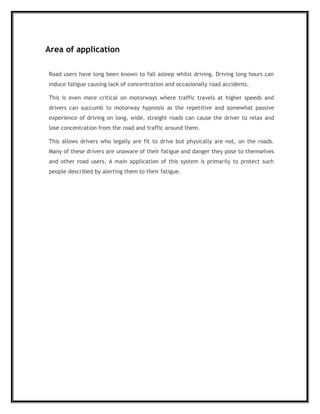
![The limitation to this is if the driver moves their face closer to or further from the camera.
If this occurs, the distances will vary, since the number of pixels the face takes up varies, as
seen below. Because of this limitation, the system developed assumes that the driver’s face
stays almost the same distance from the camera at all times.
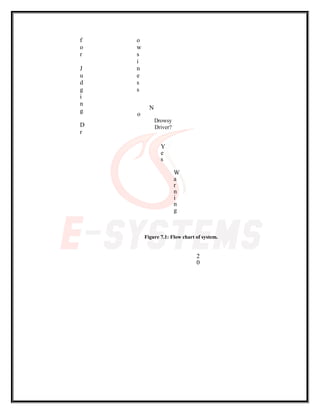
Judging Drowsiness
When there are 5 consecutive frames find the eye closed, then the alarm is activated, and a
driver is alerted to wake up. Consecutive number of closed frames is needed to avoid
including instances of eye closure due to blinking. Criteria for judging the alertness level
on the basis of eye closure count is based on the results found in a previous study [9].
2
9](https://image.slidesharecdn.com/5-drowsy-detector-150220102032-conversion-gate02/85/5-drowsy-detector-67-320.jpg)


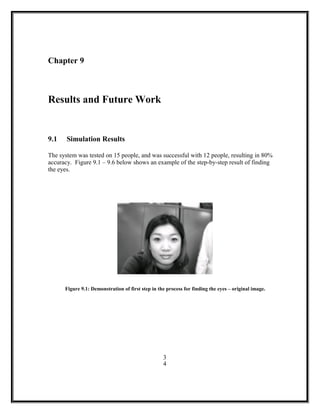


The document describes the design of a Drowsy Driver Detection System. The system uses a camera to monitor the driver's face and eyes in order to detect fatigue. It analyzes the video input to locate the eyes and determine if they are open or closed. If the eyes are closed for 5 consecutive frames, the system concludes the driver is falling asleep and issues a warning signal. The system is designed to work in both day and night conditions using a machine vision based approach with the goal of developing a non-intrusive real-time fatigue monitoring system.