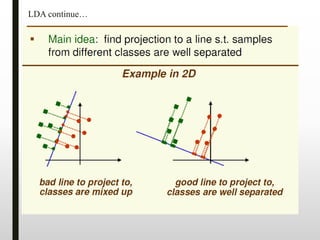
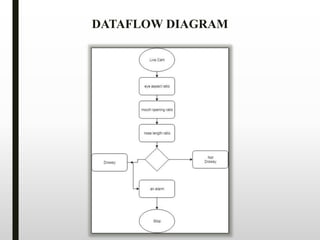
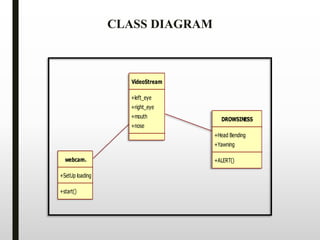
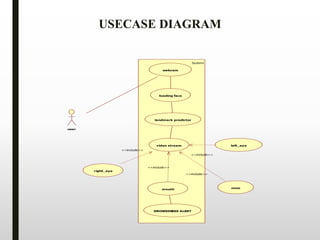
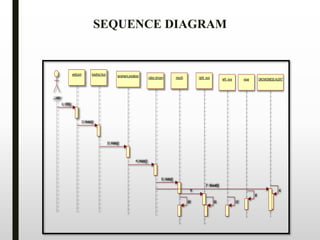
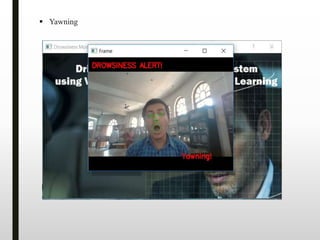
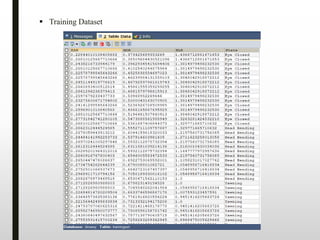
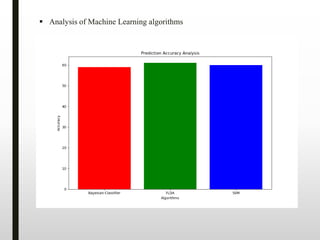
The document discusses the development of a low-cost, real-time driver drowsiness monitoring system utilizing visual behavior and machine learning techniques to enhance road safety. It describes the process of detecting facial landmarks and calculating specific ratios to identify drowsiness, and discusses the limitations of existing systems. The proposed system leverages a webcam for real-time data acquisition and employs machine learning algorithms to classify drowsiness levels accurately.

![Example continue..
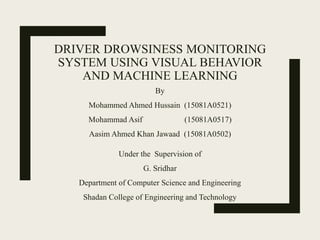
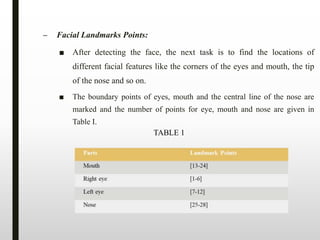
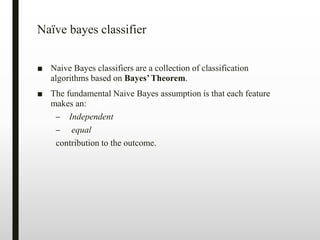
• Test Phase
– Given a new instance,
x’=(Outlook=Sunny, Temperature=Cool, Humidity=High, Wind=Strong)
– Look up tables
– MAP rule
P(Yes|x’): [P(Sunny|Yes)P(Cool|Yes)P(High|Yes)P(Strong|Yes)]P(Play=Yes) =
0.0053
P(No|x’): [P(Sunny|No) P(Cool|No)P(High|No)P(Strong|No)]P(Play=No) =
0.0206
Given the fact P(Yes|x’) < P(No|x’), we label x’ to be “No”.
P(Outlook=Sunny|Play=No) = 3/5
P(Temperature=Cool|Play==No) = 1/5
P(Huminity=High|Play=No) = 4/5
P(Wind=Strong|Play=No) = 3/5
P(Play=No) = 5/14
P(Outlook=Sunny|Play=Yes) = 2/9
P(Temperature=Cool|Play=Yes) = 3/9
P(Huminity=High|Play=Yes) = 3/9
P(Wind=Strong|Play=Yes) = 3/9
P(Play=Yes) = 9/14](https://image.slidesharecdn.com/driverdrowsinessmonitoringsystemusingvisual-190807113132/85/Driver-drowsiness-monitoring-system-using-visual-behavior-and-Machine-Learning-12-320.jpg)
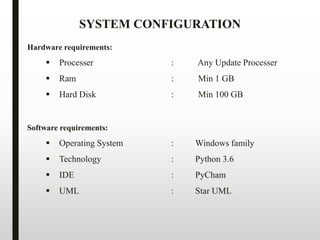
![■ W. L. Ou, M. H. Shih, C. W. Chang, X. H. Yu, C. P. Fan, "Intelligent Video-Based
Drowsy Driver Detection System under Various Illuminations and Embedded
Software Implementation", 2015 international Conf. on Consumer Electronics -
Taiwan, 2015.
■ [2] W. B. Horng, C. Y. Chen, Y. Chang, C. H. Fan, “Driver Fatigue Detection based
on Eye Tracking and Dynamic Template Matching”, IEEE International
Conference on Networking,, Sensing and Control, Taipei, Taiwan, March 21-23,
2004.
■ [3] S. Singh, N. P. papanikolopoulos, “Monitoring Driver Fatigue using Facial
Analysis Techniques”, IEEE Conference on Intelligent Transportation System, pp
314-318.
■ [4] B. Alshaqaqi, A. S. Baquhaizel, M. E. A. Ouis, M. Bouumehed, A. Ouamri, M.
Keche, “Driver Drowsiness Detection System”, IEEE International Workshop on
Systems, Signal Processing and their Applications, 2013.
■ [5] M. Karchani, A. Mazloumi, G. N. Saraji, A. Nahvi, K. S. Haghighi, B. M.
Abadi, A. R. Foroshani, A. Niknezhad, “The Steps of Proposed Drowsiness
Detection System Design based on Image Processing in Simulator Driving”,
International Research Journal of Applied and Basic Sciences, vol. 9(6), pp 878-
887, 2015.
REFERENCES](https://image.slidesharecdn.com/driverdrowsinessmonitoringsystemusingvisual-190807113132/85/Driver-drowsiness-monitoring-system-using-visual-behavior-and-Machine-Learning-38-320.jpg)
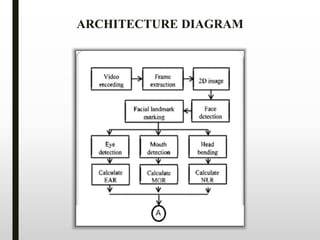
![■ [6] R. Ahmad, and J. N. Borole, “Drowsy Driver Identification Using Eye Blink
Detection,” IJISET – International Journal of Computer Science and Information
Technologies, vol. 6, no. 1, pp. 270-274, Jan. 2015.
■ [7] A. Abas, J. Mellor, and X. Chen, “Non-intrusive drowsiness detection by employing
Support Vector Machine,” 2014 20th International Conference on Automation and
Computing (ICAC), Bedfordshire, UK, 2014, pp. 188- 193.
■ [8] A. Sengupta, A. Dasgupta, A. Chaudhuri, A. George, A. Routray, R. Guha; "A
Multimodal System for Assessing Alertness Levels Due to Cognitive Loading", IEEE
Trans. on Neural Systems and Rehabilitation Engg., vol. 25 (7), pp 1037-1046, 2017.
■ [9] K. T. Chui, K. F. Tsang, H. R. Chi, B. W. K. Ling, and C. K. Wu, “An accurate ECG
based transportation safety drowsiness detection scheme,” 343 IEEE Transactions on
Industrial Informatics, vol. 12, no. 4, pp. 1438- 1452, Aug. 2016.
■ [10] N. Dalal and B. Triggs, “Histograms of Oriented Gradients for Human Detection”,
IEEE conf. on CVPR, 2005.
■ [11] V. Kazemi and J. Sullivan; "One millisecond face alignment with an ensemble of
regression trees", IEEE Conf. on Computer Vision and Pattern Recognition, 23-28 June,
2014, Columbus, OH, USA.
■ [12] Richard O. Duda, Peter E. Hart, David G. Stork, “Pattern Classification”, Wiley
student edition.
■ [13] Dataset: https://sites.google.com/site/invedrifac/](https://image.slidesharecdn.com/driverdrowsinessmonitoringsystemusingvisual-190807113132/85/Driver-drowsiness-monitoring-system-using-visual-behavior-and-Machine-Learning-39-320.jpg)


![OpenGL Mini Projects With Source Code [ Computer Graphics ]](https://cdn.slidesharecdn.com/ss_thumbnails/newmicrosoftpowerpointpresentation-180330204024-thumbnail.jpg?width=640&height=640&fit=bounds)