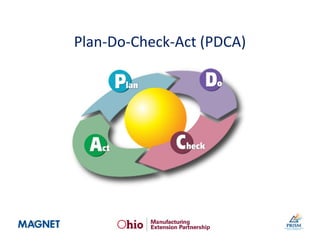
Lean Logistics & Warehousing
Lean your Warehouse & Fulfillment
Operations
House of Lean
Lean Manufacturing
• Focus:
– Waste - Non Value Added Activities
– Speed & Cycle Time
– Standardization
– Inventory Performance
– Logistics Cost Reduction
– Variance Reduction
Lean Manufacturing
(Continued)
• Tools:
– “One Piece Flow”
– Visual Controls
– “Pull” Systems - Versus “Push”
– Takt Time
– Supermarkets
– Value Stream Mapping
– Kanban
– Spaghetti Diagrams
Which activities add only cost and
which add value?
Source: Adapted from Martin Christopher (2002)
VALUE-
ADDED
(Form,
Place,
& Time
Utility)
COST-ADDED
(Production, Storage & Transport costs and the Time Cost of Money)
Store
Store
Store
What is Lean?
• A set of tools to reduce waste.
• A philosophy based on lead-time reduction from
customer order to delivery.
• A method based on customer demand (pull) and one-
piece flow.
• A state of mind.
• An operational model that ignores economies-of-scale.
• An organizational methodology designed to create a
learning organization.
• An operational model based on continuous
improvement.
What is Lean Thinking?
Principles of Lean Fulfillment Streams
Eliminate All Waste
• All partners need to be in-sync.• All partners need to be in-sync.
Make Customer Consumption
Visible
• As lead time is full of waste.• As lead time is full of waste.Reduce lead time
Create level flow
• Ship to the cadence (pulse) of customer
demand.
• Ship to the cadence (pulse) of customer
demand.
Use pull systems
• Create a problem-solving culture (the
“Learning Organization”).
• Create a problem-solving culture (the
“Learning Organization”).
Increase velocity and reduce
variation • Move smaller lots more frequently.• Move smaller lots more frequently.
Collaborate and use process
discipline
• Achieve optimal results!• Achieve optimal results!Focus on Total Cost of Fulfillment
• Eliminating waste reduces cost and ensures
value.
• Let customer pull drive consistent & smooth
flow.
What happens when we forget about
the system?
8
Waste
Being lean and reducing cost is
about reducing waste:
Muda – Waste, or any activity for which
the customer is not willing to pay. If
you stopped doing this, there would
be no adverse effect on the product.
Mura – Unevenness or fluctuation in
work, usually caused by fluctuating
production plans. Reduced through
heijunka.
Muri – The “hard to do”. Caused by
variation in production, poor job
design/ergonomics, poor part fit,
inadequate tools, unclear
specifications, etc.
The Eight Deadly Wastes
• Defects
• Overproduction
• Waiting
• Non-utilization of talent
• Transportation
• Inventory
• Motion
• Excess Processing
The Eight Deadly Wastes
Symptoms
– Inventory Accuracy
– Fill Rate
– Receiving Overages/ Shortages
– PO/ Invoice reconciliation
Root Causes
– Processes
– Training
– Visual
Defects
– Picking Schedule
• How far ahead are you picking orders?
– 1 day
– 2 days
– 1 week
Overproduction
– Receiving/ Shipping Schedules
– Order Processing
Waiting
– Hourly Staff
– Mobile Equipment
– Storage Equipment
– Warehouse Management System
Non-Utilization of Talent
Plan for Every Part (PFEP)
• A detailed plan for every part in the process, showing
everything relevant to managing those parts with no waste
(muda).
• A similar concept, Plan for Every Person, also exists.
16
Plan for Every Person(PFEP)
17
– Transportation is a necessary activity but it doesn't add value.
(Non-Value Added but Necessary)
– Spaghetti Diagrams
• Visual display of ACTUAL transportation paths
• Identify Travel Distances for Processes
• Identify Process Breakdowns and Defects
– Velocity Diagrams
• Visual display of the FREQUENCY of transportation paths
• Identify bottlenecks based on opportunity and impact
• Identify Process Breakdowns and Defects
Transportation
– Spaghetti Diagram Example:
Transportation
• Issues with pick
– Part was not in proper location
– When part was found not
enough in location to fill order,
needed to go to second location
– Second location also did not
have enough parts to fill order
– Third location did not have part
– Needed to search for part.
• Did pick 2 other parts while
searching
– Part was found on other side of
aisle of location 2, mixed with
other boxes of another part
number
– Total travel 1,590 ft
S2S3
S4
QQQQQQQQQQQQQQQRQQQQQQQQ
NNNNNNNNNNNNNNNRNNNNNNNN
Q6
Q6
Q6
Q6
Q6
Q6
Q6
Q6
Q6
Q6
Q6
Q6
Q6
Q6
Q6
Q6
Q6
Q6
R
R
Q6
Q6
Q6
Q6
Q6
Q6
Q6
Q6
Q6
Q6
N6
N6
N6
N6
N6
N6
N6
N6
N6
N6
N6
N6
N6
N6
N6
N6
N6
N6
N6
N6
R
R
N6
N6
N6
N6
N6
N6
N6
N6
N6
N6
N2
N2
N2
N2
N2
N2
N2
N2
N2
N2
N2
N2
N2
N2
N2
N2
N2
N2
R
R
N2
N2
N2
N2
N2
N2
N2
N2
N2
N2
P2
P2
P2
P2
P2
P2
P2
P2
P2
P2
P2
P2
P2
P2
P2
P2
P2
P2
P2
P2
R
R
P2
P2
P2
P2
P2
P2
P2
P2
P2
P2
S2
S2
S2
S2
S2
S2
S2
S2
S2
S2
S2
S2
S2
S2
S2
S2
S2
S2
S2
S2
R
R
S2
S2
S2
S2
S2
S2
S2
S2
S2
S2
L2
L2
L2
L2
L2
L2
L2
L2
L2
L2
L2
L2
L2
L2
L2
L2
L2
L2
L2
L2
R
R
L2
L2
L2
L2
L2
L2
L2
L2
L2
L2
LLLLLLLLLLLLLLLRLLLLLLL
HS HS HS
HL HL HL HL HL HL HL
HSHS HS
HS
HL
HS
N N N NNN
PPPPPPPPPPPPPPPRPPPPPPPP
SSSSSSSSSSSSSSSRSSSSSSSS
NNNNNNNNNNNNNNNRNNNNNNNN
PPPPPPPPPPPPPPPRPPPPPPPP
NNNNNNNNNNNNNNNRNNNNNNNN
Q
HS
QQQQQQQQQQQQQQQQQQQQQQQ
Q6
Q6
SSSSSSSSSSSSSSSRSSSSSSSS
NNNNNNNNNNNNNNNRNNNNNNNN
MMMMMMMMMMMMMMMRMMMMMMMM
SSSSSSSSSSSSSSSRSSSSSSSS
N2
N2
SSSSSSSSSSSSSSSRSSSSSSS
LLLLLLLLLLLLLLLRLLLLLLL
Transportation
Current Aisle Travel 32,655
Proposed Aisle Travel 13,985
Unique Aisle Travel Reduction 18,670
% Aisle Travel Reduction 57%
Total Aisle Travel Roundtrip
Distance 200 Feet (Aisle
Length 200 feet) 3,734,000
Total Minutes Traveled at 250 FPM
Equipment Speed 14,936
Total Hours of additional travel 249
Average Total Monthly Hours 1,800
Savings 14%
Transportation
Lost Sales
Obsolescence Complaints Lead Time
Conveyance
Motion Rework
Lack of Training Waiting
Overproduction
Poor Process
Inventory=WaterLevel
River of Waste: Exposing the Rocks
Source: Martichenko & VonGrabe (2010), BLFS, Lean Institute.
Inventory
Cross-Docking
• For cross-docking to work:
– Great discipline and standardized work is required.
– The entire fulfillment stream needs to be visible to all
parties.
– Ongoing PDCA is needed.
Supermarket
• Location where predetermined standard inventory is kept
to supply downstream processes.
• Located near supplying process.
• Help us to see usage and demand.
• We withdraw from supermarkets based on signals from
pull systems, like Kanban.
23
– Different than Transportation
– Movement that does not ADD value
Motion
Excess Processing
Non-Value-Added
Any activity that does not add market form,
fit or function or is not necessary.
(These activities should be eliminated,
simplified, reduced, or integrated.)
“Would a customer pay for this?”
Session Exercise #1
Identify your Wastes
26
The Tools
27
Standardized Work
Batch Reduction/
Wave Picking
Teams
Quality at Source
5S System
Visual Tools and
Display Boards
Layout
Point of
Use Storage
Flow / KanbanTPM
Continuous Improvement
Lean Building Blocks
Process
Redesign
Mapping
Metrics
– Proactive v. reactive approach
– Develop or sustain a competitive advantage
• Reduce the order fulfillment cycle from 180 to less than 28
days
• Reduce engineering time from 18 to 9 weeks
• Do the same amount of work in 1/3 to 1/2 the time without
increasing head count
– “Band-aids” applied to business processes with
changing business conditions
Why Process Redesign?
– In order to improve we must understand and
document the present through:
• Current Documentation
• Gemba (“at the site”)
…..and
– Evaluate if an improved process is possible
• Kaizen events
– Standardization
– Goals
– Ideas
Process Redesign Mapping
– The physical location of components supporting a
process is critical to:
• Providing continuous flow
• Reducing non-value added time/ process (Travel Time)
Layout
– Develop simple visual references for workers
• Quality
• Material
• Layout position
• Speed/ Quality
– Examples
Visual Tools and Display Boards
– Sort
– Set in Order
– Shine
– Standardize
– Sustain
5S
– Storage Strategy
– Slotting
– Set in Order
– Standardize
– Sustain
Develop A Strategy
Case Study – Warehouse
2,150 Surgery SKUs
36 Pick Aisles
2 Floors
Case Study – Warehouse
2,150 Surgery SKUs
10 Pick Aisles
Ground Floor
– Example
• Strategy 1 – Pick all orders at once
– Considerations
» Manufacturing Schedule
» Outbound Logistics (UPS, Fed Ex, LTL, TL)
» Manpower
» Productivity
» Staging
• Strategy 2 – Smaller releases of orders to the floor
– Considerations
» “Right Size” workload
» Timing
» Scheduling
Batch Reduction/ Wave Picking
– Documented Standard Operating Procedures
All done right………..
– Training, Training, Training
– Continuous Improvement
– Communication
Standardized Work
– What if inventory ONLY existed at the place where it
was needed?
• Receiving Staging
• Putaway
• Inventory Storage
• Replenishment
Point of Use Storage (POUS)
– Sustain and Control
– You can’t improve what you don’t measure
– What are the “right” Metrics
• Industry benchmarks
• Customer feedback (Voice of Customer)
Quality, Financial, Performance, Inventory
Metrics
– Develop controls to eliminate defects at every step in
the process
– Visual
– Audits
» Inbound
» Self
» Random
• Identify and resolve root causes
– Example
• Shipping audit
Quality at Source
The Seven Tools of Quality
• Check sheets
• Control charts
• Flowcharts
• Histograms
• Ishikawa diagrams
• Pareto charts
• Scatter diagrams
Check Sheets
• A document used at the Gemba, to collect data in real
time.
• Data can be quantitative or qualitative.
• Often characterized by the inclusion of check marks or
tallies.
Pareto Charts
• Graphical representation of the frequency of defects in our system.
• Rank defects from highest to lowest.
• Support the 80/20 rule and identify our greatest opportunities.
FMEA & PFMEA
• List out defects (“failures”) in the process.
• Score them in terms of:
– Severity if they occur.
– Probability that they will occur.
– The likelihood that we would detect them if they
occur.
• Recommend a solution.
• Assign responsibility and due dates.
• Attack them from most urgent and important, to
least.
FMEA &PFMEA
– Visual system supporting
• POUS
• JIT
• Speed (Faster)
Flow/ Kanban
Keys to Successful Kanban
• Customer processes ordered goods in the precise amounts.
• Supplier processes produced goods in the precise amounts.
• No items are made or moved without a Kanban.
• All parts and materials always have a Kanban attached.
• Defective parts and incorrect amounts are NEVER sent to the
next process.
• The number of Kanban is reduced carefully to lower
inventories and reveal problems.
48
Plan-Do-Check-Act (PDCA)
49
Things To Consider in PDCA
• Do you have the right tools (systems, people,
identified metrics) to identify waste and track
activities?
• Is work standardized and easy to track and
improve?
• How frequently should you cycle through
PDCA?
• Is the organization committed to change and
follow-through?
50
– Mobile Equipment
– Conveyors
– Scanning Equipment
– Warehouse Management Systems
Total Productive Maintenance (TPM)
Session Exercise #2
What Building Blocks/ Tools
will you use?
52
Implementation
53
Hold Kaizen Workshop
• Kaizen – “Improvement” or “change for the
better”.
• Kaizen Workshop – Multi-day team Kaizen event;
typically includes:
– Current state analysis
– Value stream mapping
– Cost analysis
– Future-state brainstorming
– Action plan development
– Focuses on making the
system better
54
Go To The Gemba!
• View as much of the process as possible.
• Talk to the people doing the job.
• Take photos & video, gather documentation.
• You are focusing on people, process, materials and
information.
• Don’t panic if you can’t gather everything.
55
Collaborate to Eliminate Waste
• Everyone has visibility to customer demand, and everyone
should have visibility to waste in the system that prevents us
from meeting that demand.
• Since everyone in the fulfillment stream is charged with
reducing the total cost of fulfillment, everyone owns
eliminating waste.
Gather Relevant Data
• Data needs to be gathered in a timely fashion, to
allow us to react.
• Performance is measured in terms of hours or days,
not weeks or months.
• It’s very difficult to work with all of our data in this
manner; we need to apply the Pareto principle.
• It can also be very difficult to gather the data we
need.
Data Collection Example
FLOW
• Trailer inbound (per day & shift)
• Trailers outbound (per day & shift)
RESOURCES
• People involved in shipping & receiving
• Physical resources involved in shipping & receiving
EFFORT
• Daily wait time for trailers in the yard.
• Unit of work or time to load & unload trailer.
Outbound Logistics
1. Collect outbound logistics network data.
2. Map the current outbound logistics network.
3. Develop an inventory strategy based on flow to
the customer.
4. Develop a packaging strategy based on flow to
the customer.
5. Create a daily logistics design and PDCA.
Inventory strategy drives transportation strategy.
Why?
59
Measure Current Operational Metrics
• Minimum Order Quantity (MOQ) – Smallest amount
that can be ordered, either from suppliers or by
customers.
• Lot Size – Packaging size increment of orders. Should
equal MOQ, with efforts to continuously shrink lot size.
• Cadence – Quantity & frequency with which materials
move through fulfillment stream. Should match…
• Takt Time – The precise customer demand rate,
measured by dividing available production time by
customer demand. The goal is to sync production with
customer demand, the heartbeat of Lean.
60
Benchmarking And Metrics
Determine Current Performance
• We strive for “perfect order execution” (POE, also known as “first time
quality” (FTQ)).
• The eight “rights” of logistics are used to assess:
Tactical (To The Next Step)
– Right quantity
– Right product
– Right place
– Right time
– Right quality (product and information)
Strategic
– Right source – Did the materials come from the right supplier?
– Right price – Was the planned price/cost paid?
– Right service – Did the customer receive the expected service?
63
1. Pick A Product
• Focus on a common, high-volume product, and its
components, to study.
• Enlist the partnership of the suppliers involved.
• Remember, not all products and customers are
created equal!
64
Coefficient of Variation
• Measurement of stability of demand
• Calculated by dividing standard deviation by the
mean (average) for demand:
COV = STDDEV / MEAN
COV < 0.2 Stable SKU & Candidate for LFS
COV > 0.2 AND Trending To Stable or Unstable
COV < 1.0
COV > 1.0 Unstable SKU & Candidate for
Rationalization or Make-To-Order
65
Stability and Process Fit
66
2. Measure Current Lead Time
• Calculate Current Lead Time
– Inbound (Supplier) Lead Time +
– Manufacturing Lead Time +
– Outbound (Customer) Lead Time* +
– Raw Material Inventory (ADOH)** +
– Finished Goods Inventory (ADOH)**
* Tells us how long it’s taking us to respond to
customer demand
** How long could we sustain activity before
replenishing?
67
3. Calculate the Current Total Cost of
Fulfillment
• Identify the key areas in your fulfillment stream,
and what they’re costing you to operate.
– Supplier collaboration (portals, EDI)
– Supplier parts and material ordering (parts ordering and planning)
– Inbound logistics (transportation; internal and external)
– Shipping, receiving & trailer-yard management (material-handling and yard
equipment)
– Outbound logistics (transportation & distribution; internal and external)
– Customer collaboration (customer service & demand planning)
• Add the cost of carrying inventory
• Make this cost known to all partners; reducing it
as a % of sales will be everyone’s goal!
68
4. Determine Cost of Inventory
• Excess inventory is waste! It ties up cash and
hides process problems.
• Knowing your costs is key to eliminating them.
• Typical carrying costs include:
– The cost of capital (borrowing money)
– Damages
– Insurance
– Obsolescence, donations, write-downs and write-offs
– Shrinkage
69
Your Future State
• Lean improvements occur over time, and build
on one another.
• Improvements must be pursued
simultaneously.
• The focus is on reducing cost.
• Lean is NOT about eliminating jobs.
• Lean IS about eliminating waste.
70
PDCA The Process
• Critical in avoiding the waste of inventory build-ups.
• Changes along the fulfillment stream can quickly
impact the ordering process.
• These PDCA events evaluate components like:
– Do we have new parts we need to plan for?
– Have we addressed gathering any data we’re missing on
existing parts?
– Have lot sizes & MOQs been optimized?
– Have we removed all unnecessary parts from inventory
(5S)?
– Are we using the appropriate method to order each part?
– How can we continue to improve the process?
Change Acceptance
• Why is it so hard to get people to buy into
change?
72
Resistance to Change
• Fear
• Comfort
• No Perceived Need (If It Ain’t Broke, Don’t Fix It!)
• No Faith In Process
• Lack of Knowledge
• Lack of Trust
• Perceived Lack of Choice
• Their Own Personality
73
Session Exercise #3
When will you start?
74
Next Steps for Lean Logistics and
Warehousing
• Questions?
• If interested in a complimentary 2 hour Warehouse
Diagnostic, let MAGNET know as you exit at the
session, and we’ll follow-up to
– Qualify your problem and schedule your session
• Thank you for Attending

Lean logistics and warehousing final

  • 1.
    Lean Logistics &Warehousing Lean your Warehouse & Fulfillment Operations
  • 2.
  • 3.
    Lean Manufacturing • Focus: –Waste - Non Value Added Activities – Speed & Cycle Time – Standardization – Inventory Performance – Logistics Cost Reduction – Variance Reduction
  • 4.
    Lean Manufacturing (Continued) • Tools: –“One Piece Flow” – Visual Controls – “Pull” Systems - Versus “Push” – Takt Time – Supermarkets – Value Stream Mapping – Kanban – Spaghetti Diagrams
  • 5.
    Which activities addonly cost and which add value? Source: Adapted from Martin Christopher (2002) VALUE- ADDED (Form, Place, & Time Utility) COST-ADDED (Production, Storage & Transport costs and the Time Cost of Money) Store Store Store
  • 6.
    What is Lean? •A set of tools to reduce waste. • A philosophy based on lead-time reduction from customer order to delivery. • A method based on customer demand (pull) and one- piece flow. • A state of mind. • An operational model that ignores economies-of-scale. • An organizational methodology designed to create a learning organization. • An operational model based on continuous improvement. What is Lean Thinking?
  • 7.
    Principles of LeanFulfillment Streams Eliminate All Waste • All partners need to be in-sync.• All partners need to be in-sync. Make Customer Consumption Visible • As lead time is full of waste.• As lead time is full of waste.Reduce lead time Create level flow • Ship to the cadence (pulse) of customer demand. • Ship to the cadence (pulse) of customer demand. Use pull systems • Create a problem-solving culture (the “Learning Organization”). • Create a problem-solving culture (the “Learning Organization”). Increase velocity and reduce variation • Move smaller lots more frequently.• Move smaller lots more frequently. Collaborate and use process discipline • Achieve optimal results!• Achieve optimal results!Focus on Total Cost of Fulfillment • Eliminating waste reduces cost and ensures value. • Let customer pull drive consistent & smooth flow.
  • 8.
    What happens whenwe forget about the system? 8
  • 9.
    Waste Being lean andreducing cost is about reducing waste: Muda – Waste, or any activity for which the customer is not willing to pay. If you stopped doing this, there would be no adverse effect on the product. Mura – Unevenness or fluctuation in work, usually caused by fluctuating production plans. Reduced through heijunka. Muri – The “hard to do”. Caused by variation in production, poor job design/ergonomics, poor part fit, inadequate tools, unclear specifications, etc.
  • 10.
  • 11.
    • Defects • Overproduction •Waiting • Non-utilization of talent • Transportation • Inventory • Motion • Excess Processing The Eight Deadly Wastes
  • 12.
    Symptoms – Inventory Accuracy –Fill Rate – Receiving Overages/ Shortages – PO/ Invoice reconciliation Root Causes – Processes – Training – Visual Defects
  • 13.
    – Picking Schedule •How far ahead are you picking orders? – 1 day – 2 days – 1 week Overproduction
  • 14.
    – Receiving/ ShippingSchedules – Order Processing Waiting
  • 15.
    – Hourly Staff –Mobile Equipment – Storage Equipment – Warehouse Management System Non-Utilization of Talent
  • 16.
    Plan for EveryPart (PFEP) • A detailed plan for every part in the process, showing everything relevant to managing those parts with no waste (muda). • A similar concept, Plan for Every Person, also exists. 16
  • 17.
    Plan for EveryPerson(PFEP) 17
  • 18.
    – Transportation isa necessary activity but it doesn't add value. (Non-Value Added but Necessary) – Spaghetti Diagrams • Visual display of ACTUAL transportation paths • Identify Travel Distances for Processes • Identify Process Breakdowns and Defects – Velocity Diagrams • Visual display of the FREQUENCY of transportation paths • Identify bottlenecks based on opportunity and impact • Identify Process Breakdowns and Defects Transportation
  • 19.
    – Spaghetti DiagramExample: Transportation • Issues with pick – Part was not in proper location – When part was found not enough in location to fill order, needed to go to second location – Second location also did not have enough parts to fill order – Third location did not have part – Needed to search for part. • Did pick 2 other parts while searching – Part was found on other side of aisle of location 2, mixed with other boxes of another part number – Total travel 1,590 ft
  • 20.
    S2S3 S4 QQQQQQQQQQQQQQQRQQQQQQQQ QQQQQQQQQQQQQQQRQQQQQQQQ NNNNNNNNNNNNNNNRNNNNNNNN NNNNNNNNNNNNNNNRNNNNNNNN NNNNNNNNNNNNNNNRNNNNNNNN NNNNNNNNNNNNNNNRNNNNNNNN Q6 Q6 Q6 Q6 Q6 Q6 Q6 Q6 Q6 Q6 Q6 Q6 Q6 Q6 Q6 Q6 Q6 Q6 R R Q6 Q6 Q6 Q6 Q6 Q6 Q6 Q6 Q6 Q6 N6 N6 N6 N6 N6 N6 N6 N6 N6 N6 N6 N6 N6 N6 N6 N6 N6 N6 N6 N6 R R N6 N6 N6 N6 N6 N6 N6 N6 N6 N6 N2 N2 N2 N2 N2 N2 N2 N2 N2 N2 N2 N2 N2 N2 N2 N2 N2 N2 R R N2 N2 N2 N2 N2 N2 N2 N2 N2 N2 P2 P2 P2 P2 P2 P2 P2 P2 P2 P2 P2 P2 P2 P2 P2 P2 P2 P2 P2 P2 R R P2 P2 P2 P2 P2 P2 P2 P2 P2 P2 S2 S2 S2 S2 S2 S2 S2 S2 S2 S2 S2 S2 S2 S2 S2 S2 S2 S2 S2 S2 R R S2 S2 S2 S2 S2 S2 S2 S2 S2 S2 L2 L2 L2 L2 L2 L2 L2 L2 L2 L2 L2 L2 L2 L2 L2 L2 L2 L2 L2 L2 R R L2 L2 L2 L2 L2 L2 L2 L2 L2 L2 LLLLLLLLLLLLLLLRLLLLLLL LLLLLLLLLLLLLLLRLLLLLLL LLLLLLLLLLLLLLLRLLLLLLL LLLLLLLLLLLLLLLRLLLLLLL LLLLLLLLLLLLLLLRLLLLLLL LLLLLLLLLLLLLLLRLLLLLLL HS HS HS HLHL HL HL HL HL HL HSHS HS HS HL HS N N N NNN PPPPPPPPPPPPPPPRPPPPPPPP PPPPPPPPPPPPPPPRPPPPPPPP PPPPPPPPPPPPPPPRPPPPPPPP PPPPPPPPPPPPPPPRPPPPPPPP PPPPPPPPPPPPPPPRPPPPPPPP PPPPPPPPPPPPPPPRPPPPPPPP SSSSSSSSSSSSSSSRSSSSSSSS SSSSSSSSSSSSSSSRSSSSSSSS NNNNNNNNNNNNNNNRNNNNNNNN PPPPPPPPPPPPPPPRPPPPPPPP NNNNNNNNNNNNNNNRNNNNNNNN NNNNNNNNNNNNNNNRNNNNNNNN Q HS QQQQQQQQQQQQQQQQQQQQQQQ Q6 Q6 SSSSSSSSSSSSSSSRSSSSSSSS SSSSSSSSSSSSSSSRSSSSSSSS SSSSSSSSSSSSSSSRSSSSSSSS NNNNNNNNNNNNNNNRNNNNNNNN NNNNNNNNNNNNNNNRNNNNNNNN MMMMMMMMMMMMMMMRMMMMMMMM MMMMMMMMMMMMMMMRMMMMMMMM SSSSSSSSSSSSSSSRSSSSSSSS N2 N2 SSSSSSSSSSSSSSSRSSSSSSS SSSSSSSSSSSSSSSRSSSSSSS SSSSSSSSSSSSSSSRSSSSSSS LLLLLLLLLLLLLLLRLLLLLLL Transportation Current Aisle Travel 32,655 Proposed Aisle Travel 13,985 Unique Aisle Travel Reduction 18,670 % Aisle Travel Reduction 57% Total Aisle Travel Roundtrip Distance 200 Feet (Aisle Length 200 feet) 3,734,000 Total Minutes Traveled at 250 FPM Equipment Speed 14,936 Total Hours of additional travel 249 Average Total Monthly Hours 1,800 Savings 14%
  • 21.
    Transportation Lost Sales Obsolescence ComplaintsLead Time Conveyance Motion Rework Lack of Training Waiting Overproduction Poor Process Inventory=WaterLevel River of Waste: Exposing the Rocks Source: Martichenko & VonGrabe (2010), BLFS, Lean Institute. Inventory
  • 22.
    Cross-Docking • For cross-dockingto work: – Great discipline and standardized work is required. – The entire fulfillment stream needs to be visible to all parties. – Ongoing PDCA is needed.
  • 23.
    Supermarket • Location wherepredetermined standard inventory is kept to supply downstream processes. • Located near supplying process. • Help us to see usage and demand. • We withdraw from supermarkets based on signals from pull systems, like Kanban. 23
  • 24.
    – Different thanTransportation – Movement that does not ADD value Motion
  • 25.
    Excess Processing Non-Value-Added Any activitythat does not add market form, fit or function or is not necessary. (These activities should be eliminated, simplified, reduced, or integrated.) “Would a customer pay for this?”
  • 26.
  • 27.
  • 28.
    Standardized Work Batch Reduction/ WavePicking Teams Quality at Source 5S System Visual Tools and Display Boards Layout Point of Use Storage Flow / KanbanTPM Continuous Improvement Lean Building Blocks Process Redesign Mapping Metrics
  • 29.
    – Proactive v.reactive approach – Develop or sustain a competitive advantage • Reduce the order fulfillment cycle from 180 to less than 28 days • Reduce engineering time from 18 to 9 weeks • Do the same amount of work in 1/3 to 1/2 the time without increasing head count – “Band-aids” applied to business processes with changing business conditions Why Process Redesign?
  • 30.
    – In orderto improve we must understand and document the present through: • Current Documentation • Gemba (“at the site”) …..and – Evaluate if an improved process is possible • Kaizen events – Standardization – Goals – Ideas Process Redesign Mapping
  • 31.
    – The physicallocation of components supporting a process is critical to: • Providing continuous flow • Reducing non-value added time/ process (Travel Time) Layout
  • 32.
    – Develop simplevisual references for workers • Quality • Material • Layout position • Speed/ Quality – Examples Visual Tools and Display Boards
  • 33.
    – Sort – Setin Order – Shine – Standardize – Sustain 5S – Storage Strategy – Slotting – Set in Order – Standardize – Sustain
  • 34.
  • 35.
    Case Study –Warehouse 2,150 Surgery SKUs 36 Pick Aisles 2 Floors
  • 36.
    Case Study –Warehouse 2,150 Surgery SKUs 10 Pick Aisles Ground Floor
  • 37.
    – Example • Strategy1 – Pick all orders at once – Considerations » Manufacturing Schedule » Outbound Logistics (UPS, Fed Ex, LTL, TL) » Manpower » Productivity » Staging • Strategy 2 – Smaller releases of orders to the floor – Considerations » “Right Size” workload » Timing » Scheduling Batch Reduction/ Wave Picking
  • 38.
    – Documented StandardOperating Procedures All done right……….. – Training, Training, Training – Continuous Improvement – Communication Standardized Work
  • 39.
    – What ifinventory ONLY existed at the place where it was needed? • Receiving Staging • Putaway • Inventory Storage • Replenishment Point of Use Storage (POUS)
  • 40.
    – Sustain andControl – You can’t improve what you don’t measure – What are the “right” Metrics • Industry benchmarks • Customer feedback (Voice of Customer) Quality, Financial, Performance, Inventory Metrics
  • 41.
    – Develop controlsto eliminate defects at every step in the process – Visual – Audits » Inbound » Self » Random • Identify and resolve root causes – Example • Shipping audit Quality at Source
  • 42.
    The Seven Toolsof Quality • Check sheets • Control charts • Flowcharts • Histograms • Ishikawa diagrams • Pareto charts • Scatter diagrams
  • 43.
    Check Sheets • Adocument used at the Gemba, to collect data in real time. • Data can be quantitative or qualitative. • Often characterized by the inclusion of check marks or tallies.
  • 44.
    Pareto Charts • Graphicalrepresentation of the frequency of defects in our system. • Rank defects from highest to lowest. • Support the 80/20 rule and identify our greatest opportunities.
  • 45.
    FMEA & PFMEA •List out defects (“failures”) in the process. • Score them in terms of: – Severity if they occur. – Probability that they will occur. – The likelihood that we would detect them if they occur. • Recommend a solution. • Assign responsibility and due dates. • Attack them from most urgent and important, to least.
  • 46.
  • 47.
    – Visual systemsupporting • POUS • JIT • Speed (Faster) Flow/ Kanban
  • 48.
    Keys to SuccessfulKanban • Customer processes ordered goods in the precise amounts. • Supplier processes produced goods in the precise amounts. • No items are made or moved without a Kanban. • All parts and materials always have a Kanban attached. • Defective parts and incorrect amounts are NEVER sent to the next process. • The number of Kanban is reduced carefully to lower inventories and reveal problems. 48
  • 49.
  • 50.
    Things To Considerin PDCA • Do you have the right tools (systems, people, identified metrics) to identify waste and track activities? • Is work standardized and easy to track and improve? • How frequently should you cycle through PDCA? • Is the organization committed to change and follow-through? 50
  • 51.
    – Mobile Equipment –Conveyors – Scanning Equipment – Warehouse Management Systems Total Productive Maintenance (TPM)
  • 52.
    Session Exercise #2 WhatBuilding Blocks/ Tools will you use? 52
  • 53.
  • 54.
    Hold Kaizen Workshop •Kaizen – “Improvement” or “change for the better”. • Kaizen Workshop – Multi-day team Kaizen event; typically includes: – Current state analysis – Value stream mapping – Cost analysis – Future-state brainstorming – Action plan development – Focuses on making the system better 54
  • 55.
    Go To TheGemba! • View as much of the process as possible. • Talk to the people doing the job. • Take photos & video, gather documentation. • You are focusing on people, process, materials and information. • Don’t panic if you can’t gather everything. 55
  • 56.
    Collaborate to EliminateWaste • Everyone has visibility to customer demand, and everyone should have visibility to waste in the system that prevents us from meeting that demand. • Since everyone in the fulfillment stream is charged with reducing the total cost of fulfillment, everyone owns eliminating waste.
  • 57.
    Gather Relevant Data •Data needs to be gathered in a timely fashion, to allow us to react. • Performance is measured in terms of hours or days, not weeks or months. • It’s very difficult to work with all of our data in this manner; we need to apply the Pareto principle. • It can also be very difficult to gather the data we need.
  • 58.
    Data Collection Example FLOW •Trailer inbound (per day & shift) • Trailers outbound (per day & shift) RESOURCES • People involved in shipping & receiving • Physical resources involved in shipping & receiving EFFORT • Daily wait time for trailers in the yard. • Unit of work or time to load & unload trailer.
  • 59.
    Outbound Logistics 1. Collectoutbound logistics network data. 2. Map the current outbound logistics network. 3. Develop an inventory strategy based on flow to the customer. 4. Develop a packaging strategy based on flow to the customer. 5. Create a daily logistics design and PDCA. Inventory strategy drives transportation strategy. Why? 59
  • 60.
    Measure Current OperationalMetrics • Minimum Order Quantity (MOQ) – Smallest amount that can be ordered, either from suppliers or by customers. • Lot Size – Packaging size increment of orders. Should equal MOQ, with efforts to continuously shrink lot size. • Cadence – Quantity & frequency with which materials move through fulfillment stream. Should match… • Takt Time – The precise customer demand rate, measured by dividing available production time by customer demand. The goal is to sync production with customer demand, the heartbeat of Lean. 60
  • 61.
  • 62.
  • 63.
    Determine Current Performance •We strive for “perfect order execution” (POE, also known as “first time quality” (FTQ)). • The eight “rights” of logistics are used to assess: Tactical (To The Next Step) – Right quantity – Right product – Right place – Right time – Right quality (product and information) Strategic – Right source – Did the materials come from the right supplier? – Right price – Was the planned price/cost paid? – Right service – Did the customer receive the expected service? 63
  • 64.
    1. Pick AProduct • Focus on a common, high-volume product, and its components, to study. • Enlist the partnership of the suppliers involved. • Remember, not all products and customers are created equal! 64
  • 65.
    Coefficient of Variation •Measurement of stability of demand • Calculated by dividing standard deviation by the mean (average) for demand: COV = STDDEV / MEAN COV < 0.2 Stable SKU & Candidate for LFS COV > 0.2 AND Trending To Stable or Unstable COV < 1.0 COV > 1.0 Unstable SKU & Candidate for Rationalization or Make-To-Order 65
  • 66.
  • 67.
    2. Measure CurrentLead Time • Calculate Current Lead Time – Inbound (Supplier) Lead Time + – Manufacturing Lead Time + – Outbound (Customer) Lead Time* + – Raw Material Inventory (ADOH)** + – Finished Goods Inventory (ADOH)** * Tells us how long it’s taking us to respond to customer demand ** How long could we sustain activity before replenishing? 67
  • 68.
    3. Calculate theCurrent Total Cost of Fulfillment • Identify the key areas in your fulfillment stream, and what they’re costing you to operate. – Supplier collaboration (portals, EDI) – Supplier parts and material ordering (parts ordering and planning) – Inbound logistics (transportation; internal and external) – Shipping, receiving & trailer-yard management (material-handling and yard equipment) – Outbound logistics (transportation & distribution; internal and external) – Customer collaboration (customer service & demand planning) • Add the cost of carrying inventory • Make this cost known to all partners; reducing it as a % of sales will be everyone’s goal! 68
  • 69.
    4. Determine Costof Inventory • Excess inventory is waste! It ties up cash and hides process problems. • Knowing your costs is key to eliminating them. • Typical carrying costs include: – The cost of capital (borrowing money) – Damages – Insurance – Obsolescence, donations, write-downs and write-offs – Shrinkage 69
  • 70.
    Your Future State •Lean improvements occur over time, and build on one another. • Improvements must be pursued simultaneously. • The focus is on reducing cost. • Lean is NOT about eliminating jobs. • Lean IS about eliminating waste. 70
  • 71.
    PDCA The Process •Critical in avoiding the waste of inventory build-ups. • Changes along the fulfillment stream can quickly impact the ordering process. • These PDCA events evaluate components like: – Do we have new parts we need to plan for? – Have we addressed gathering any data we’re missing on existing parts? – Have lot sizes & MOQs been optimized? – Have we removed all unnecessary parts from inventory (5S)? – Are we using the appropriate method to order each part? – How can we continue to improve the process?
  • 72.
    Change Acceptance • Whyis it so hard to get people to buy into change? 72
  • 73.
    Resistance to Change •Fear • Comfort • No Perceived Need (If It Ain’t Broke, Don’t Fix It!) • No Faith In Process • Lack of Knowledge • Lack of Trust • Perceived Lack of Choice • Their Own Personality 73
  • 74.
    Session Exercise #3 Whenwill you start? 74
  • 75.
    Next Steps forLean Logistics and Warehousing • Questions? • If interested in a complimentary 2 hour Warehouse Diagnostic, let MAGNET know as you exit at the session, and we’ll follow-up to – Qualify your problem and schedule your session • Thank you for Attending