Downloaded 80 times
![[The tools]
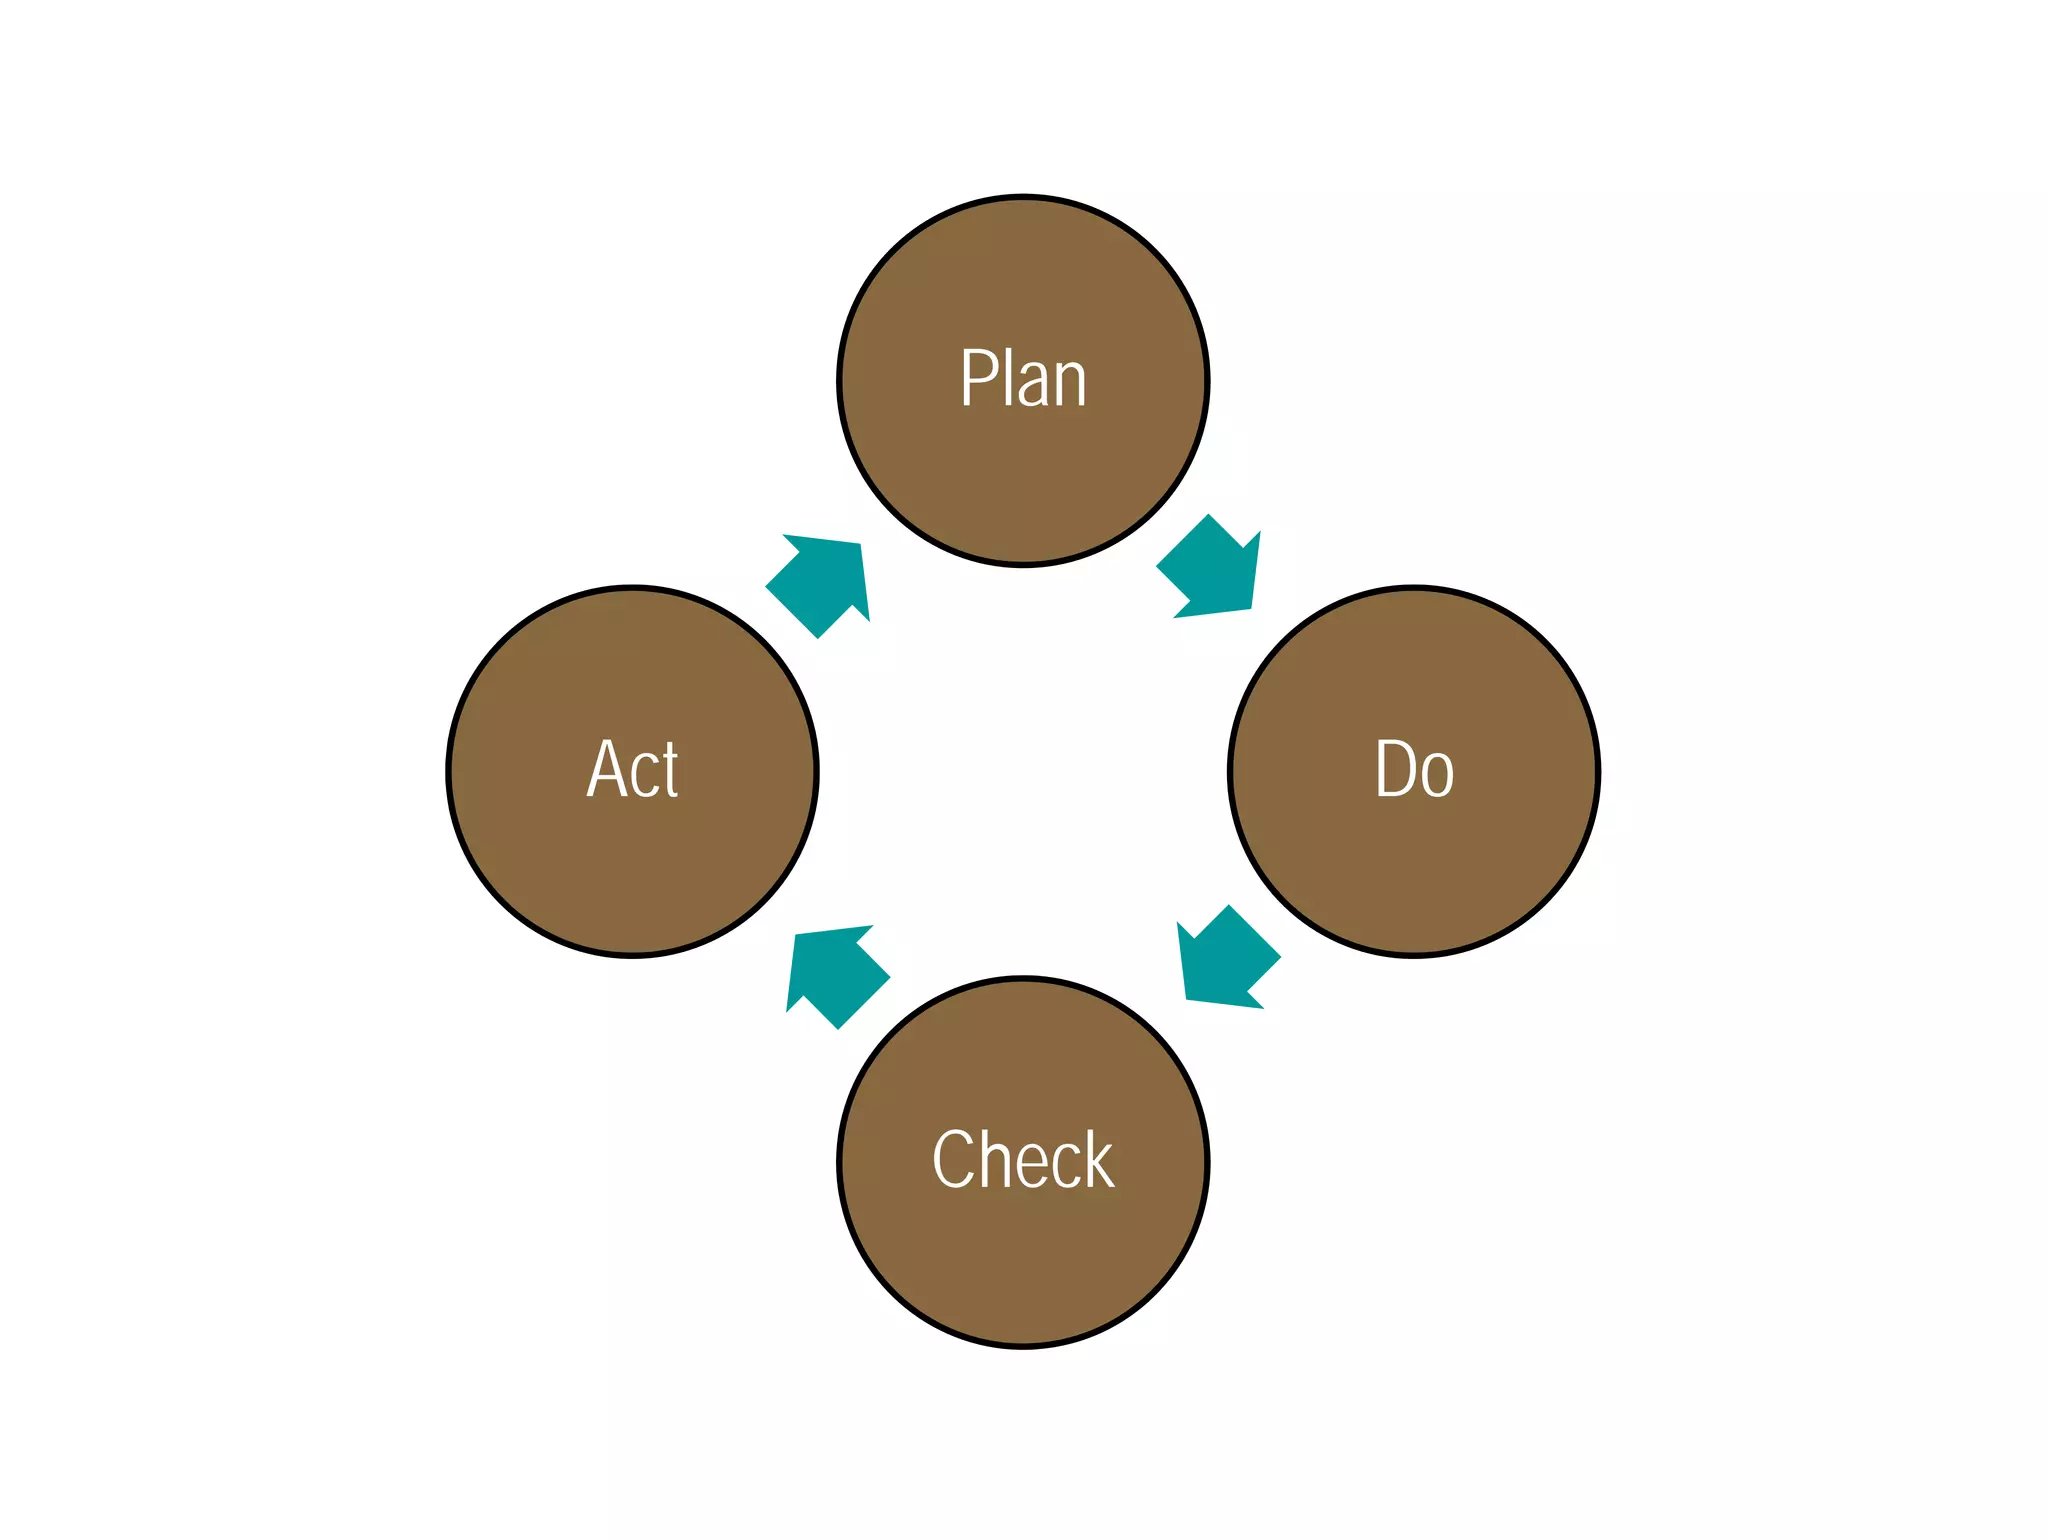
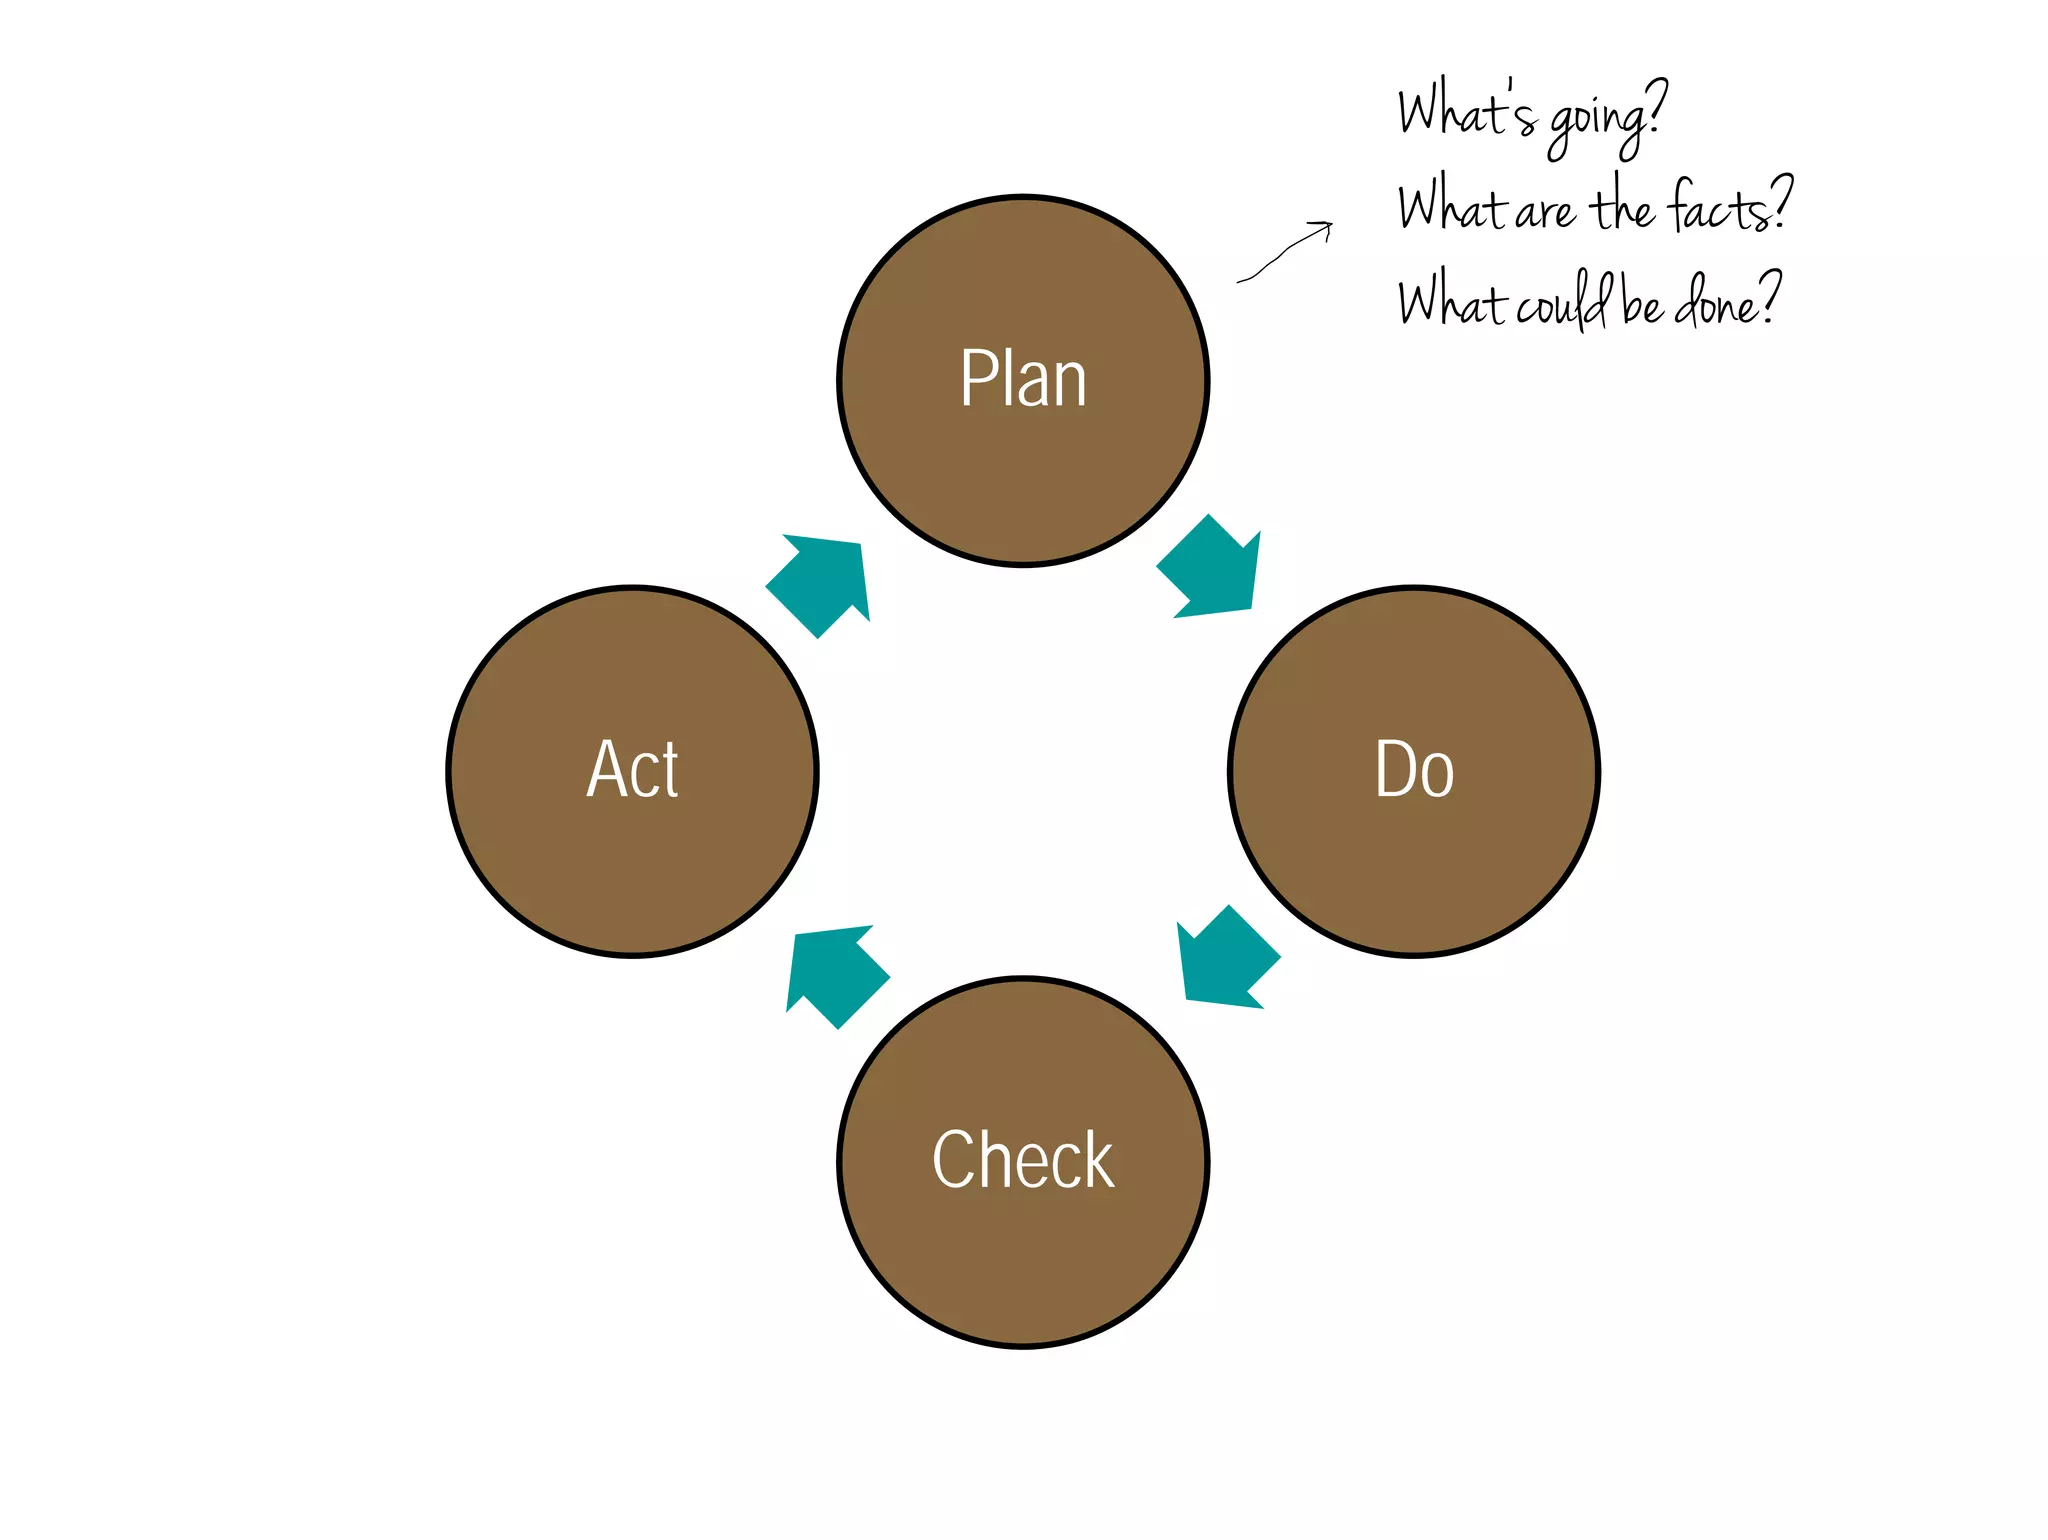
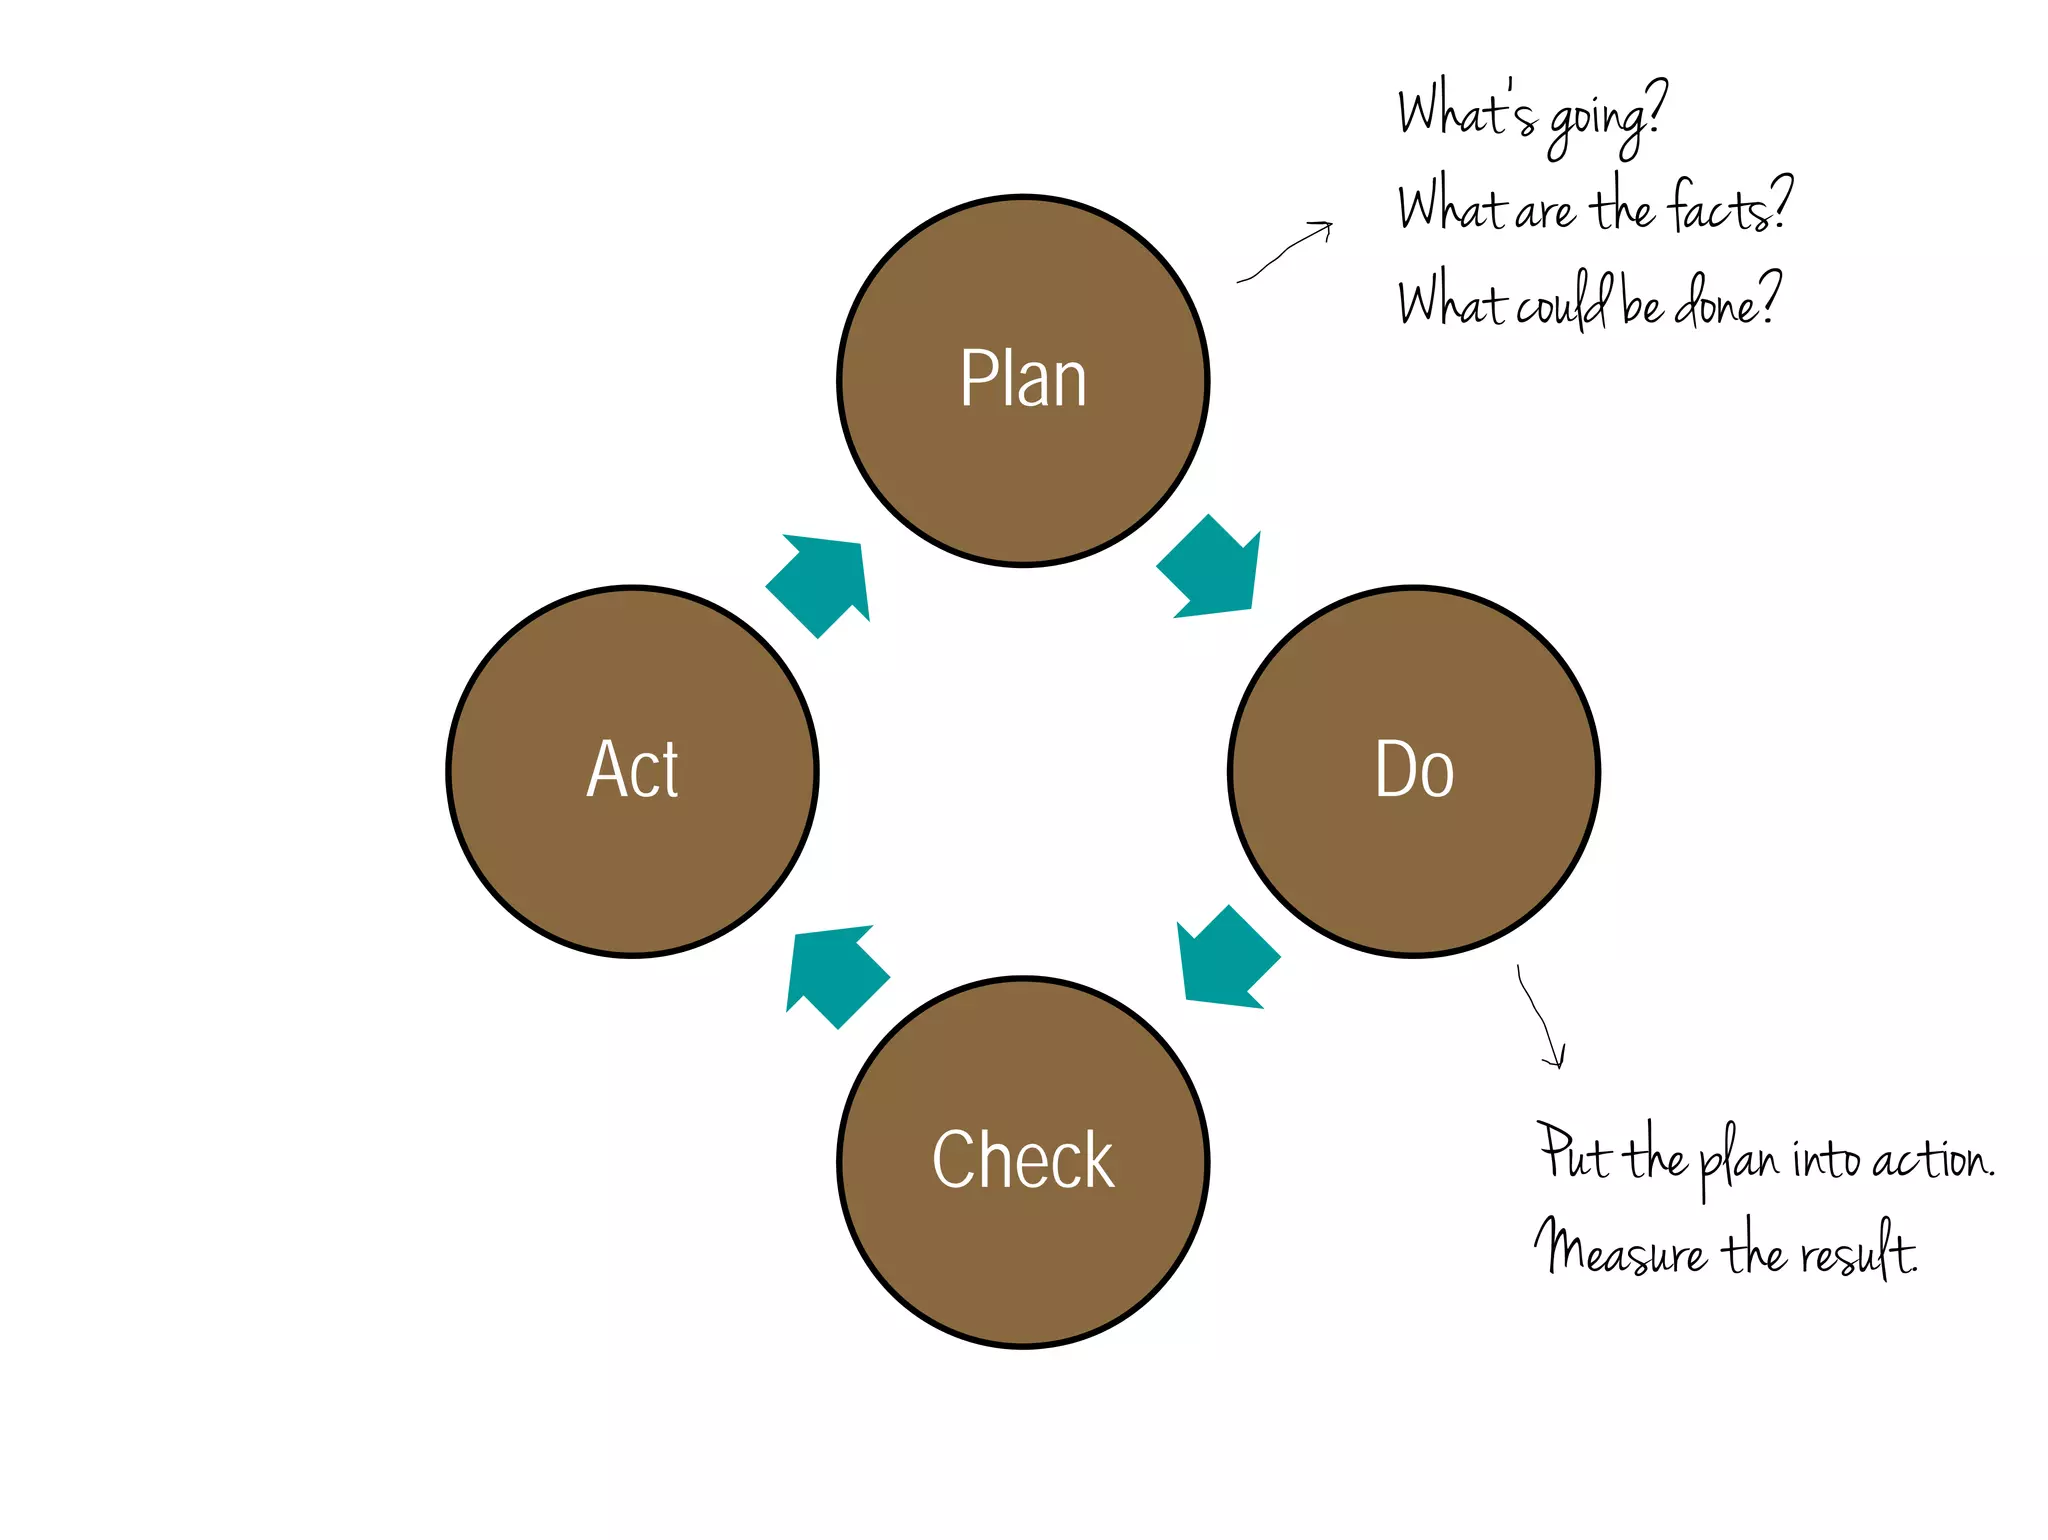
PDCA
5 Whys
One-piece flow
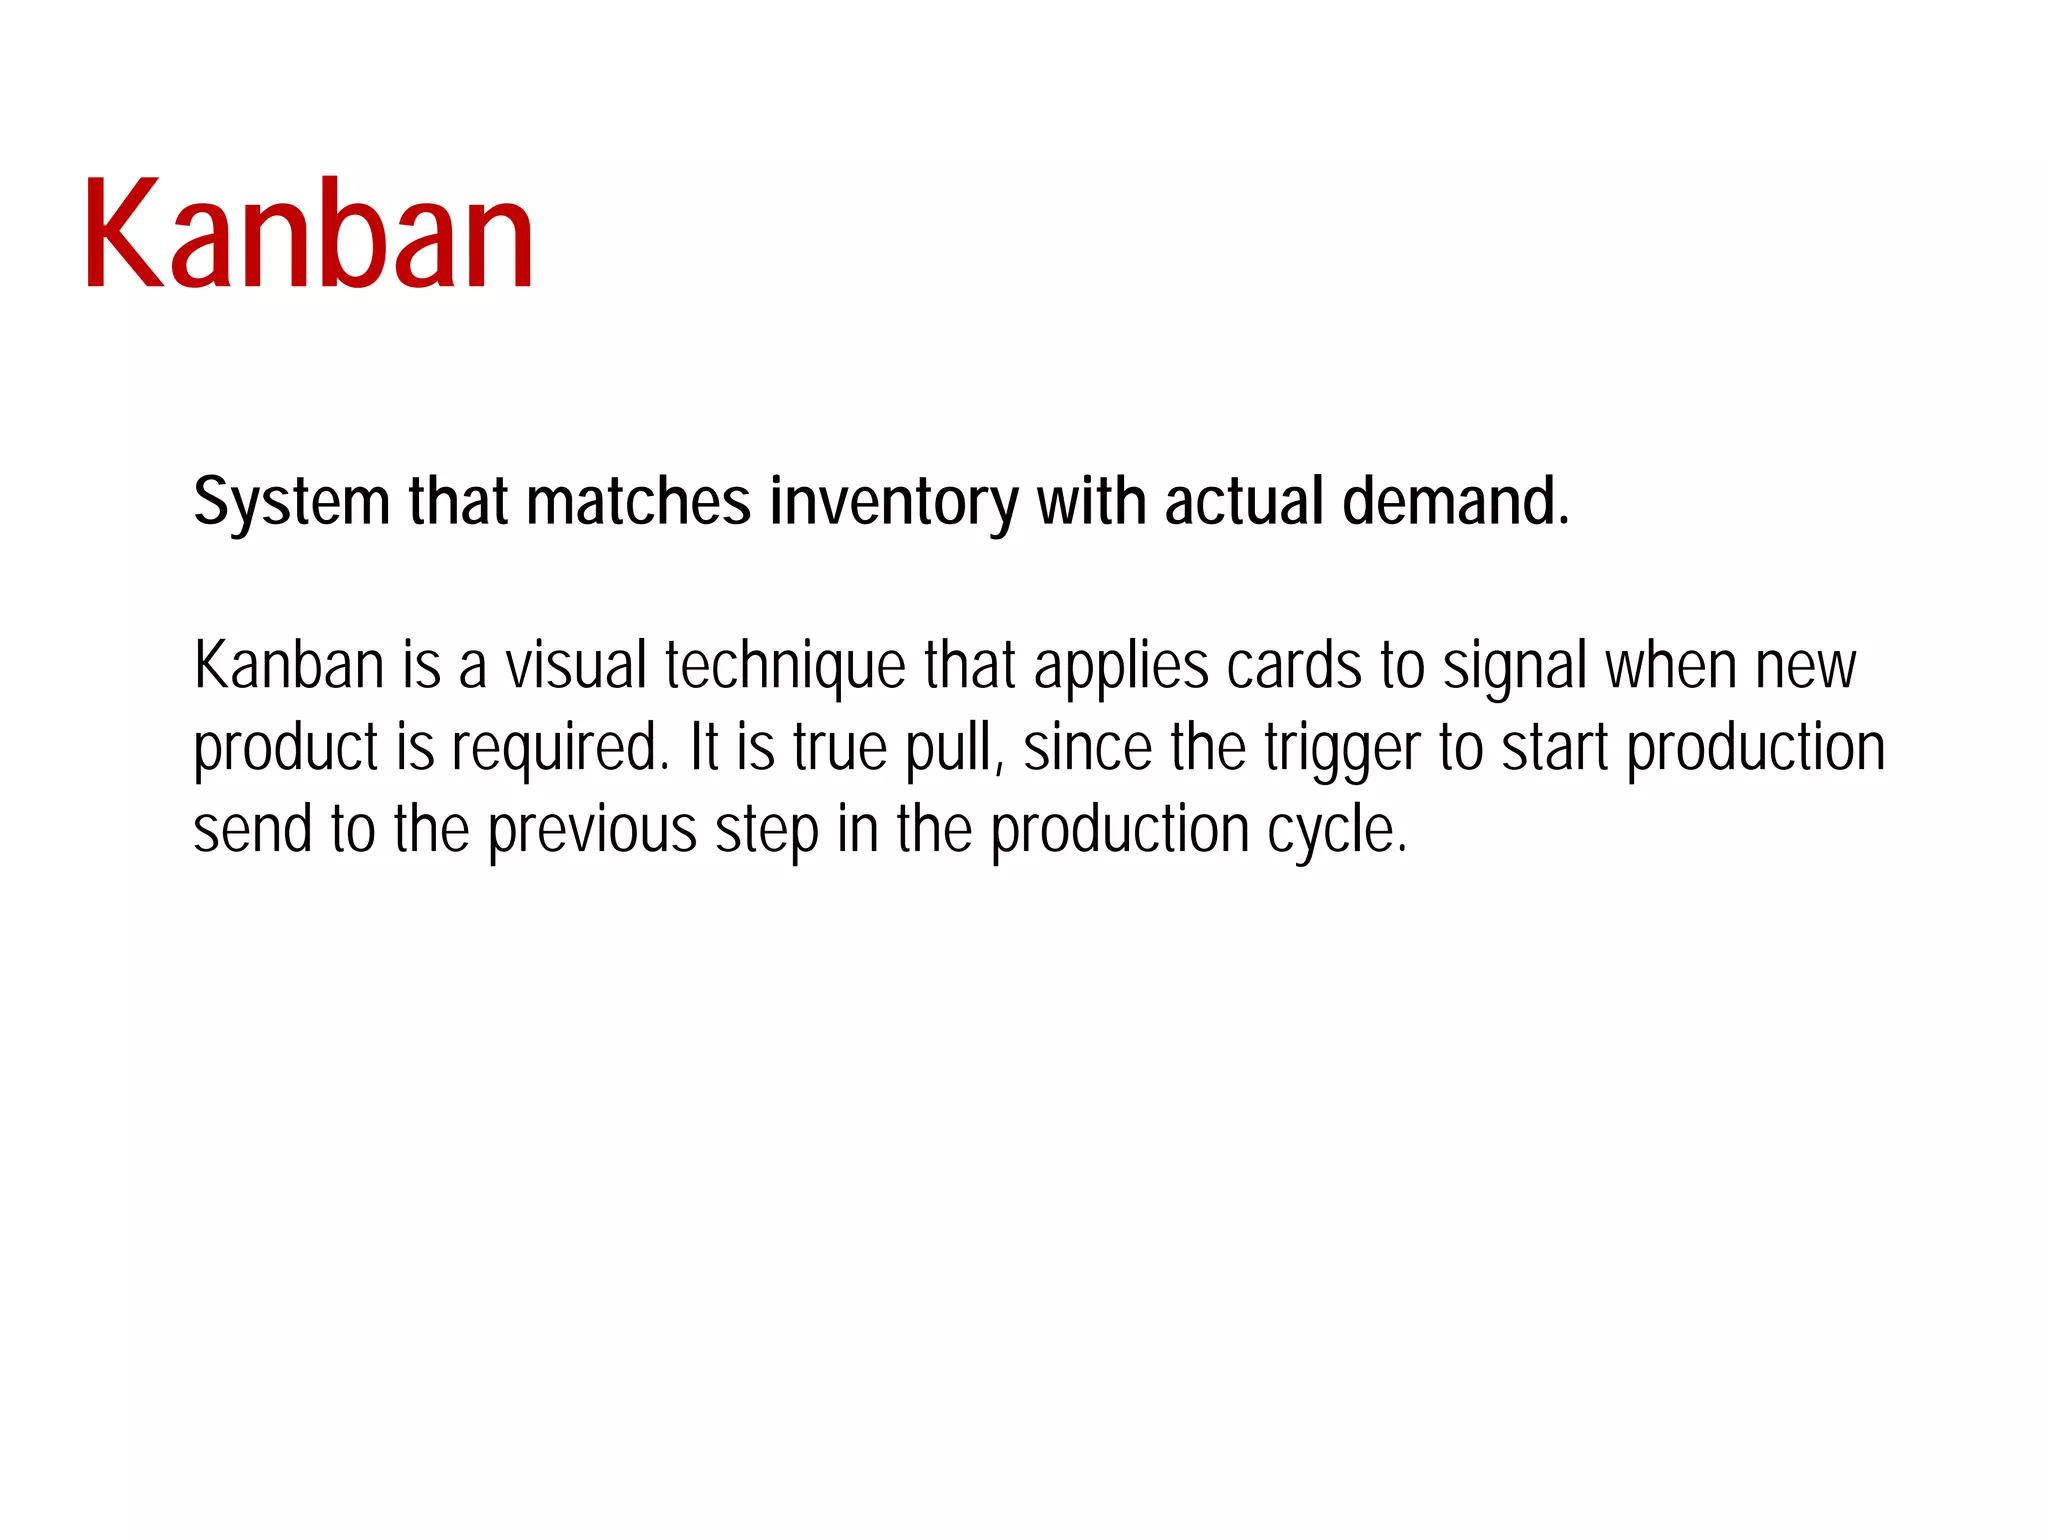
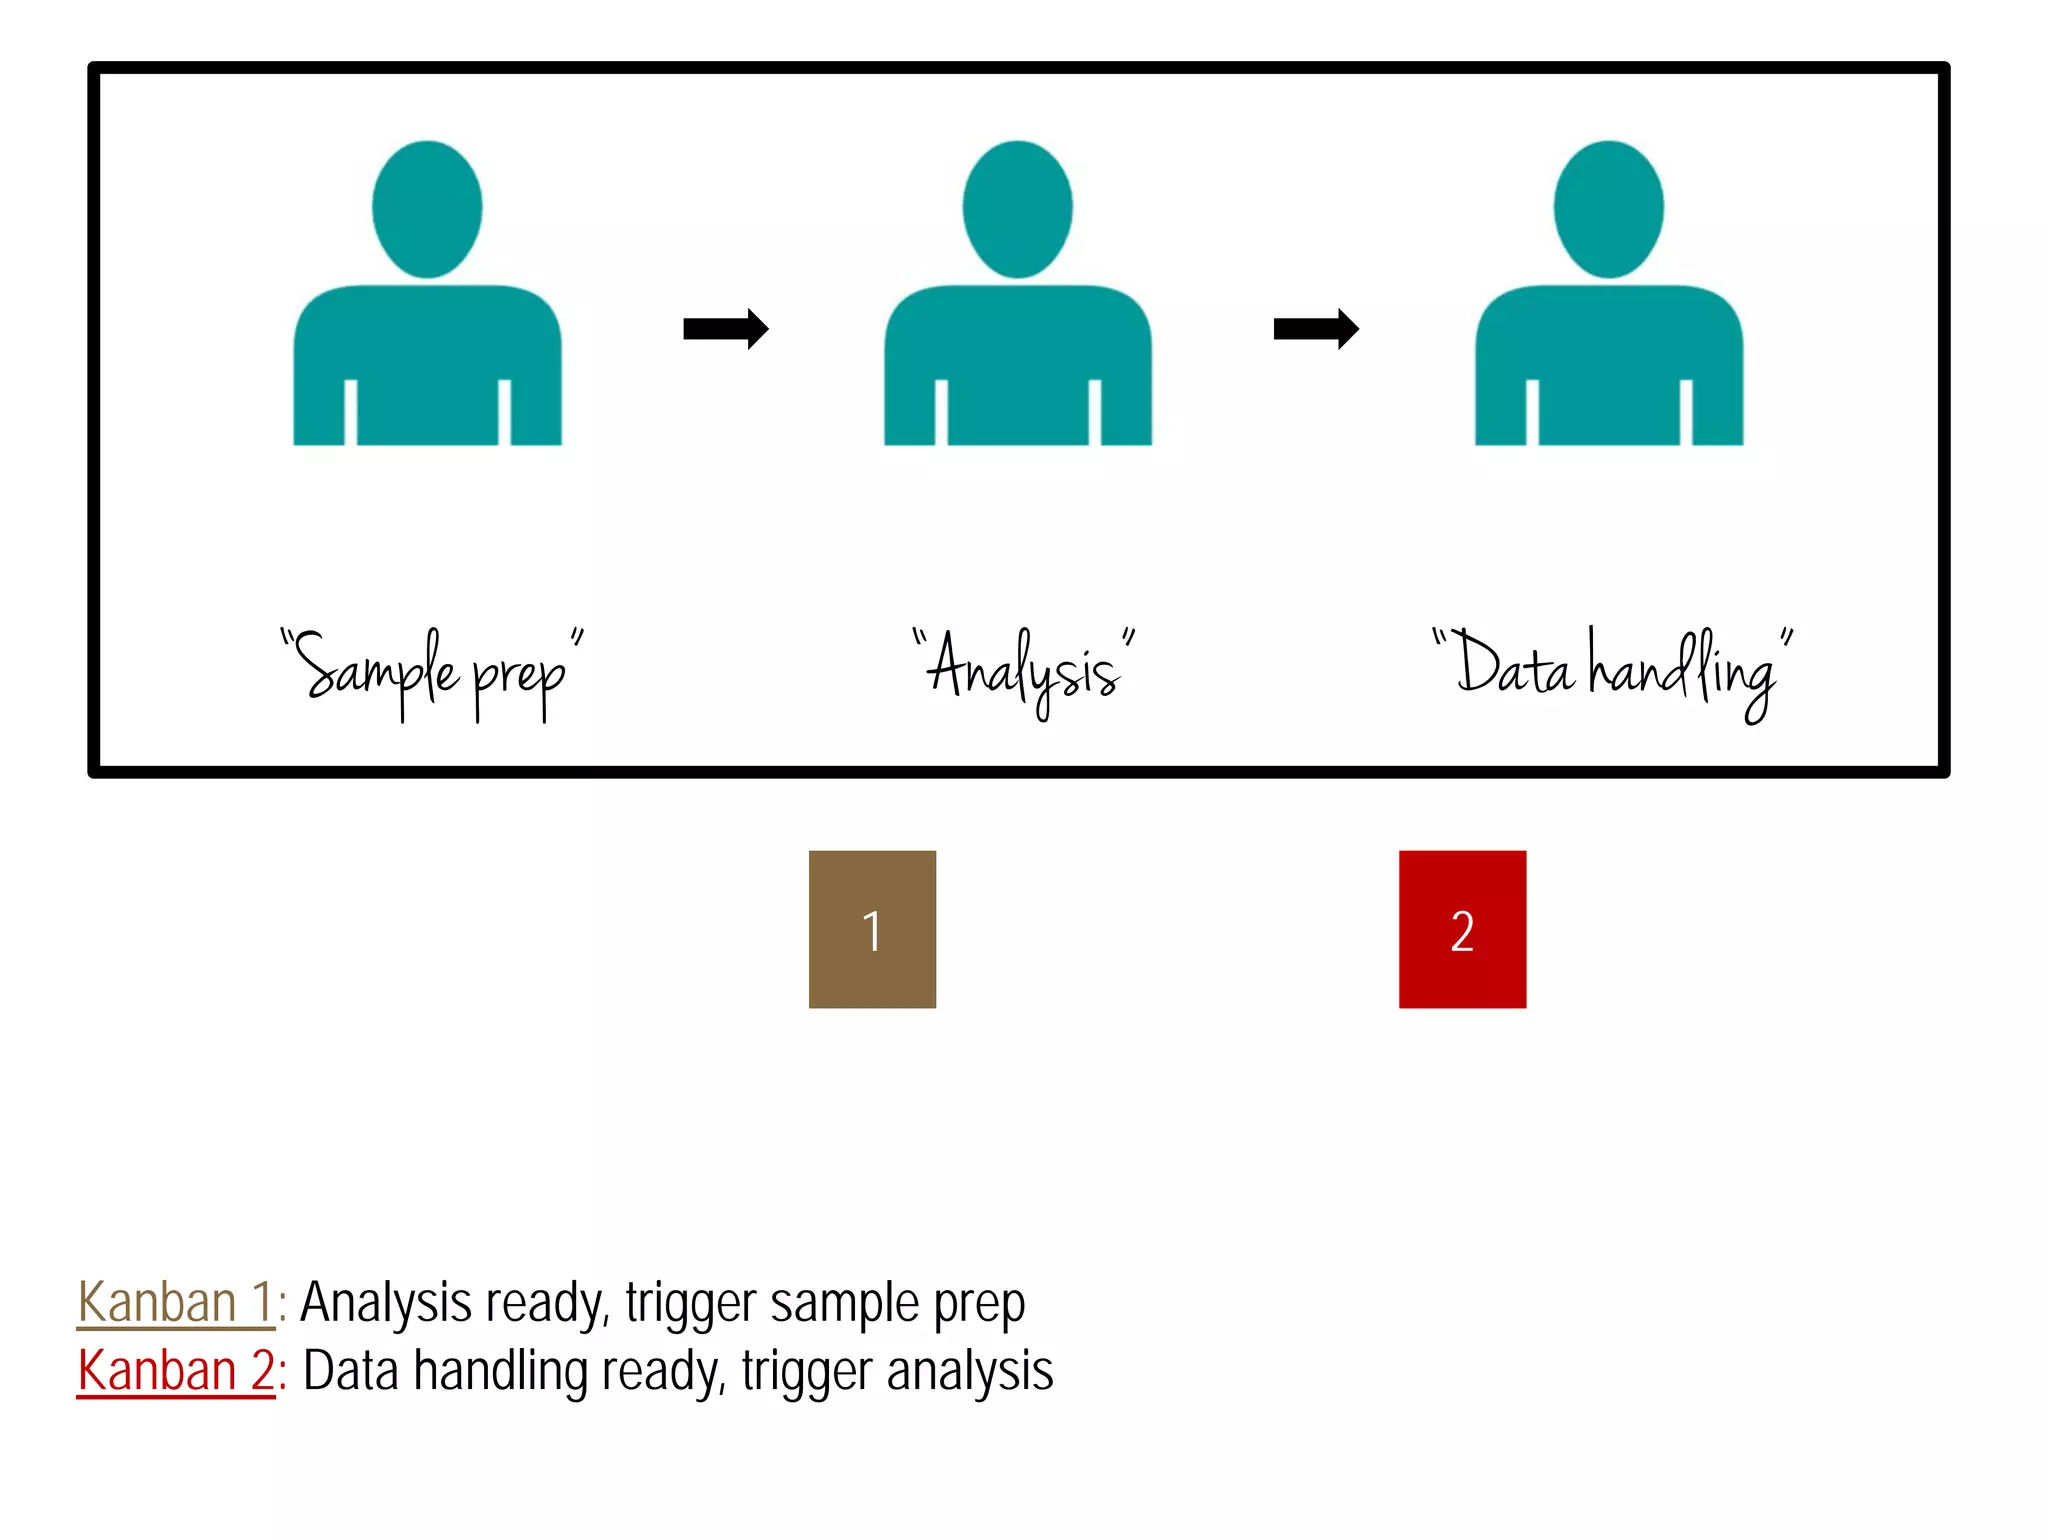
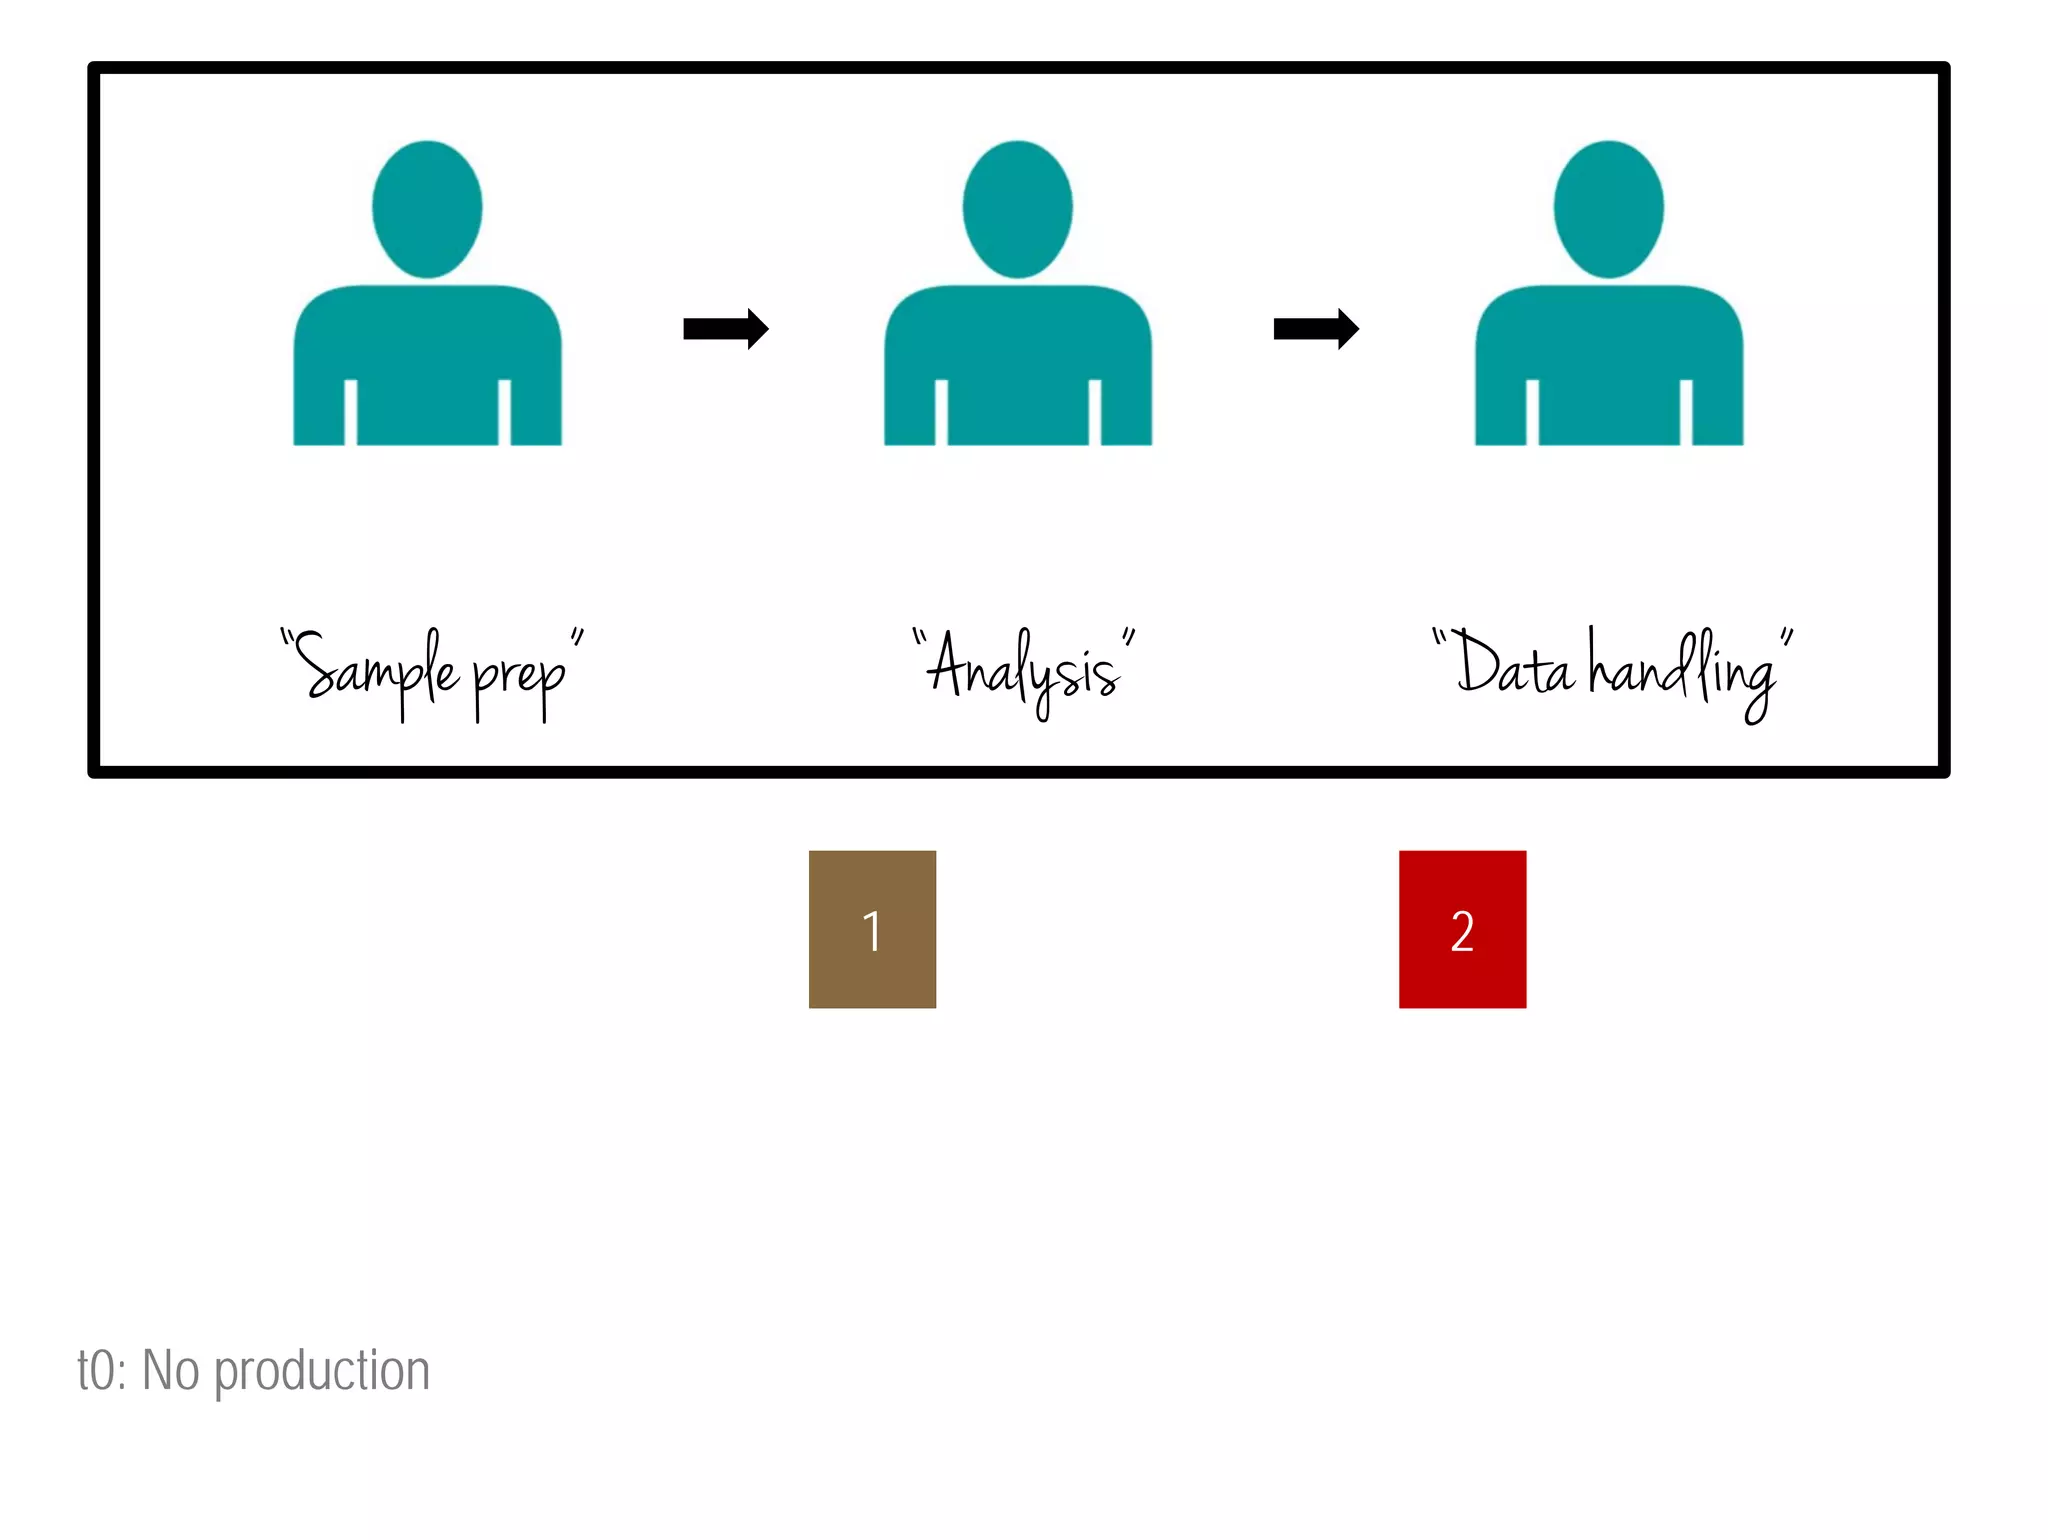
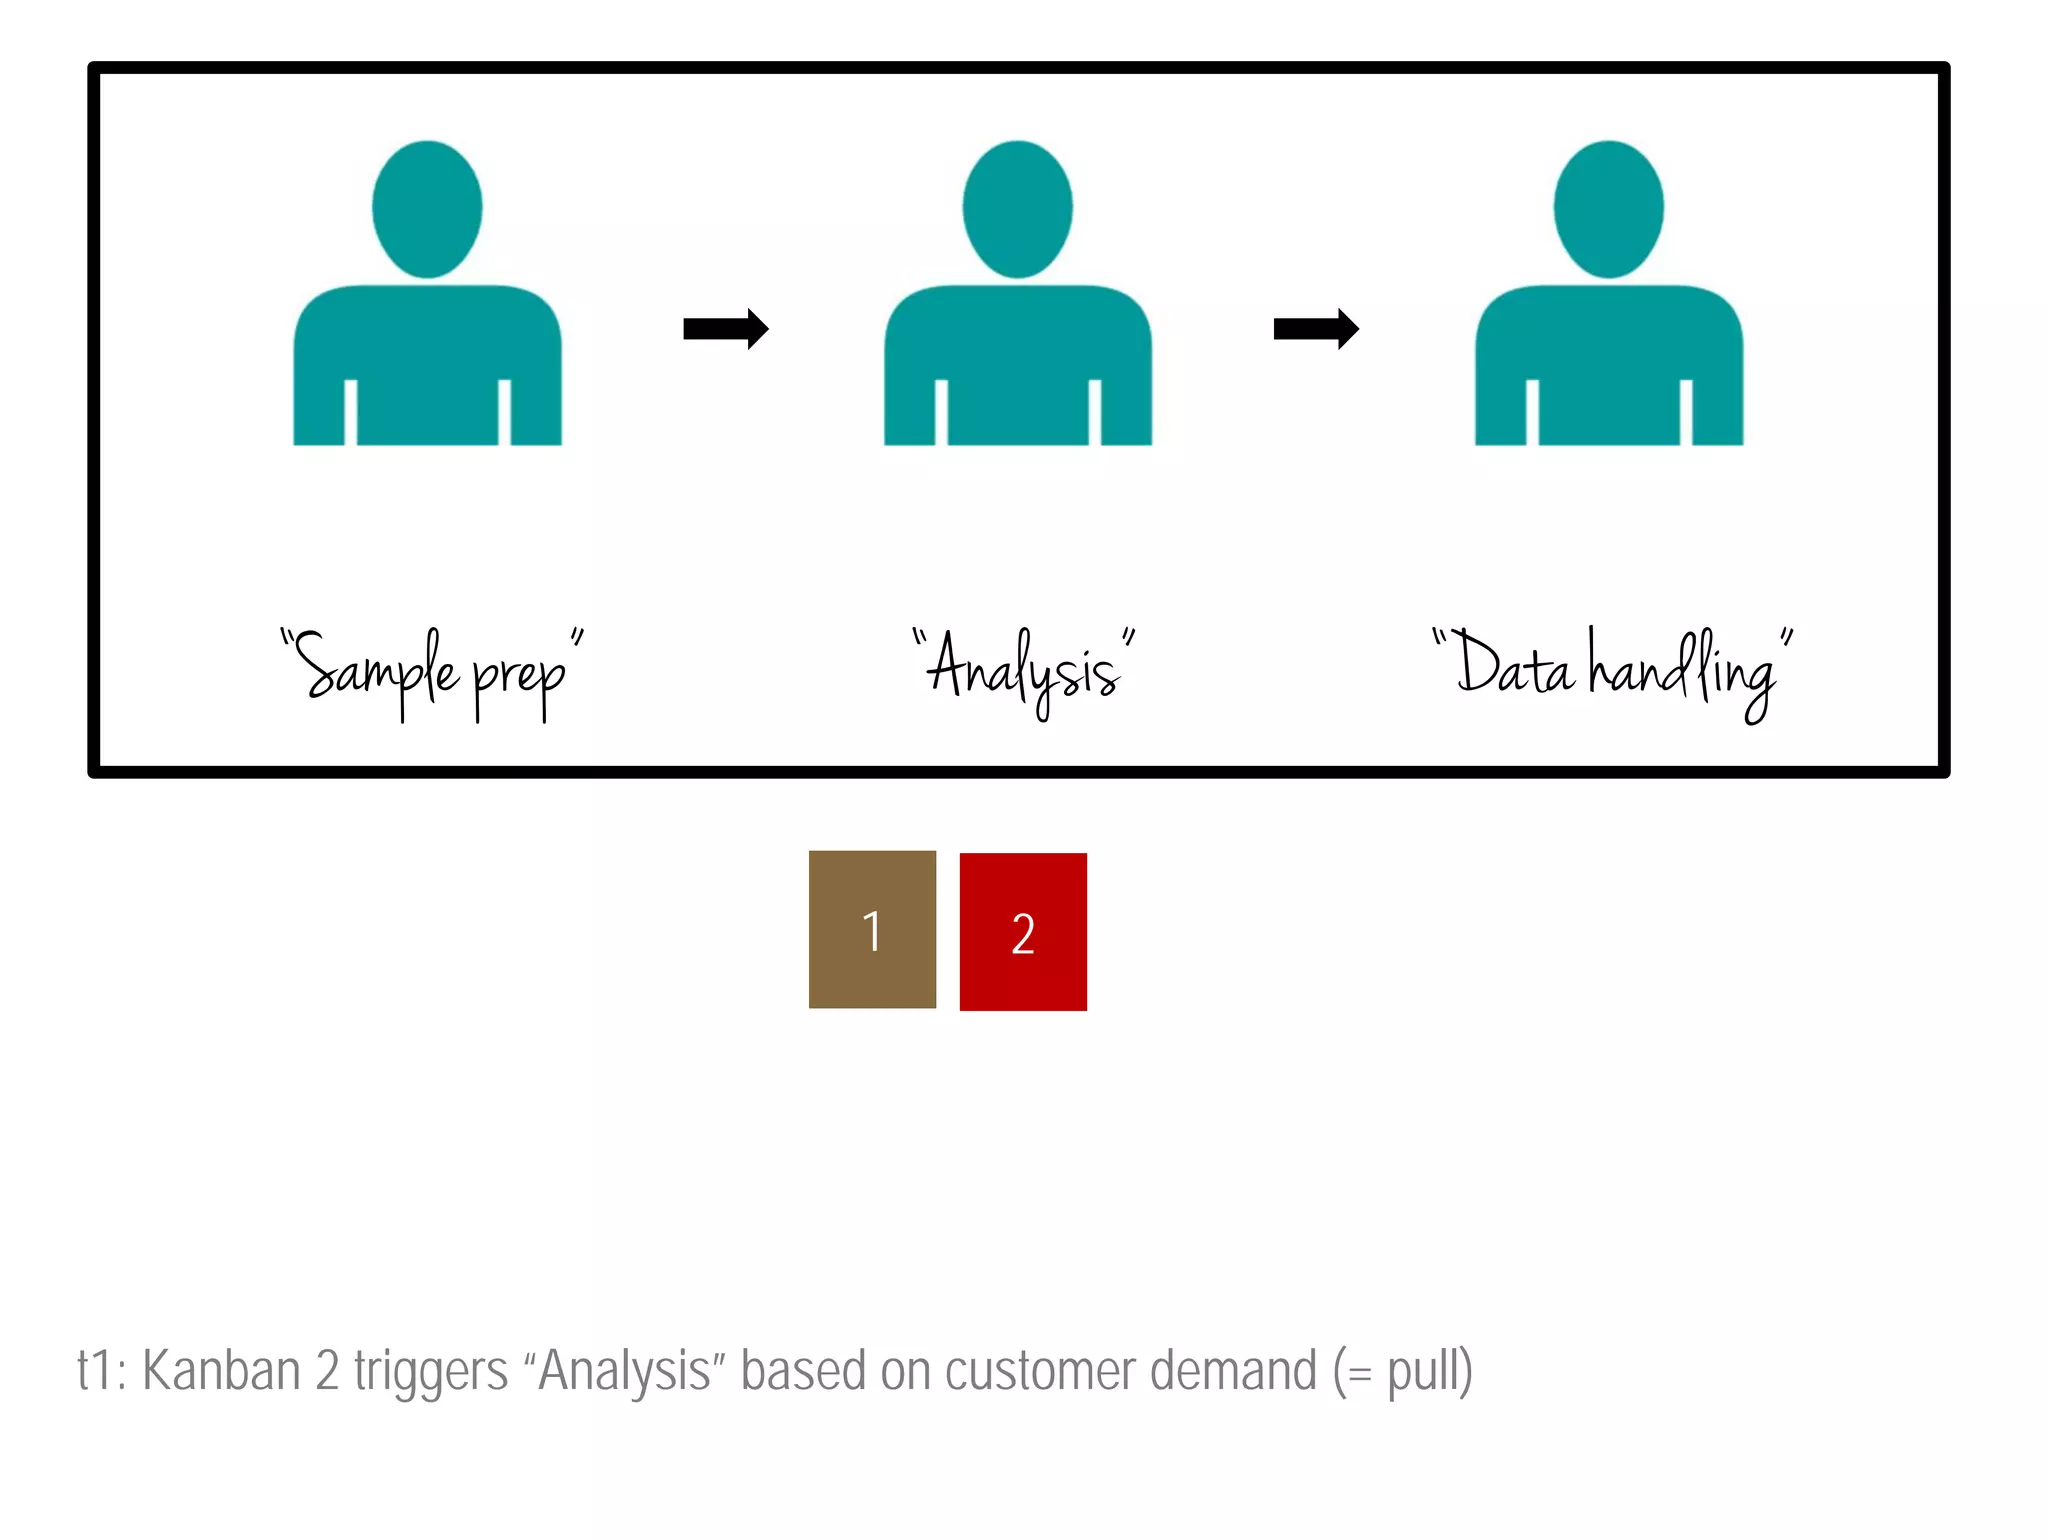
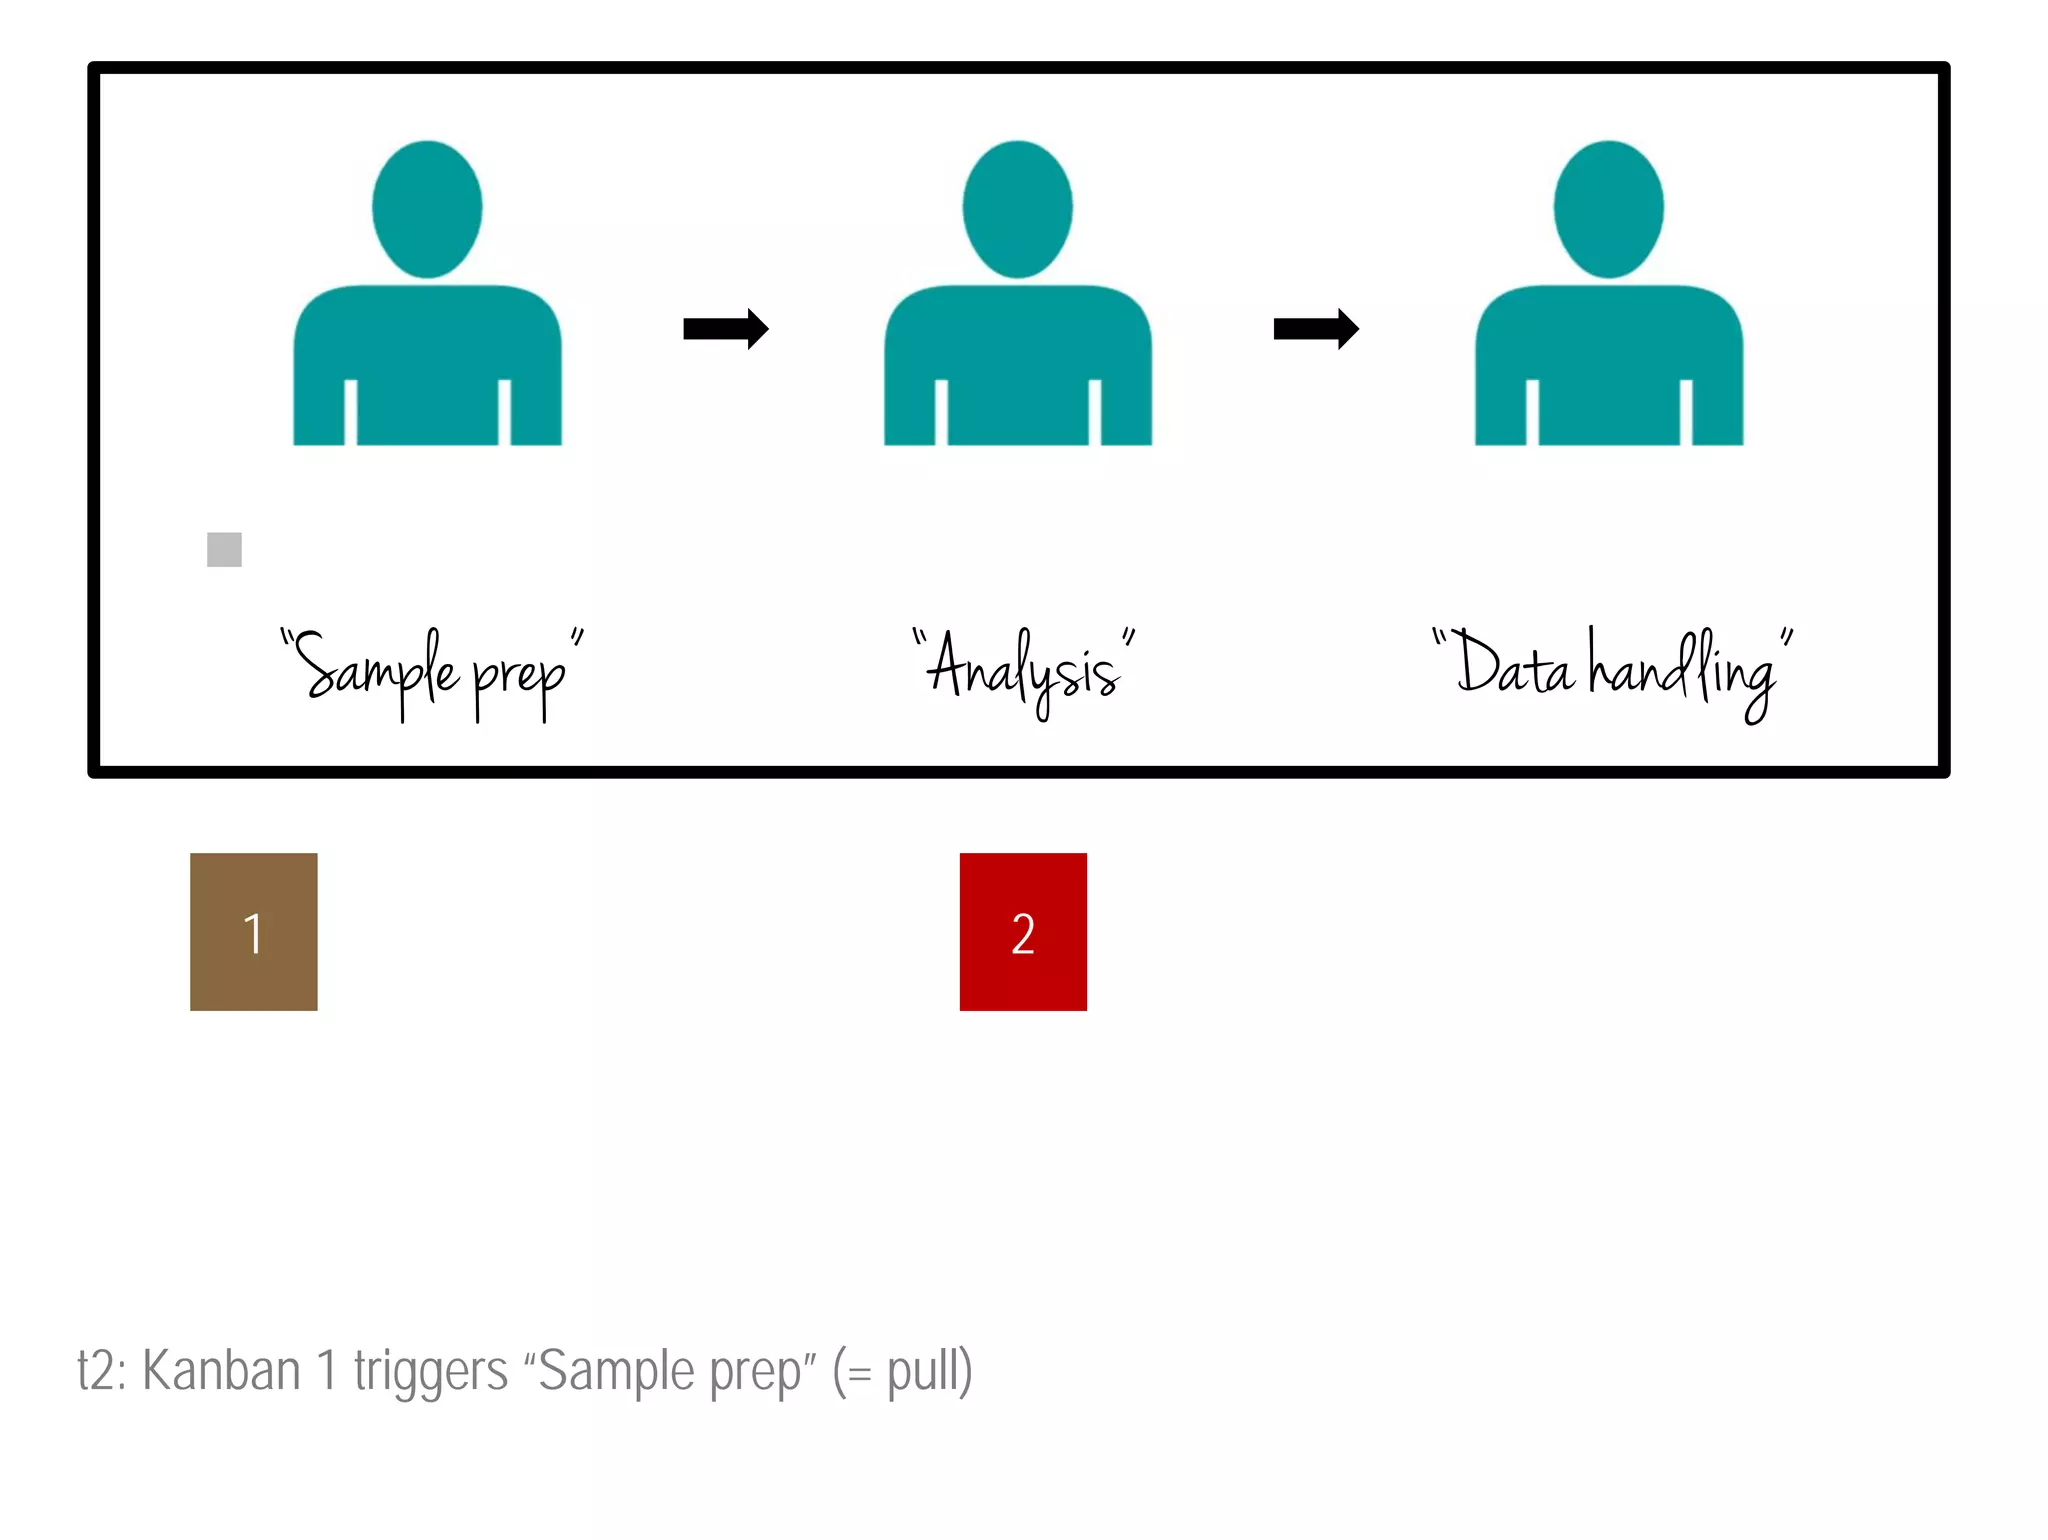
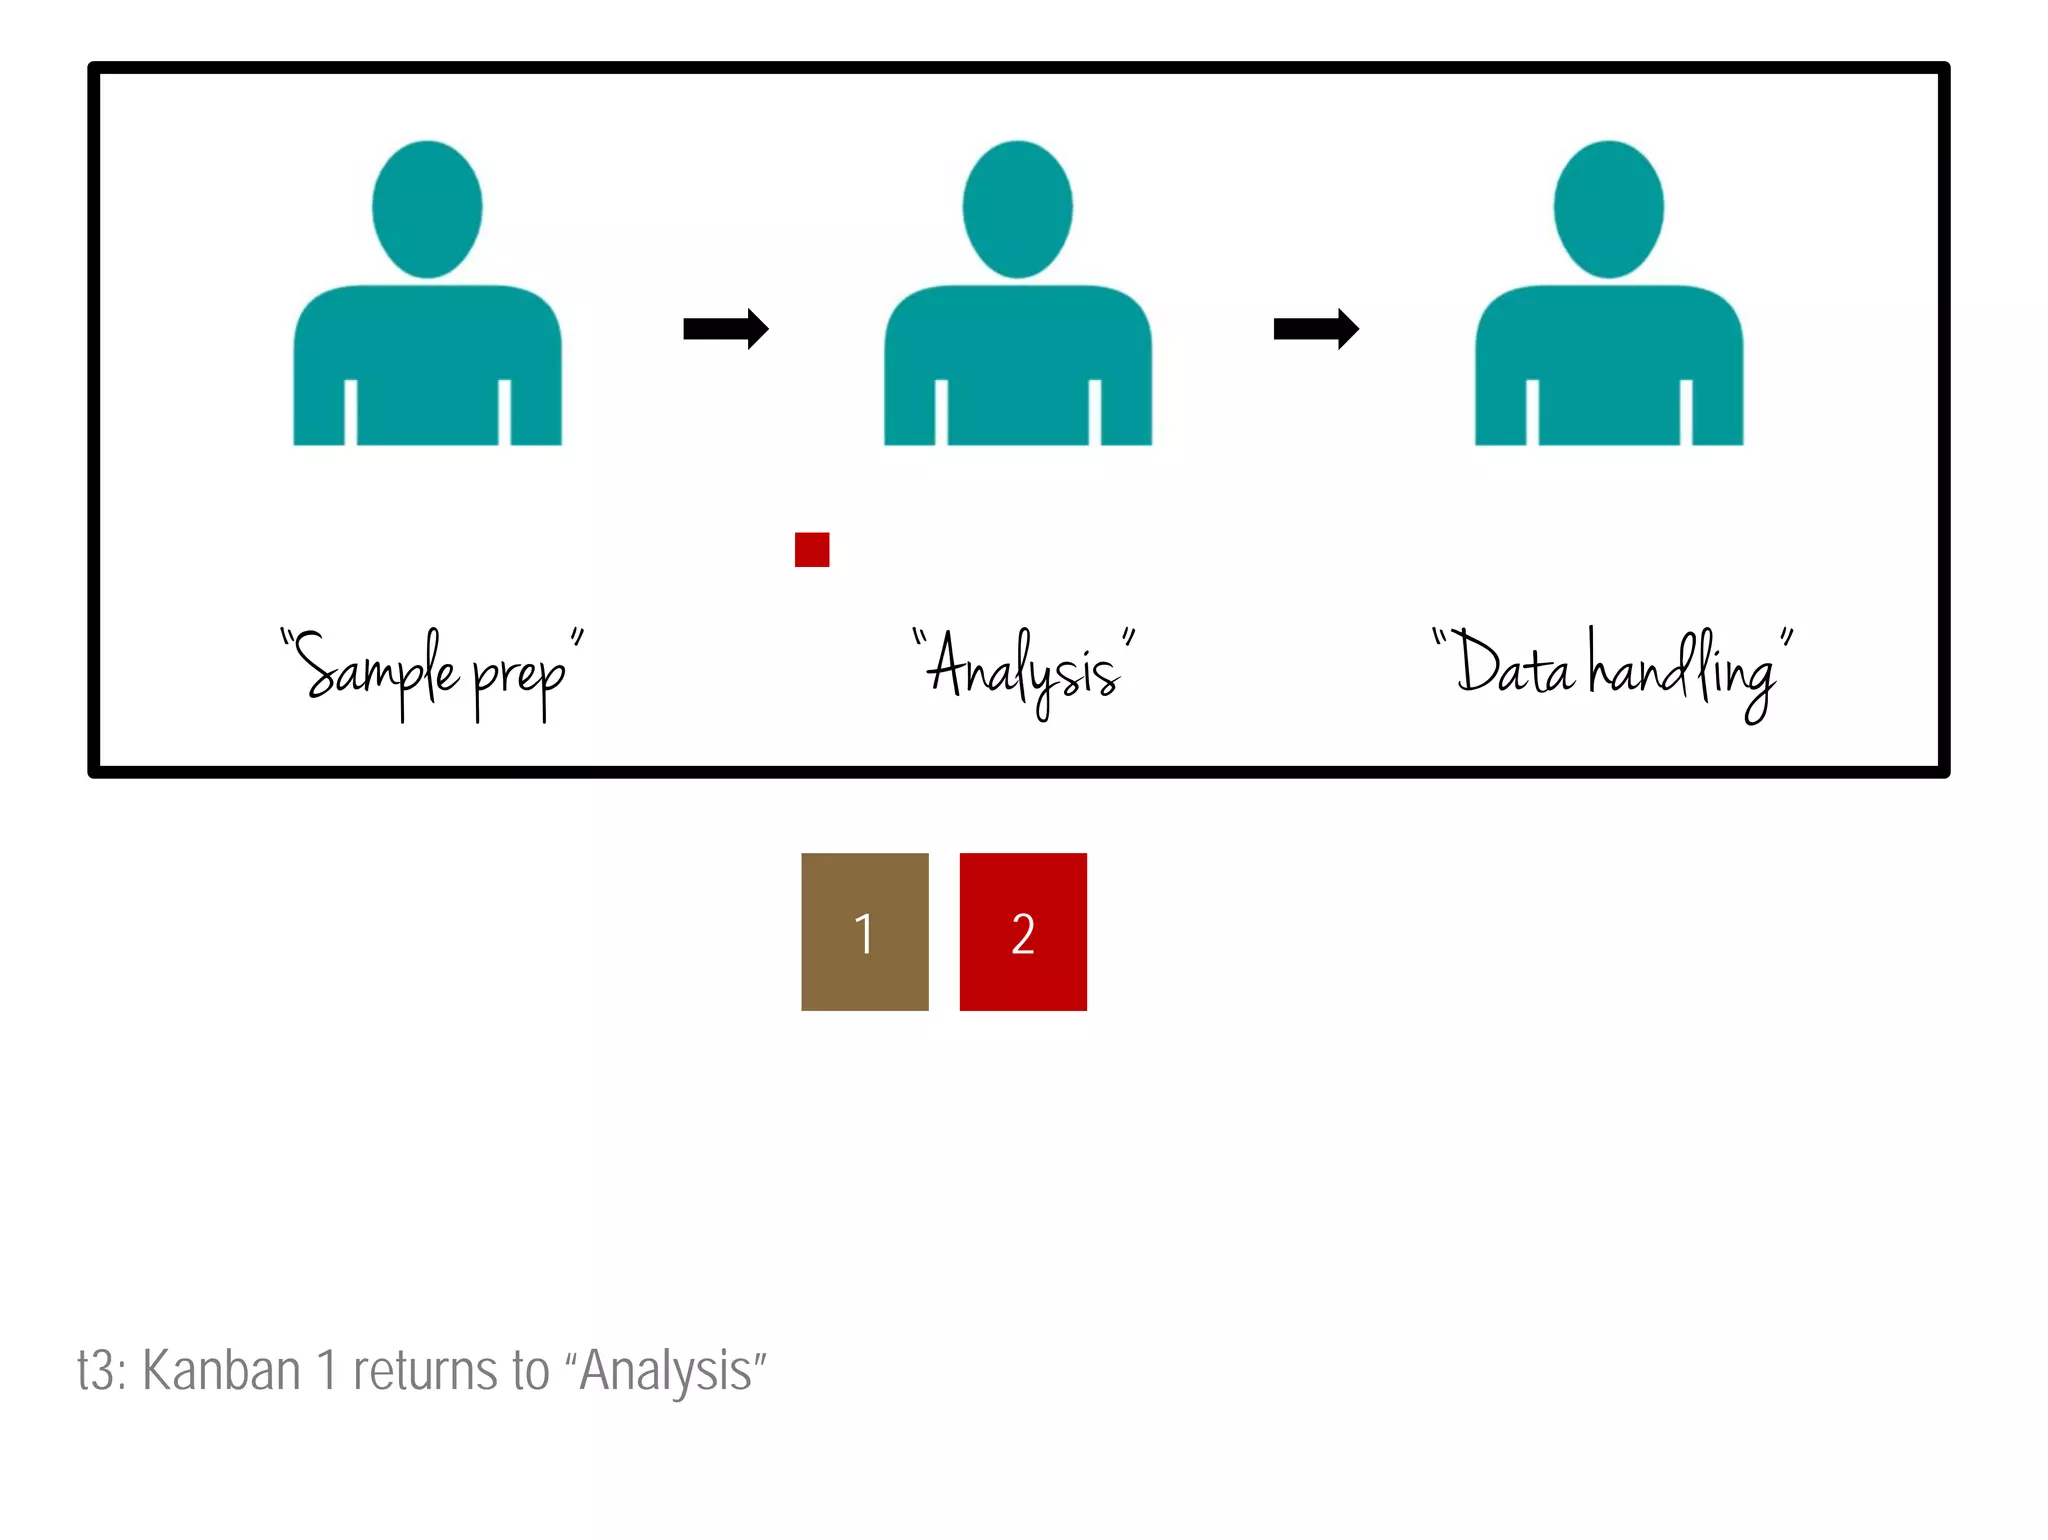
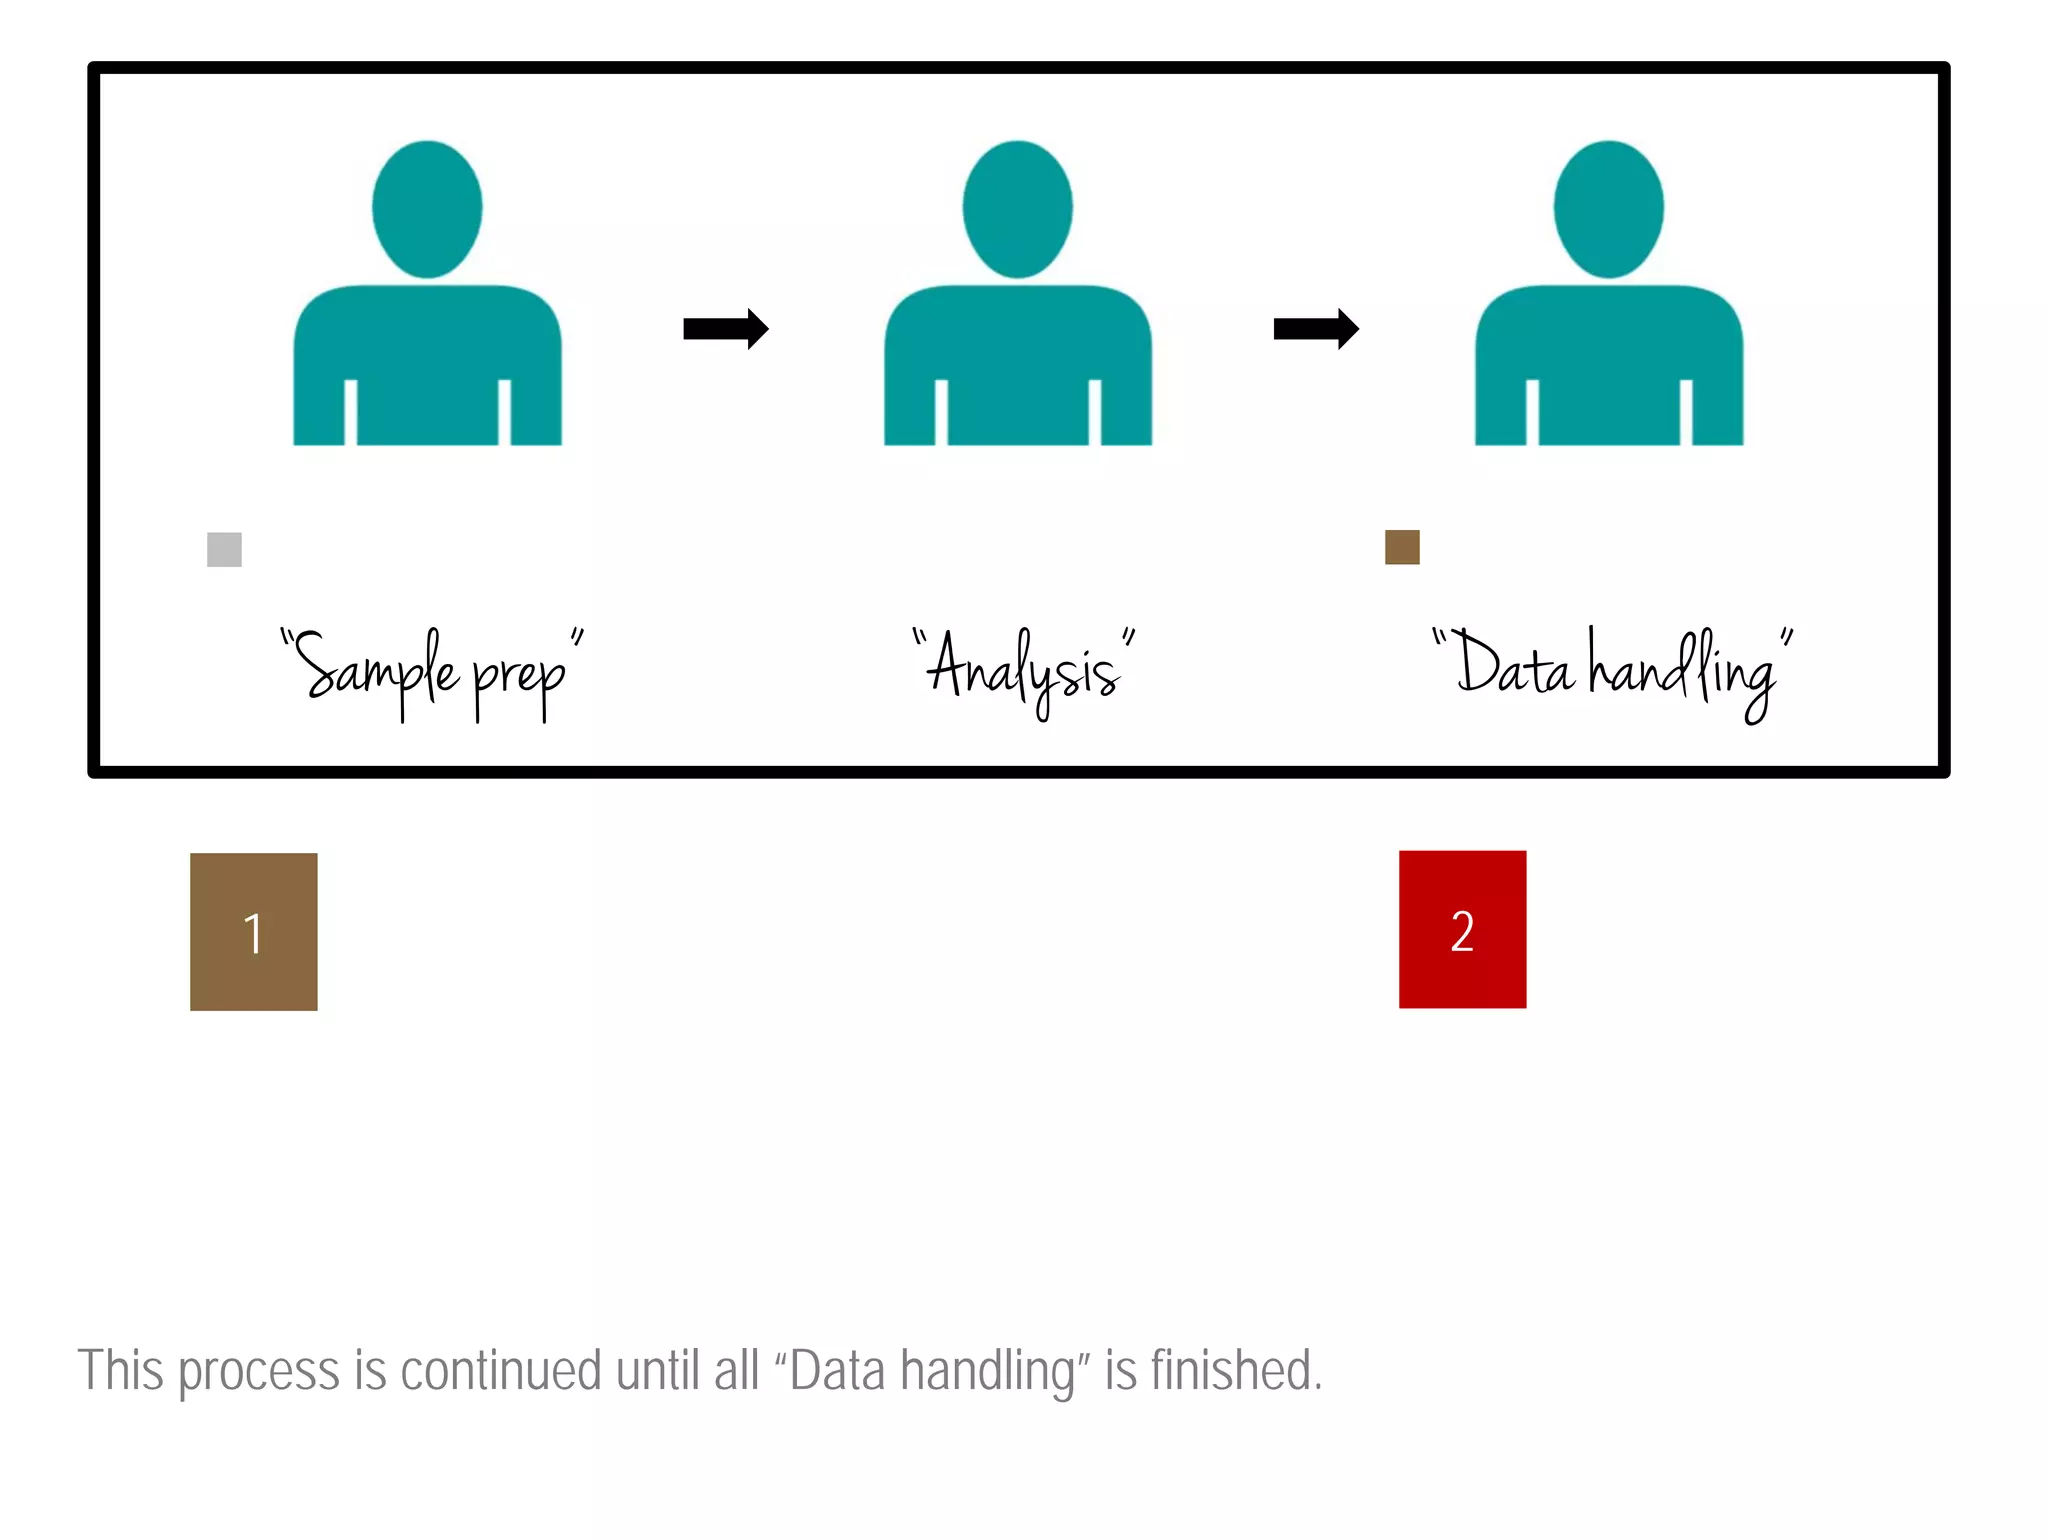
Kanban
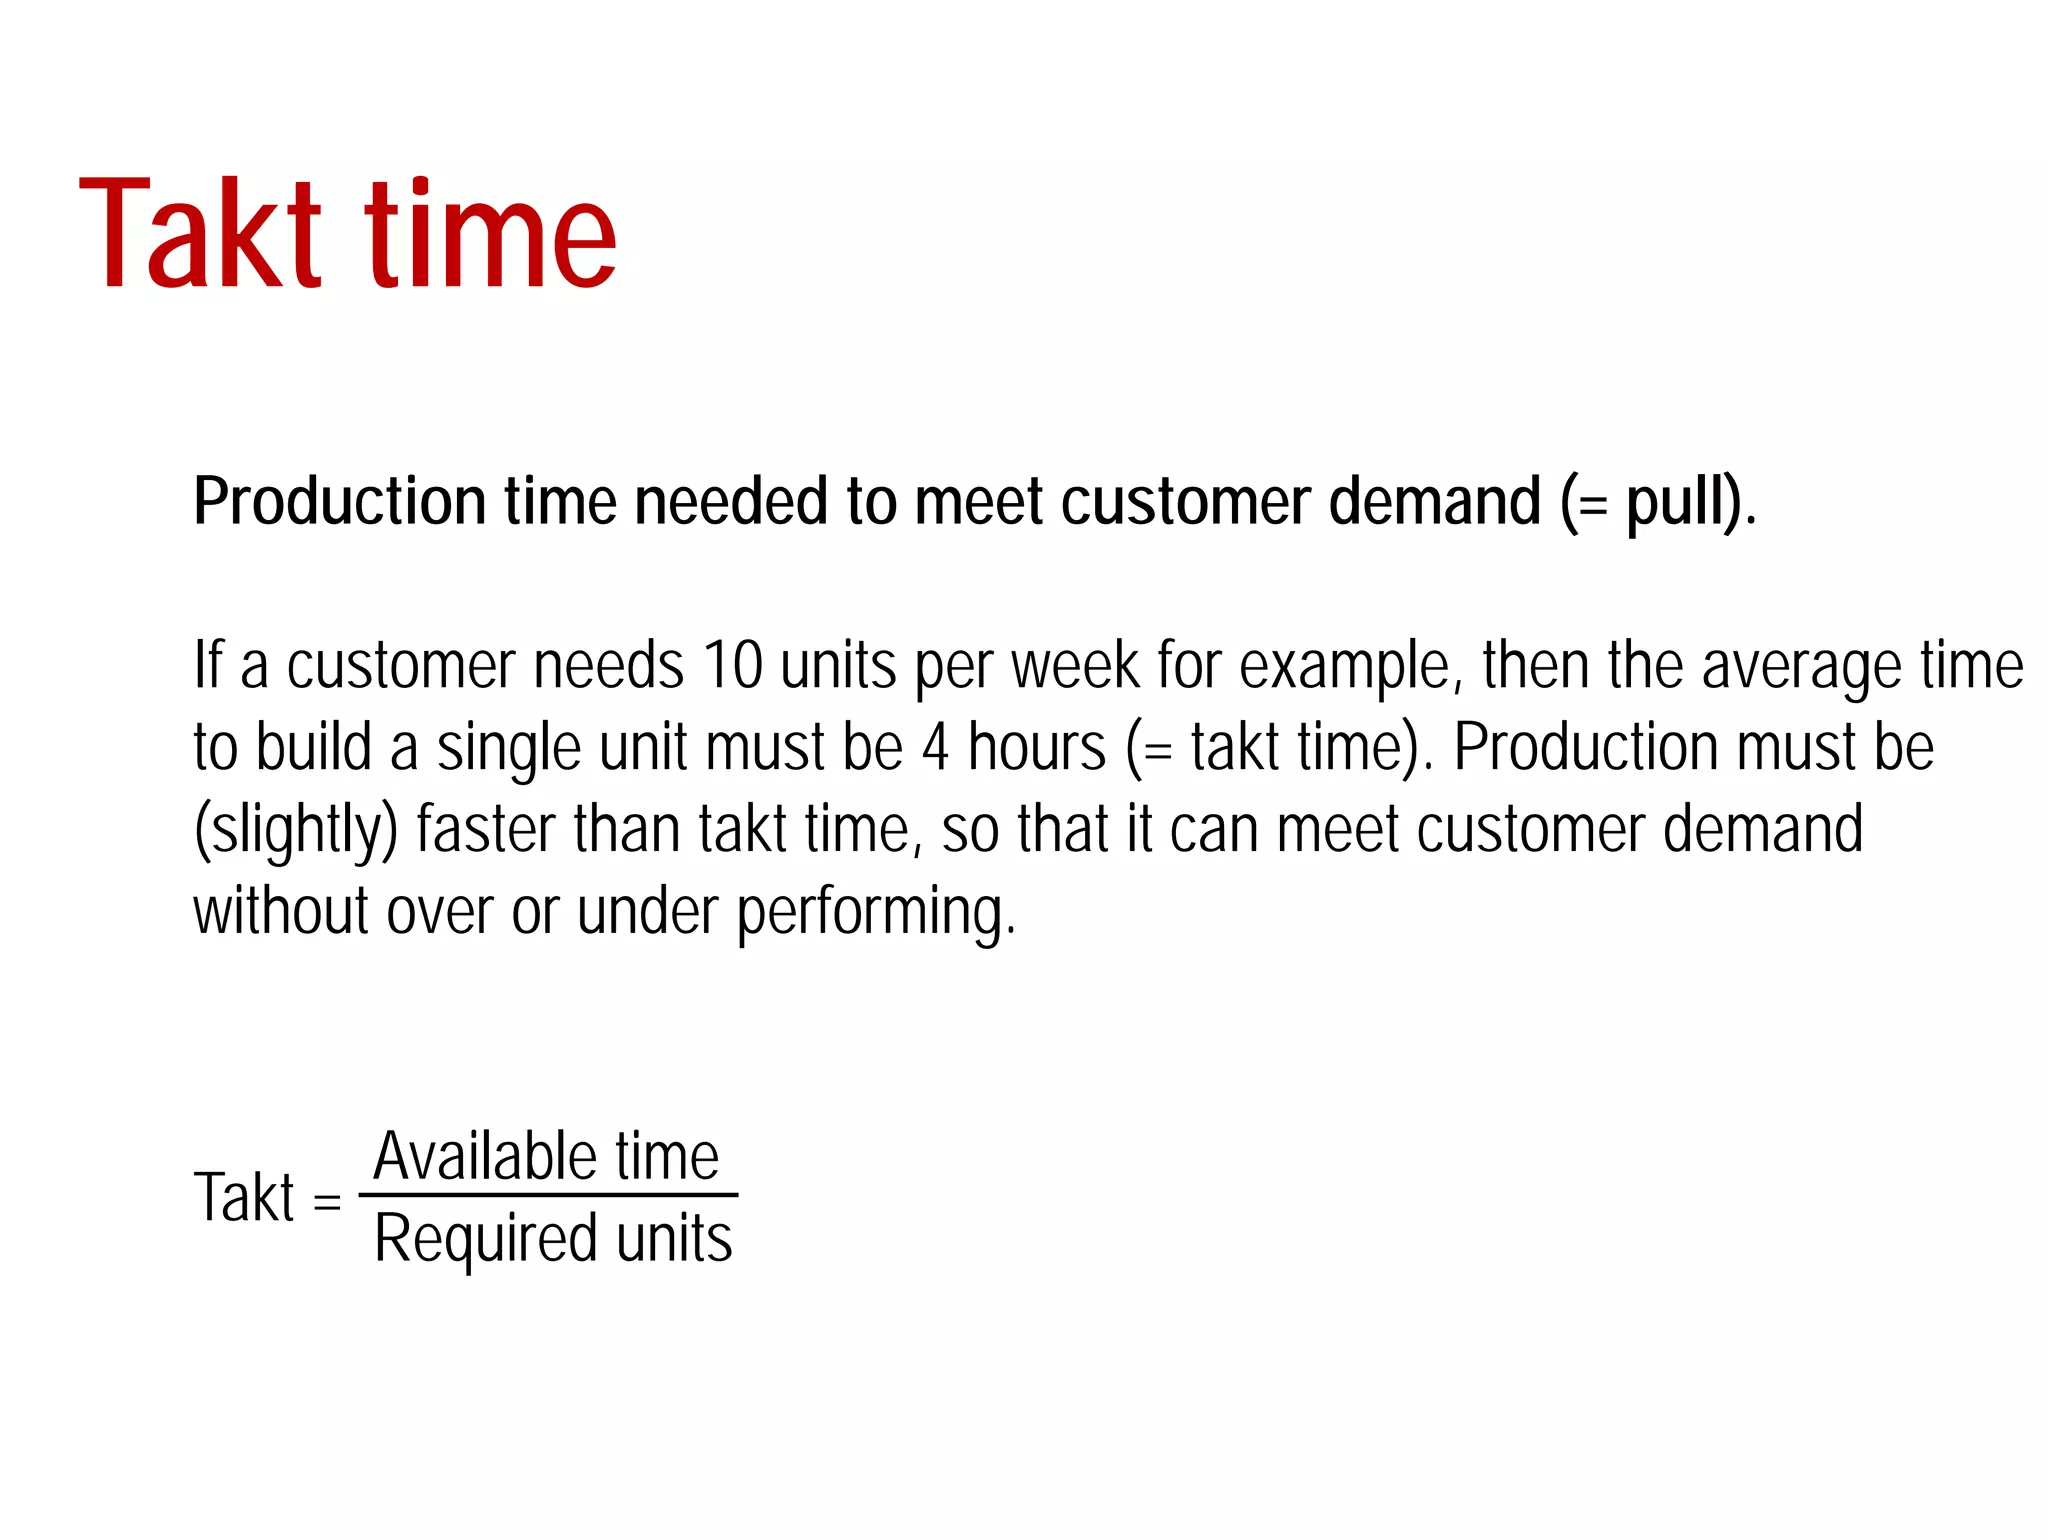
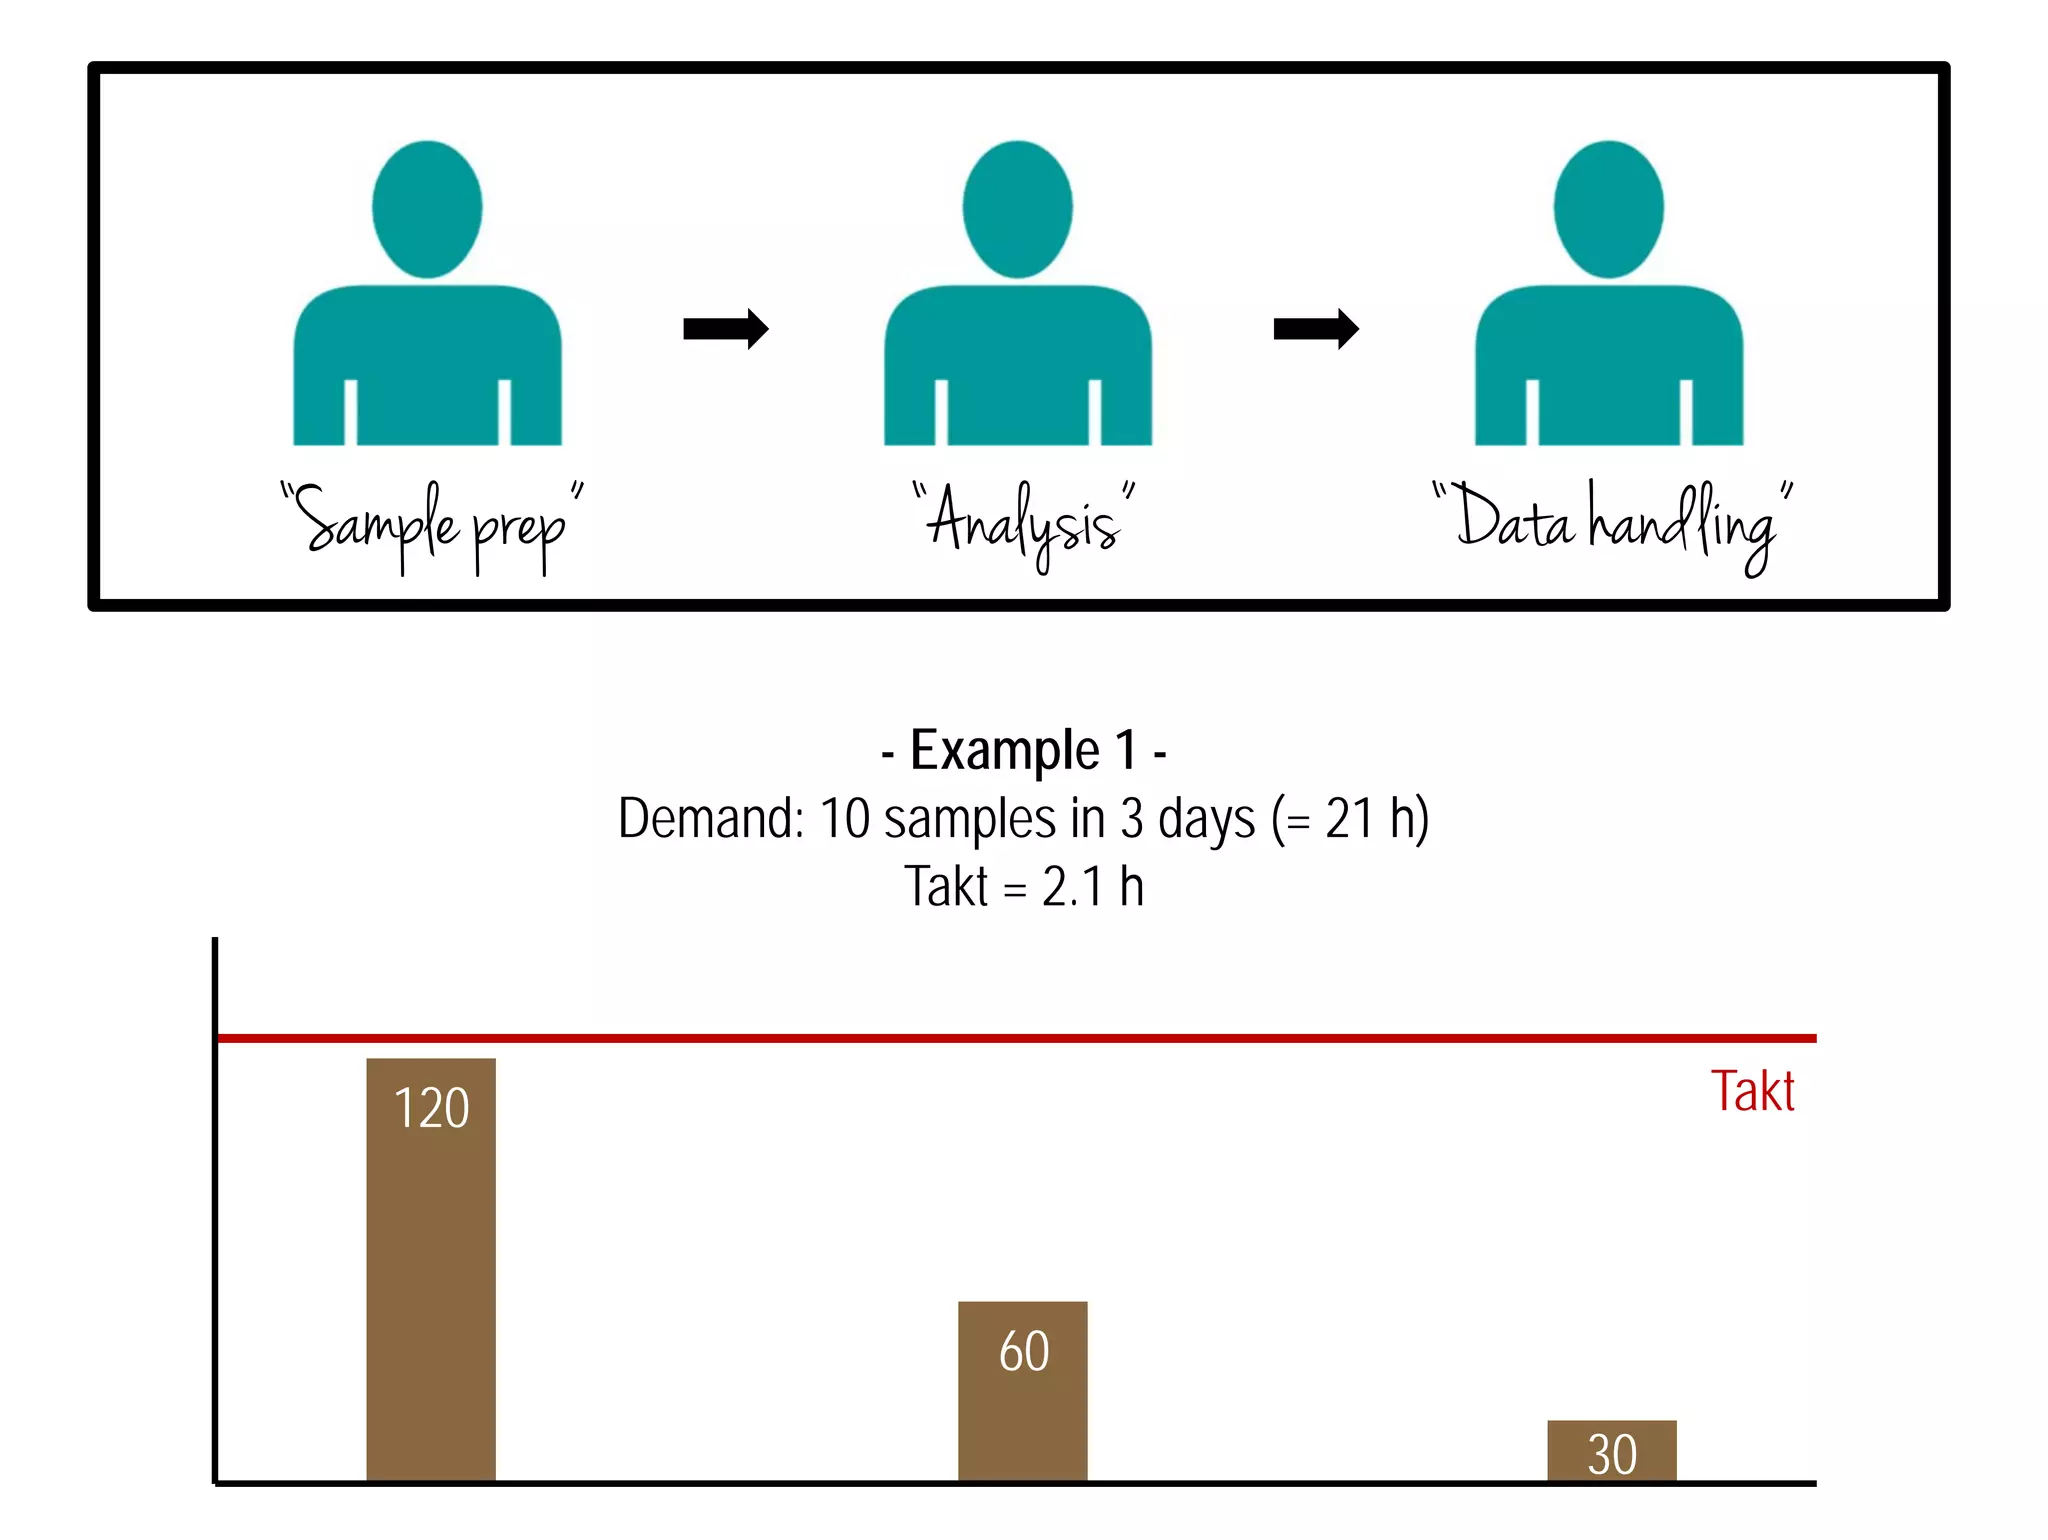
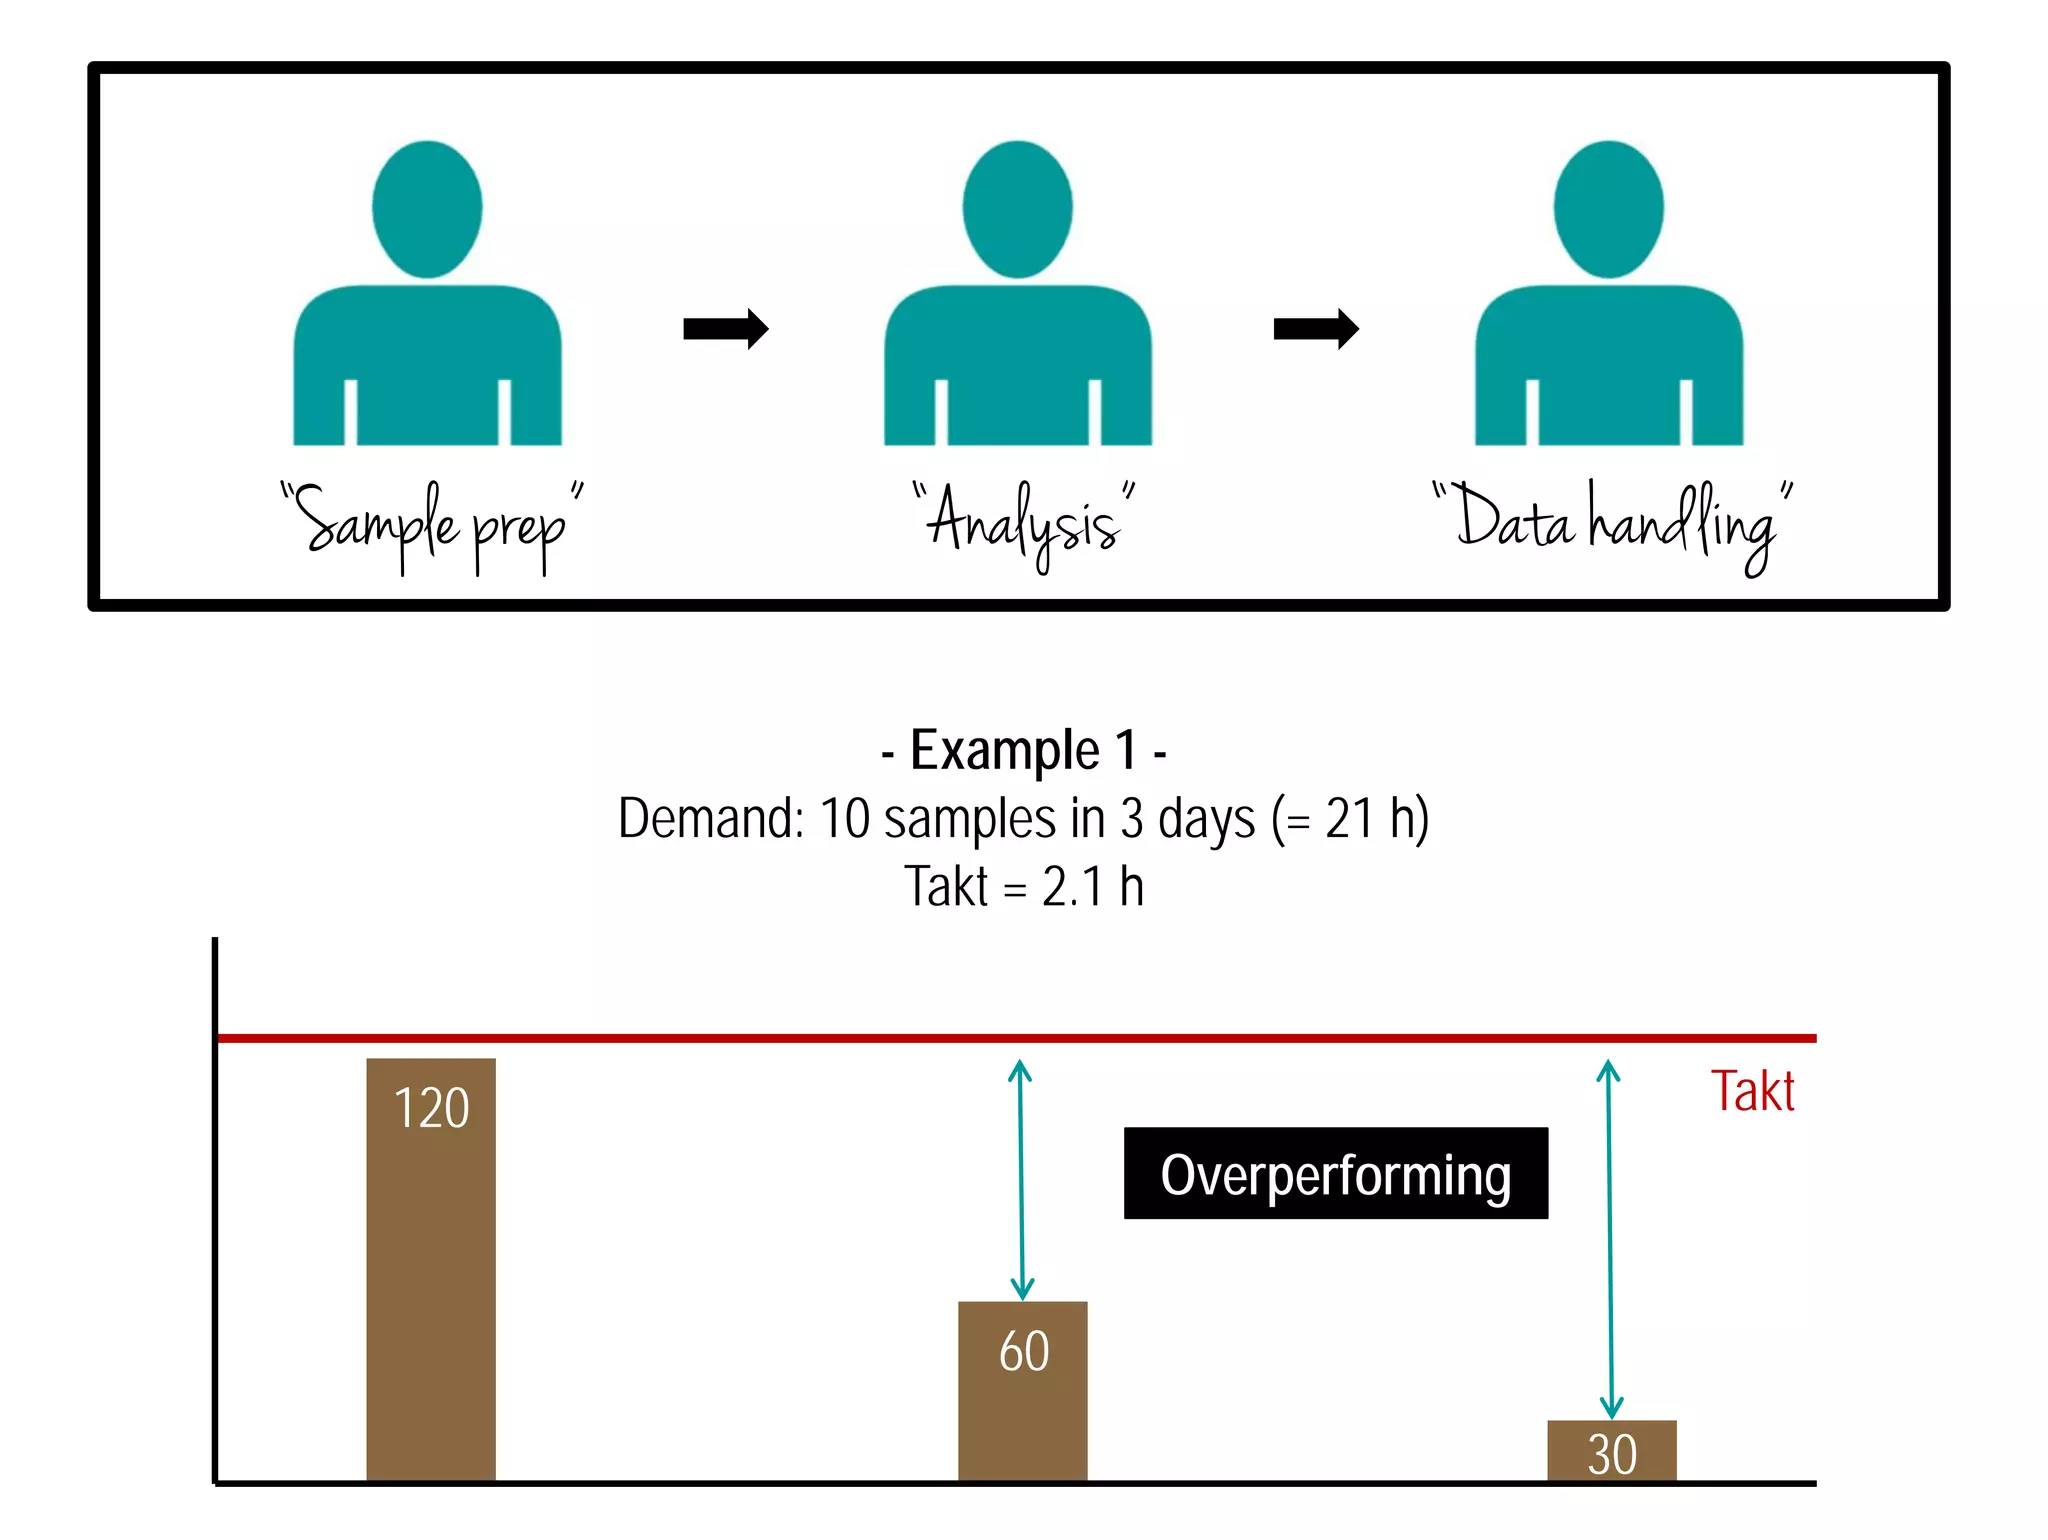
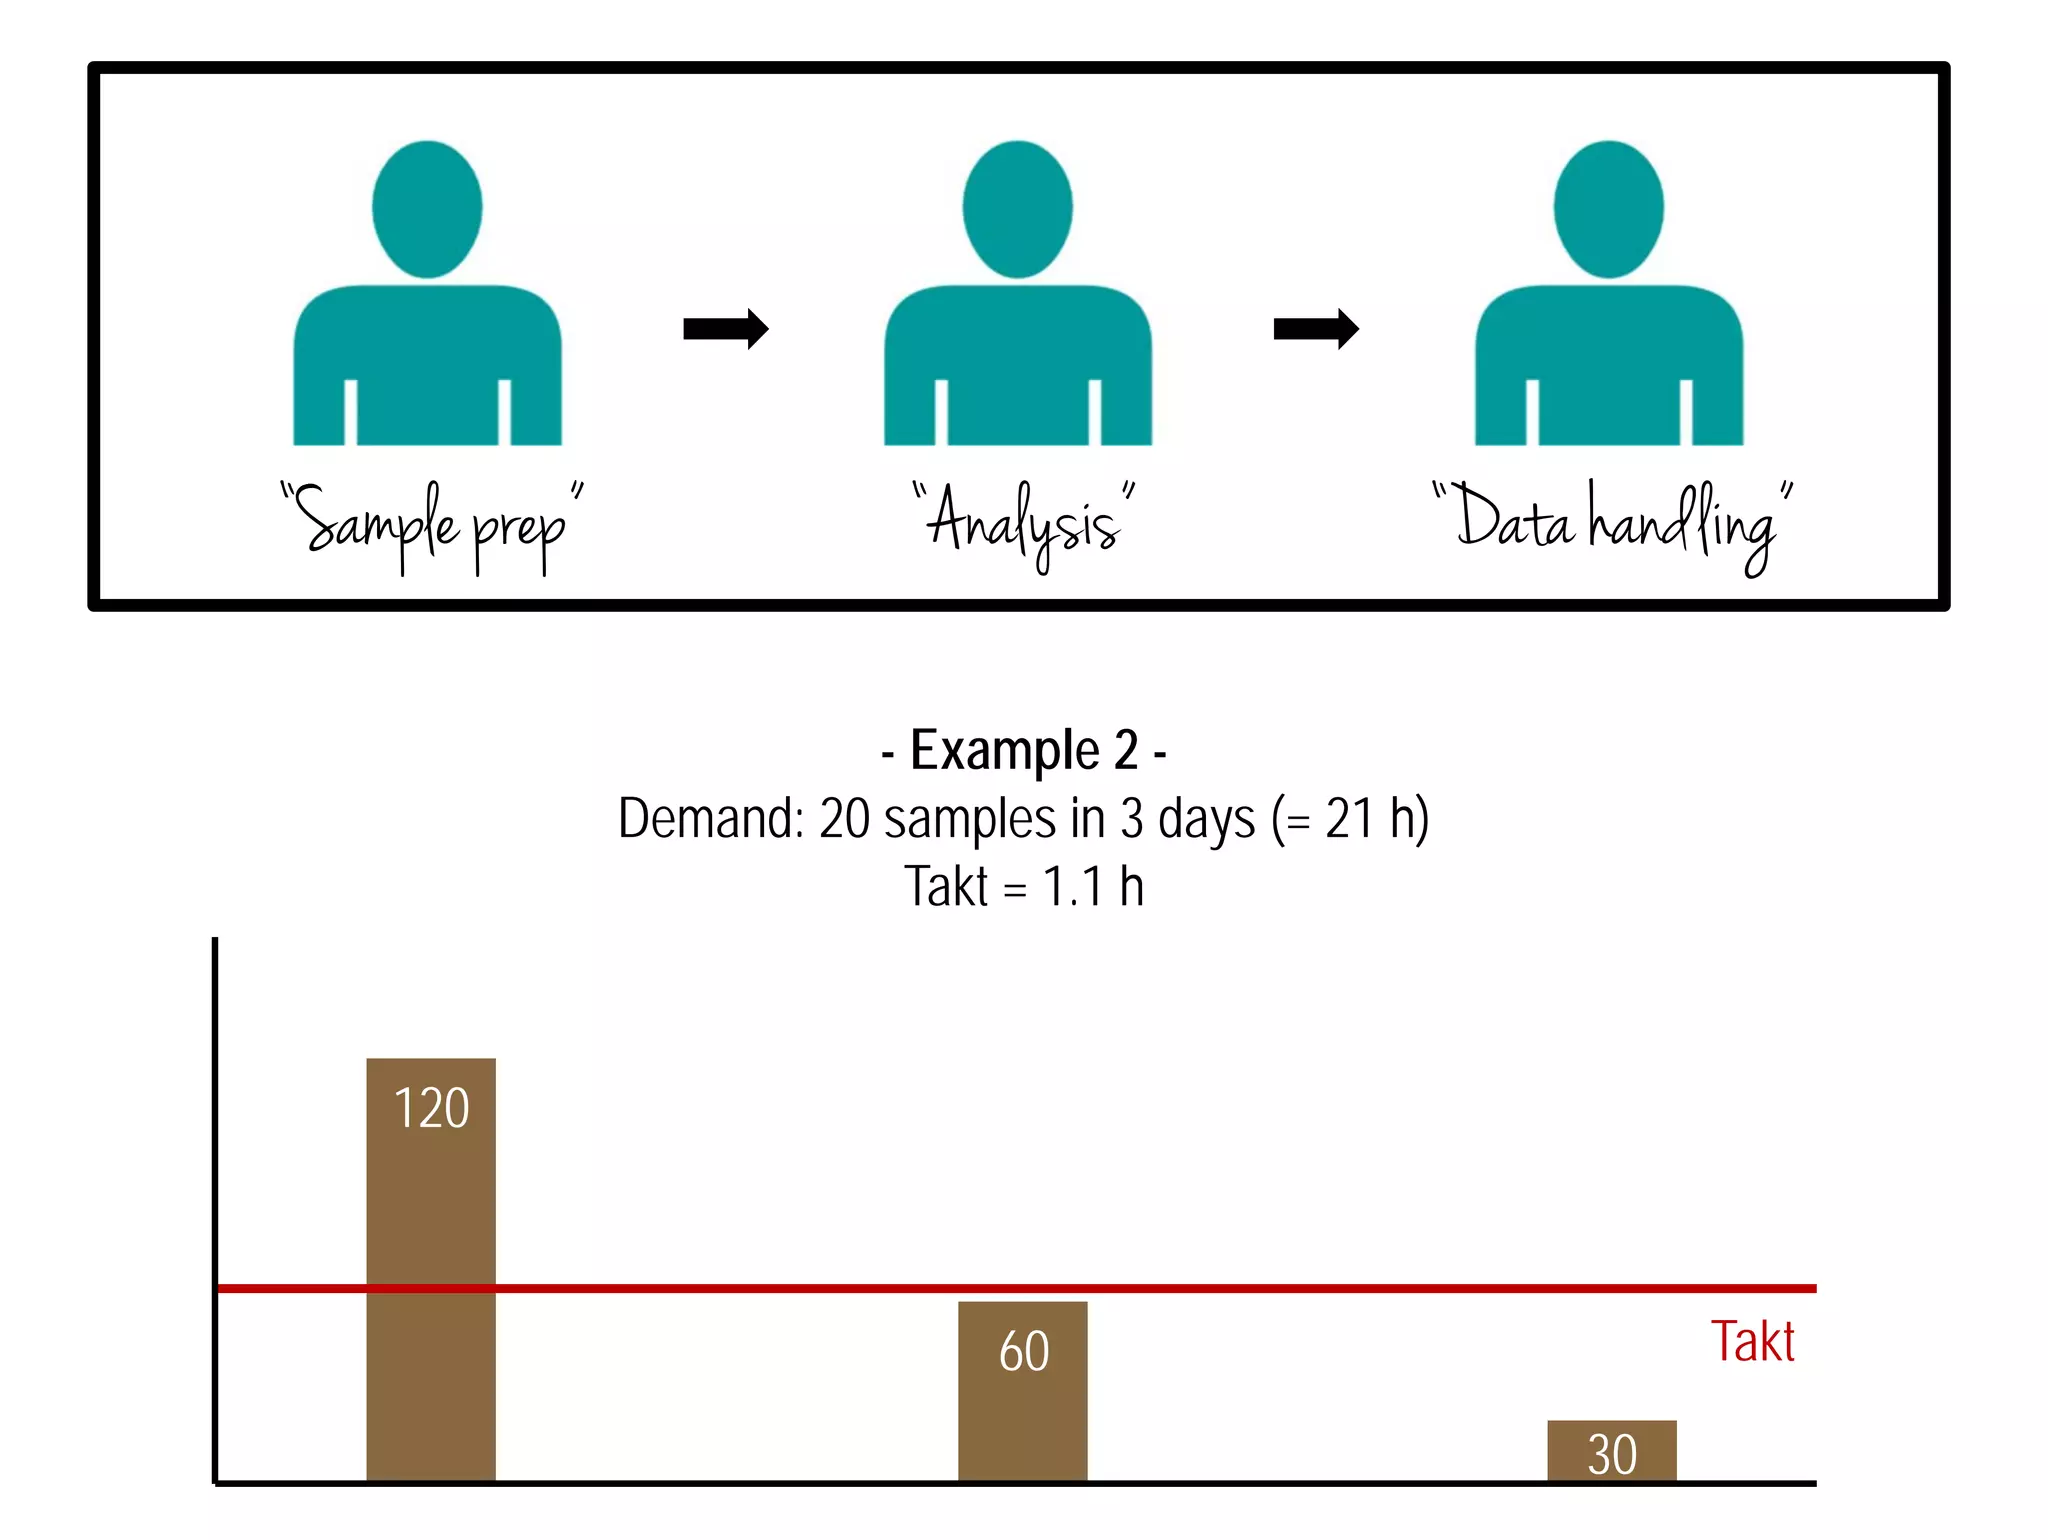
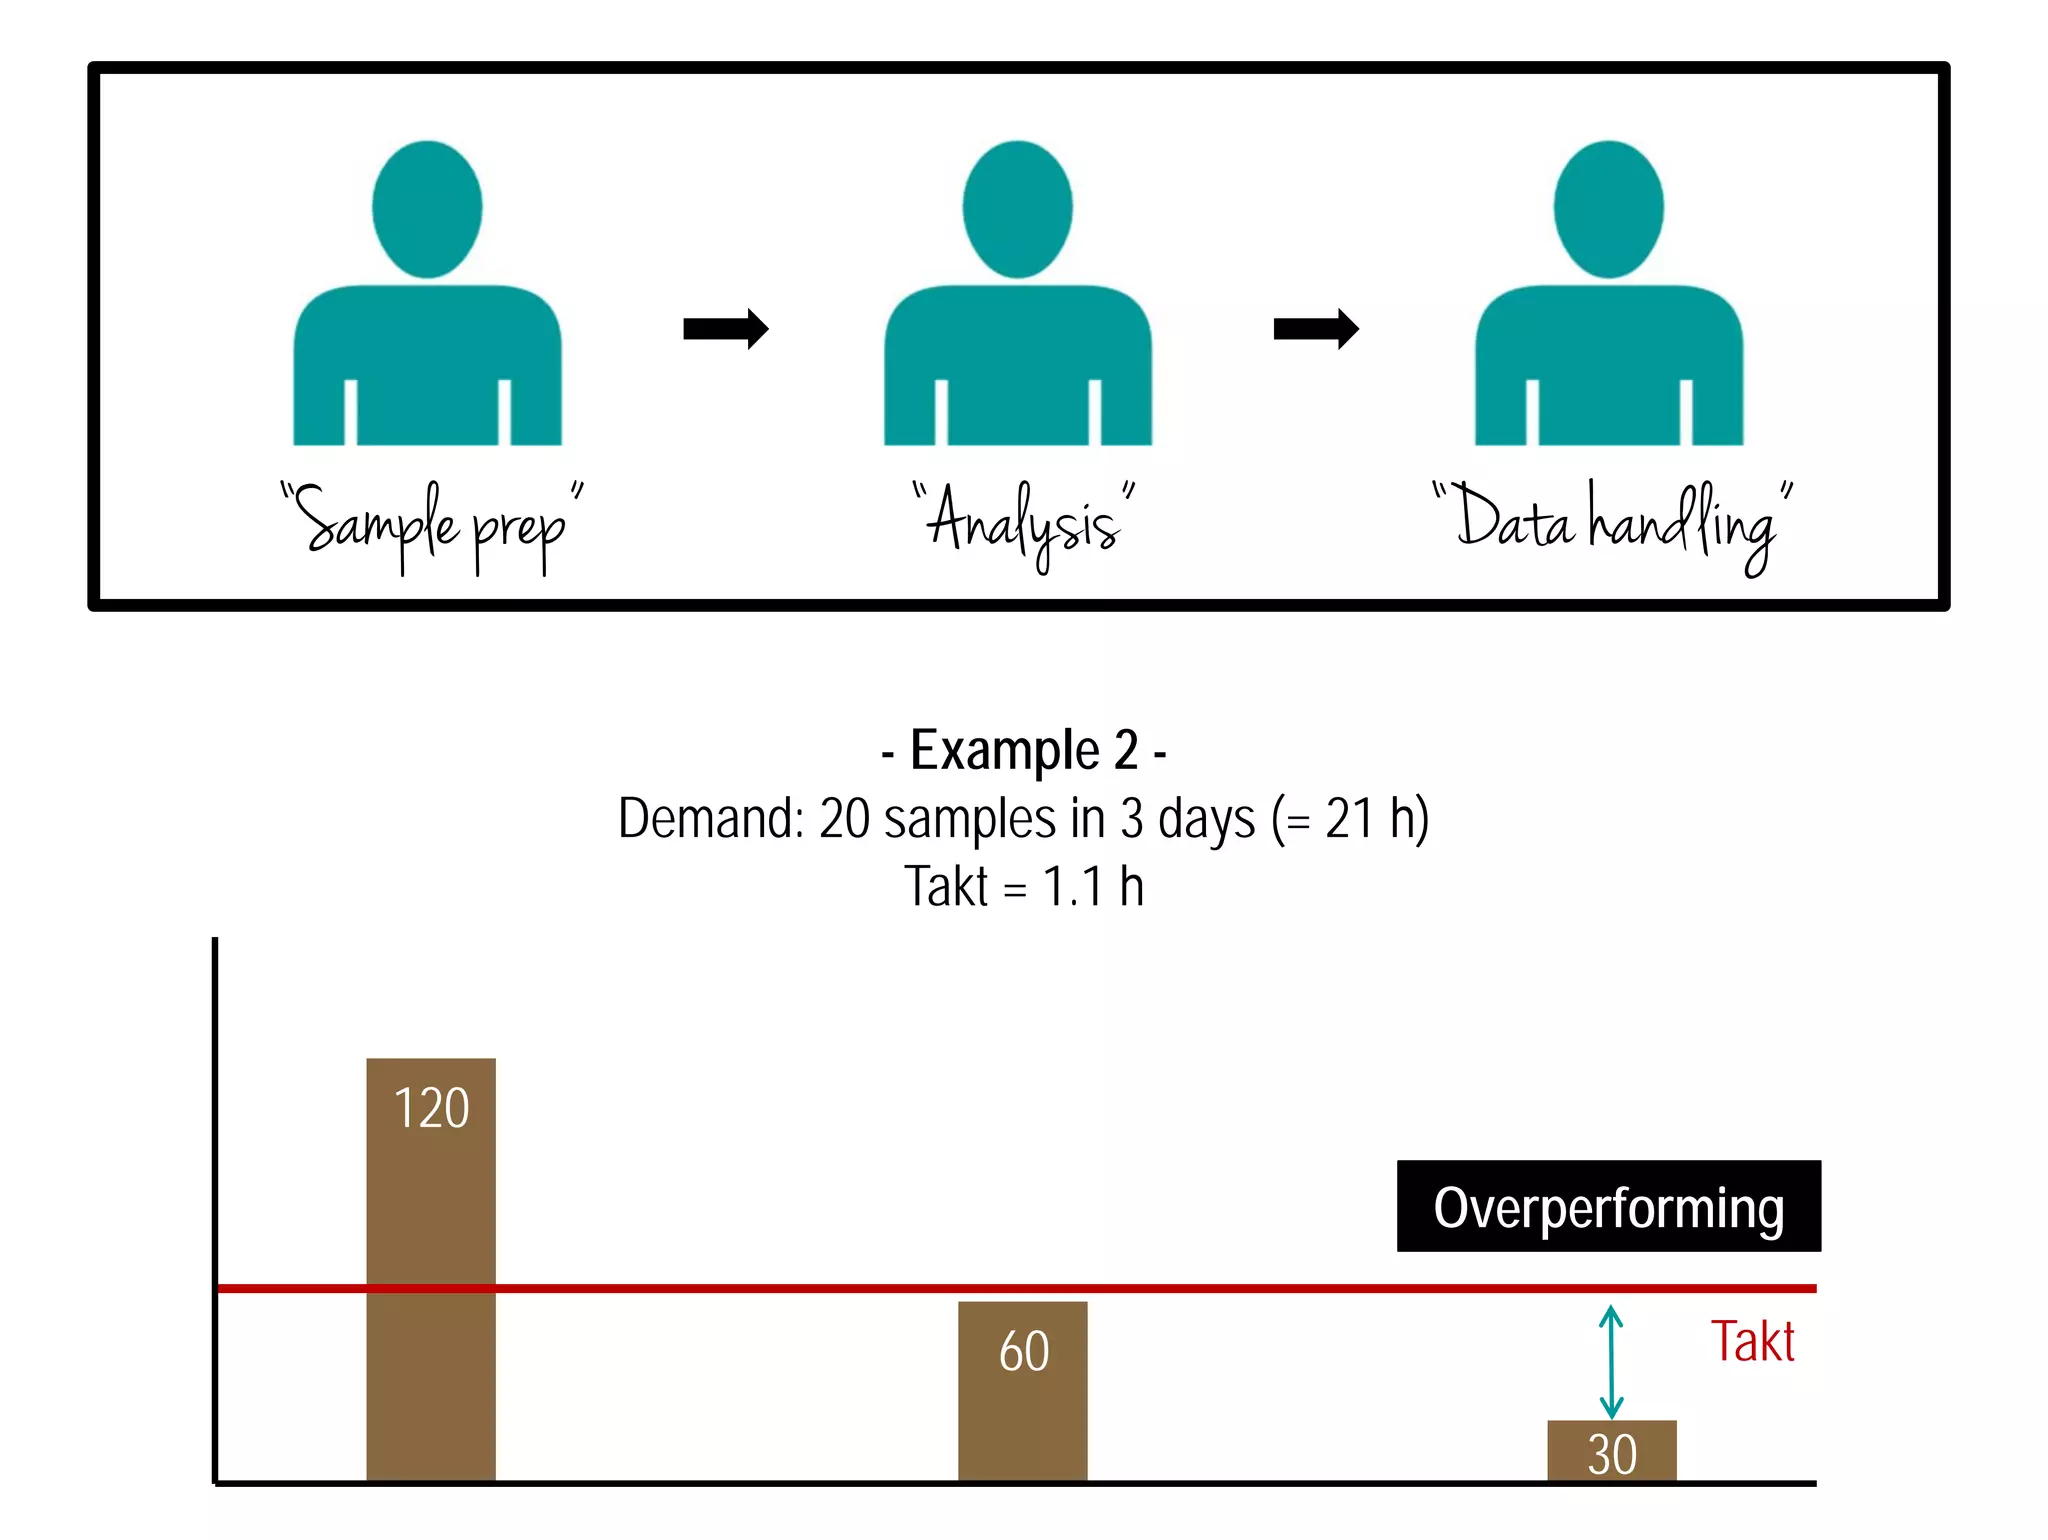
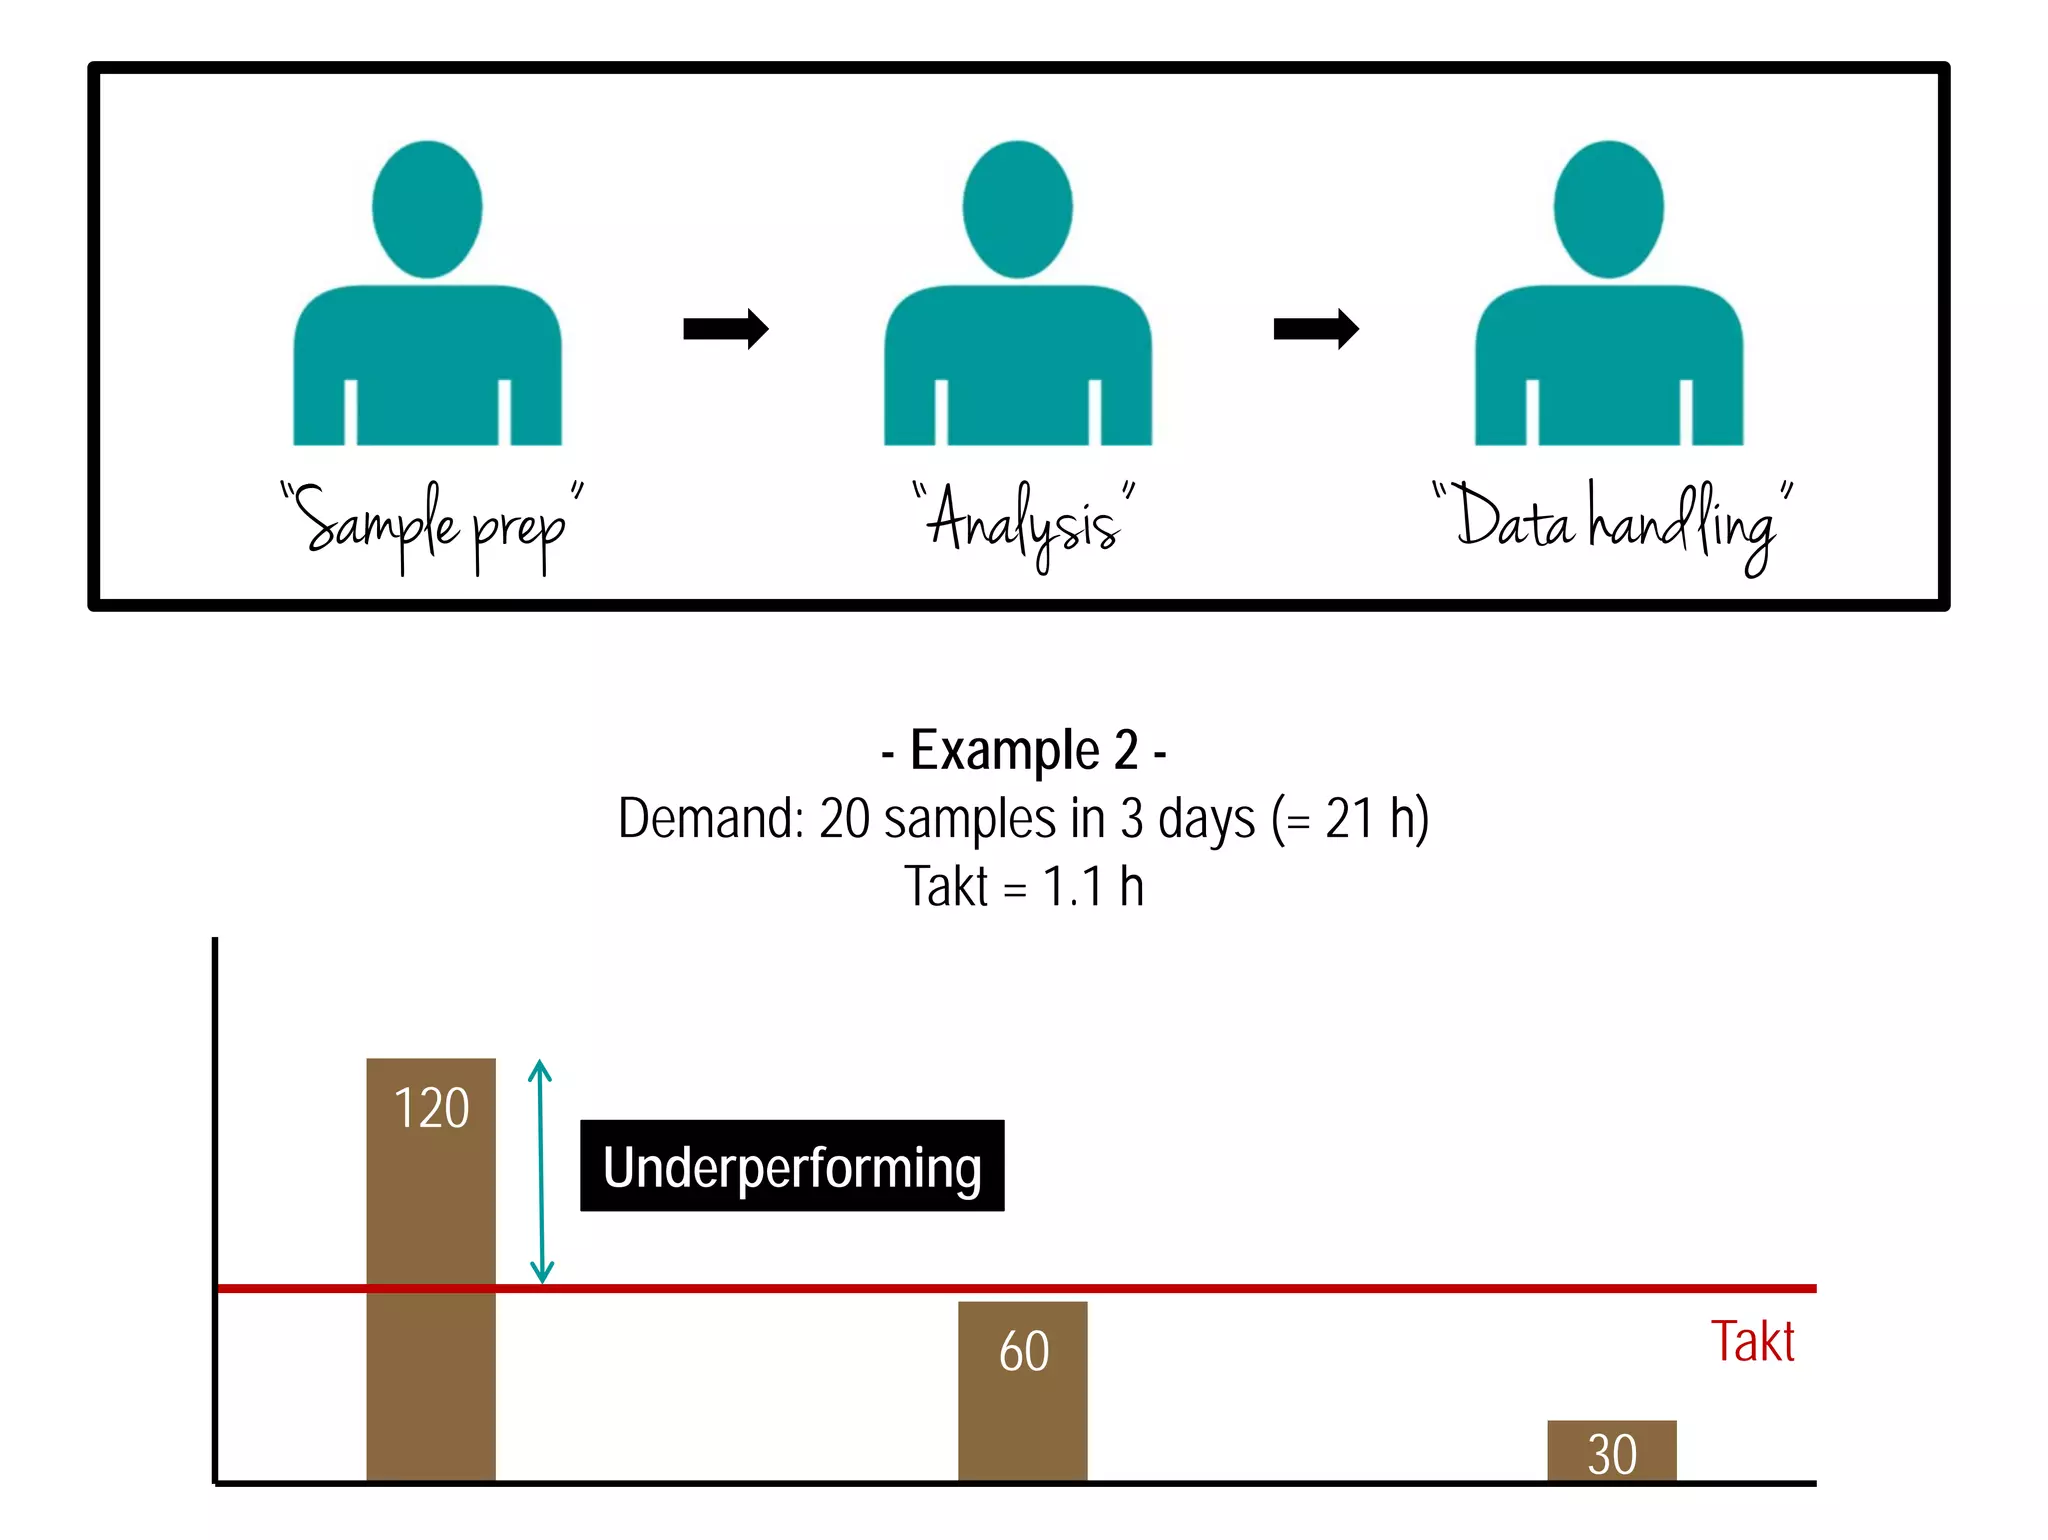
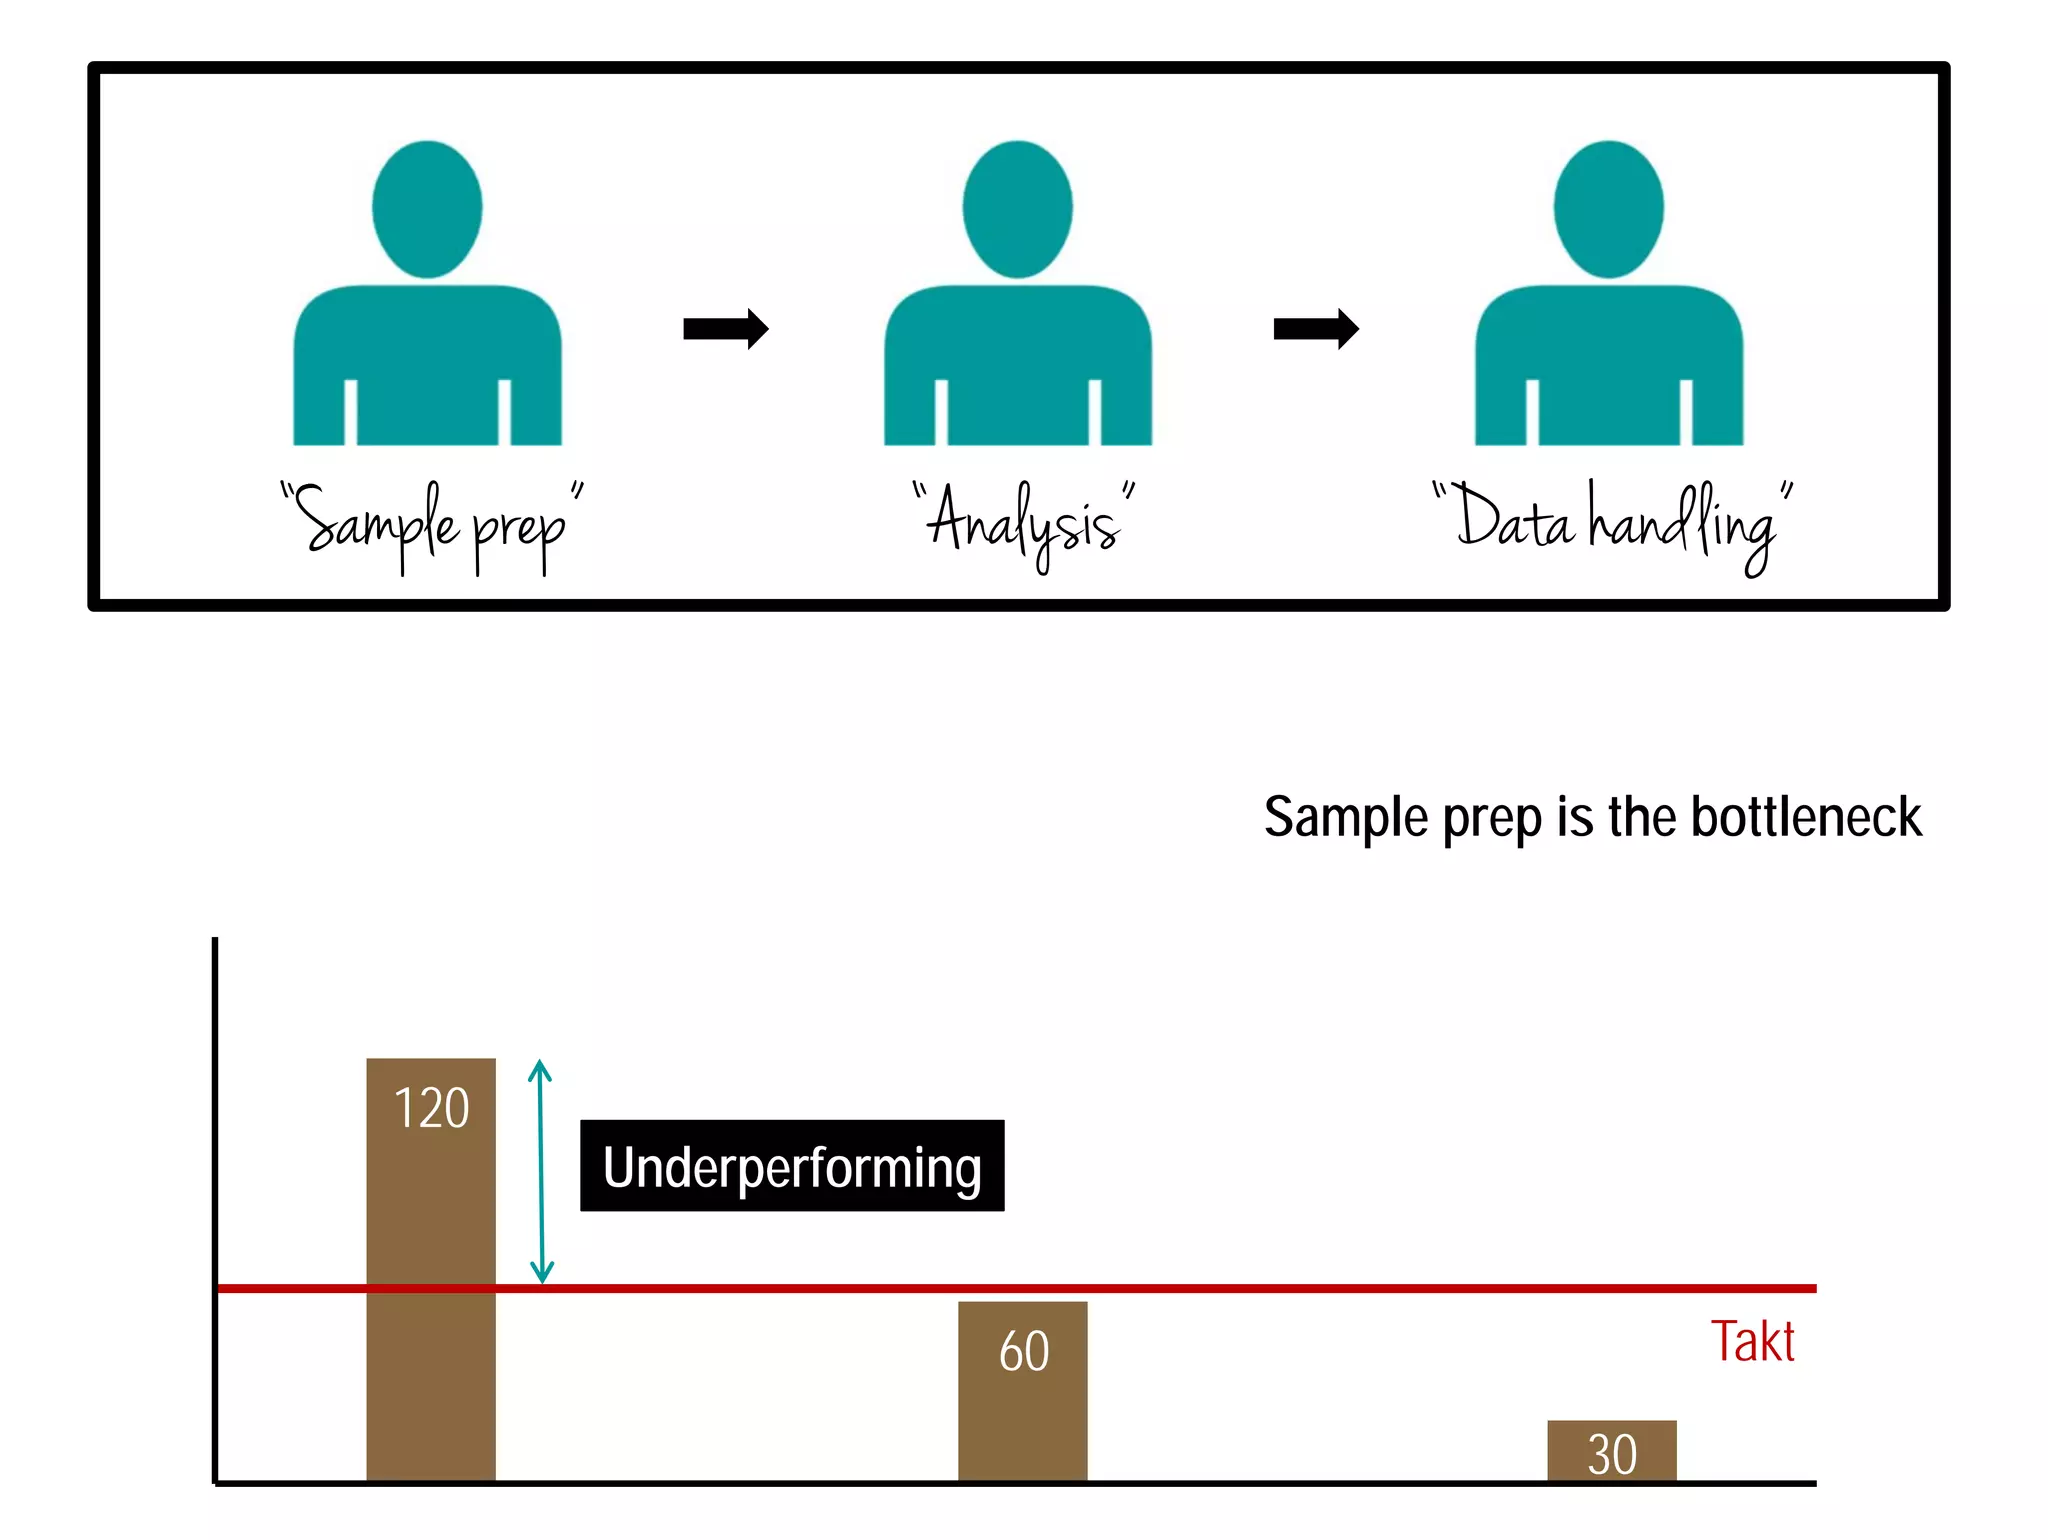
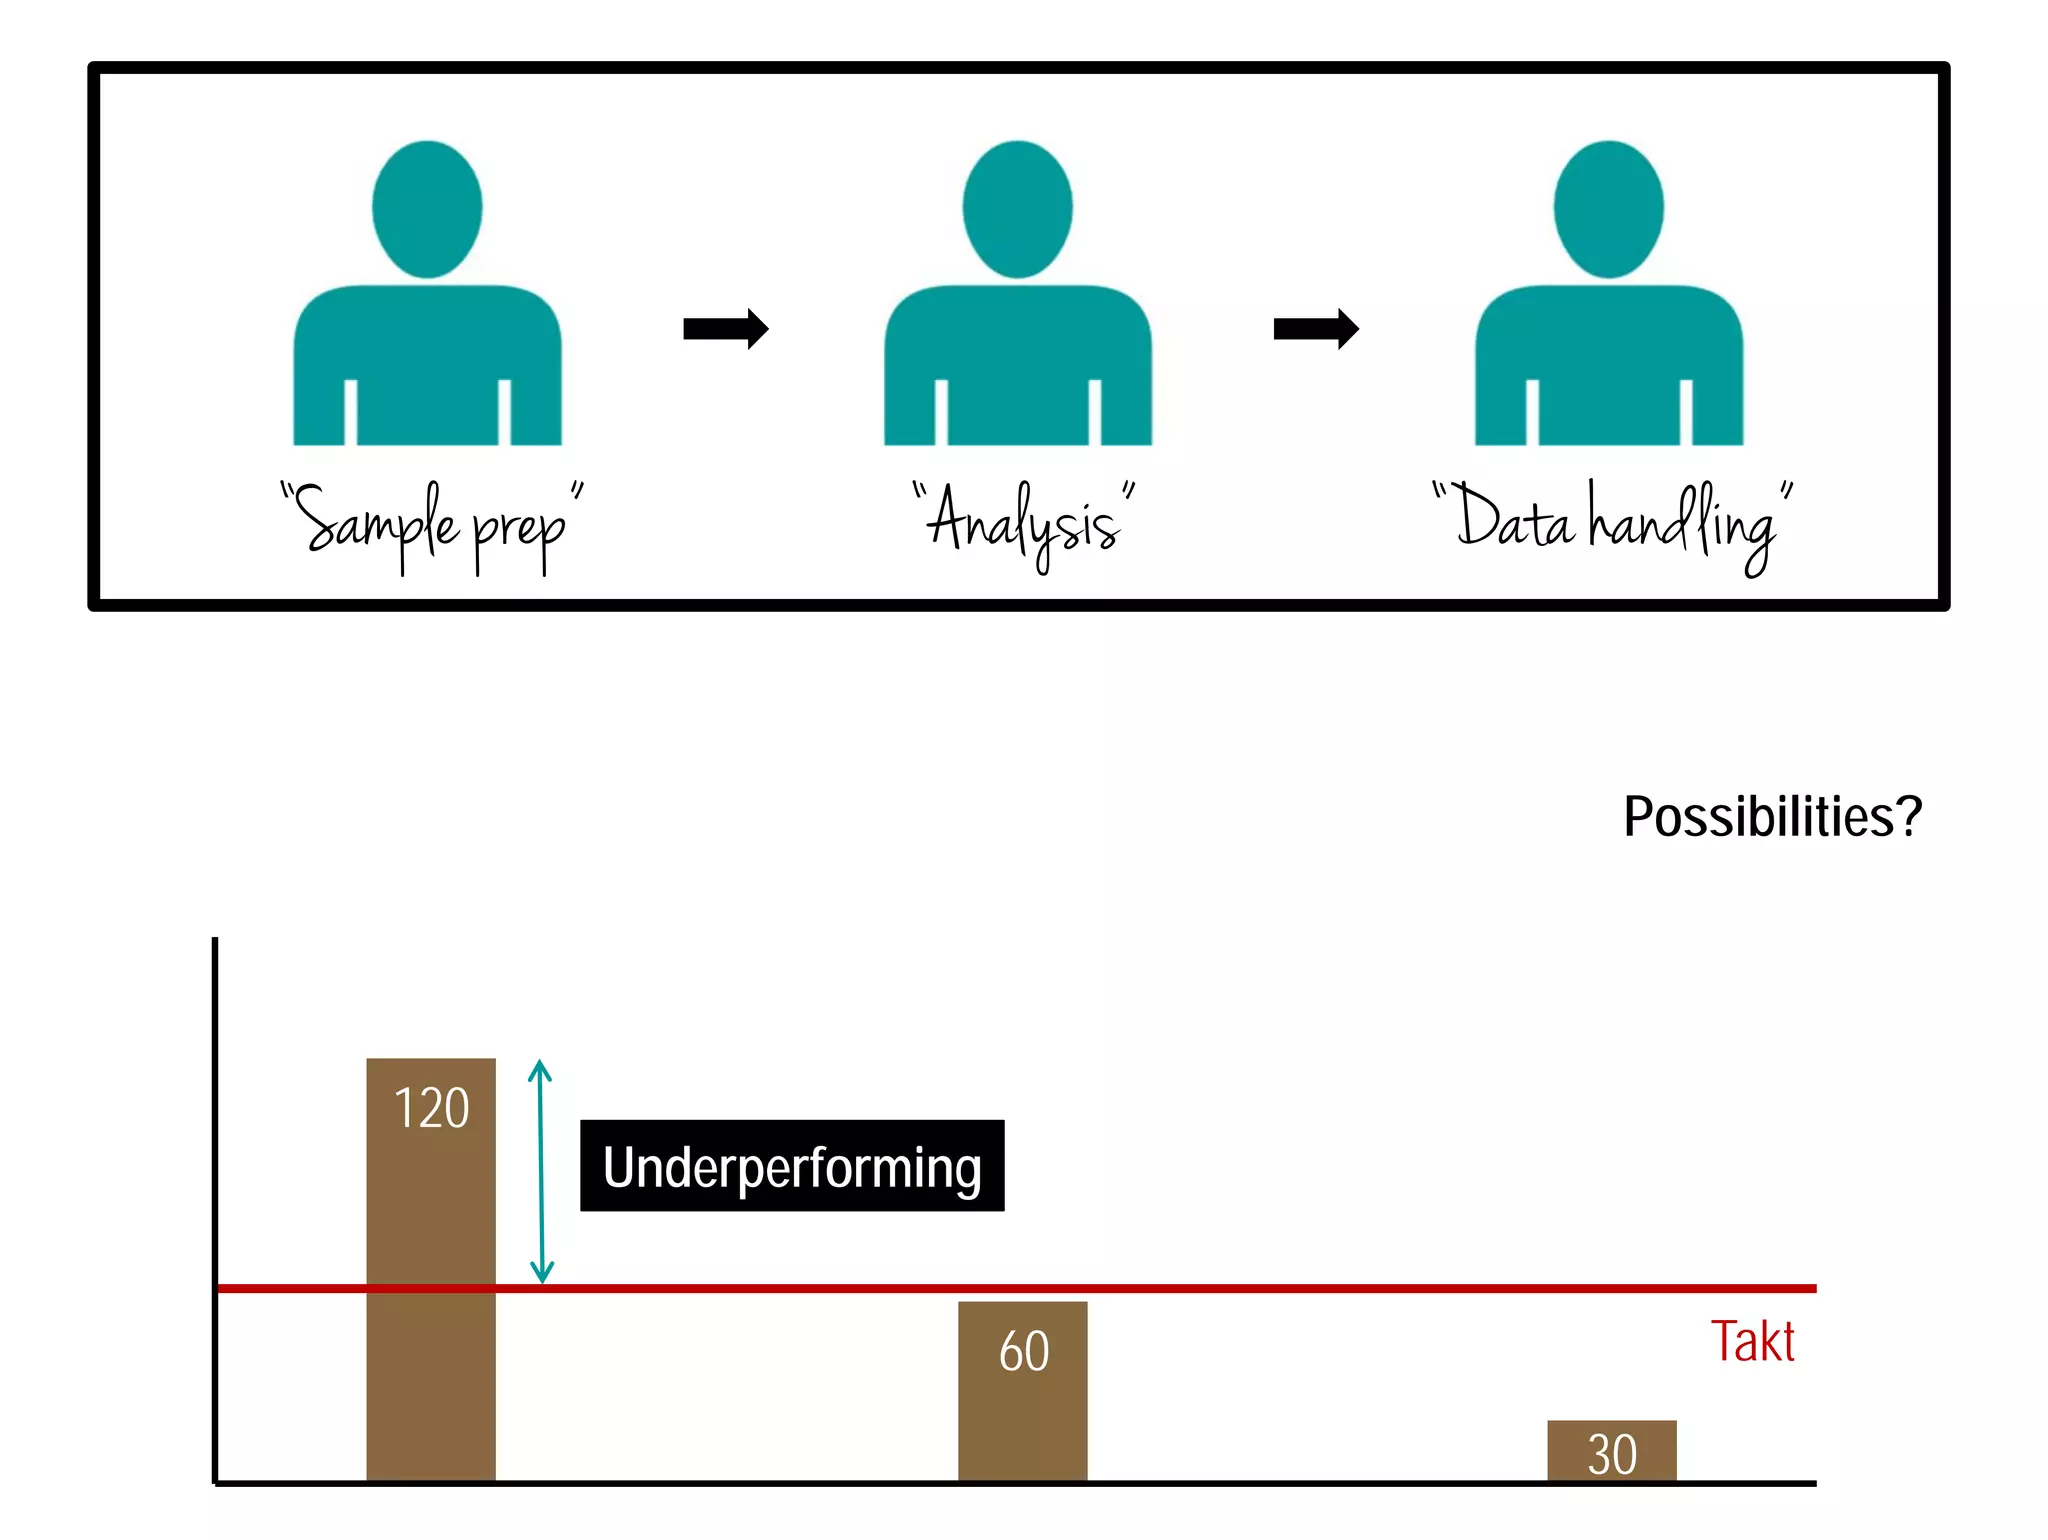
Takt time
Line balancing
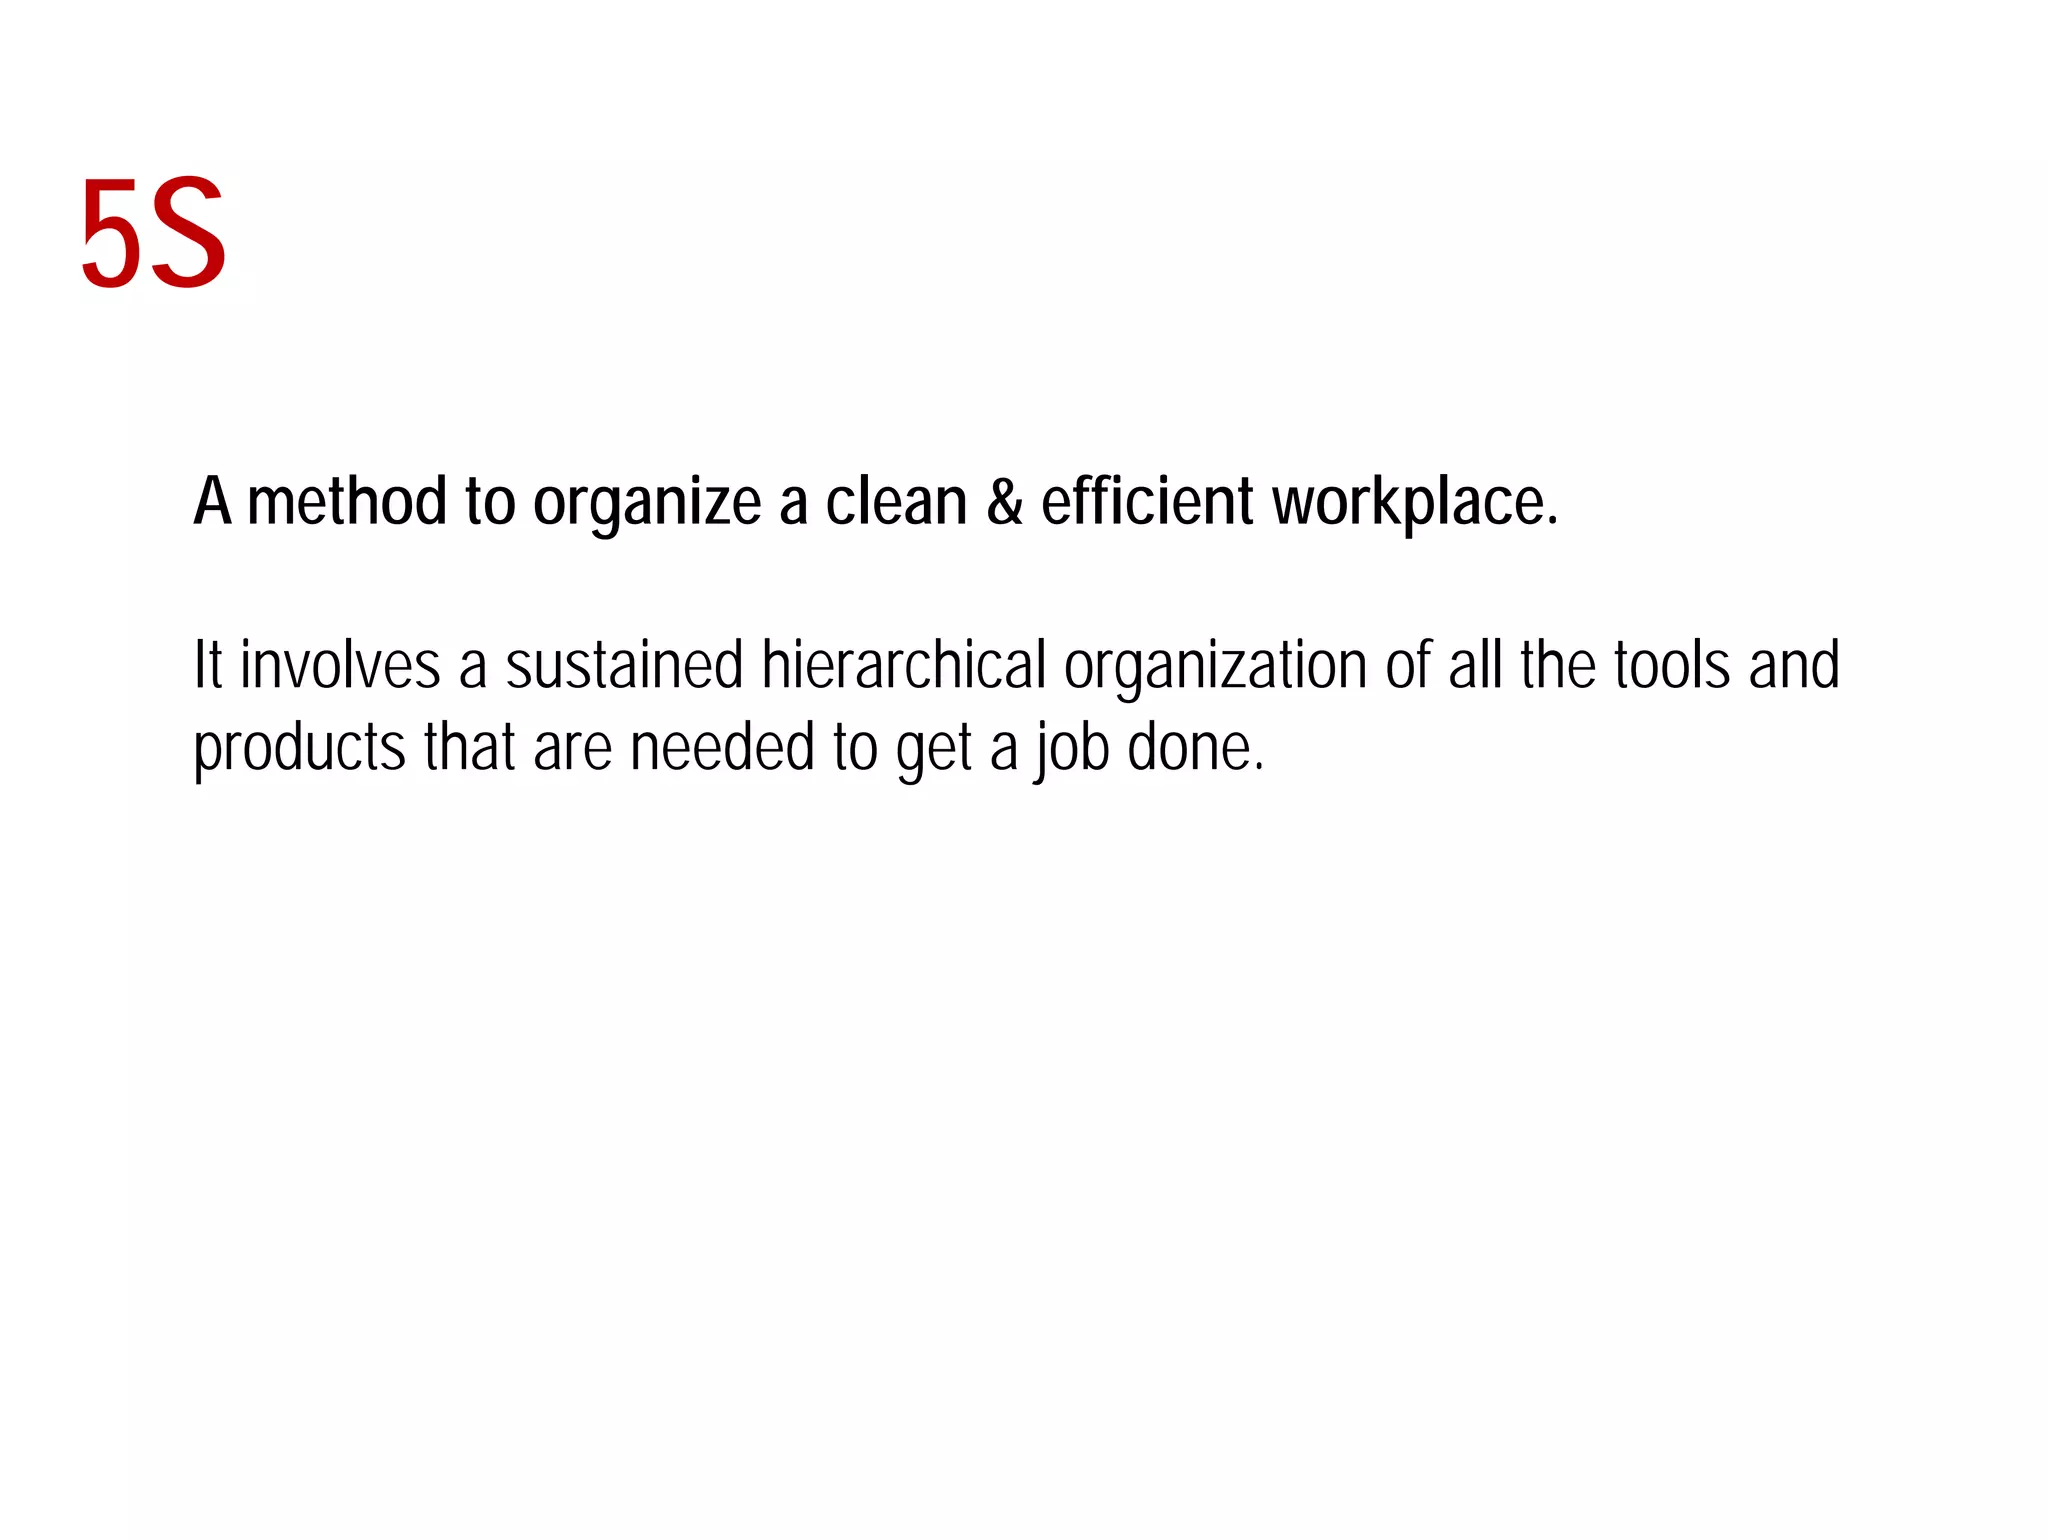
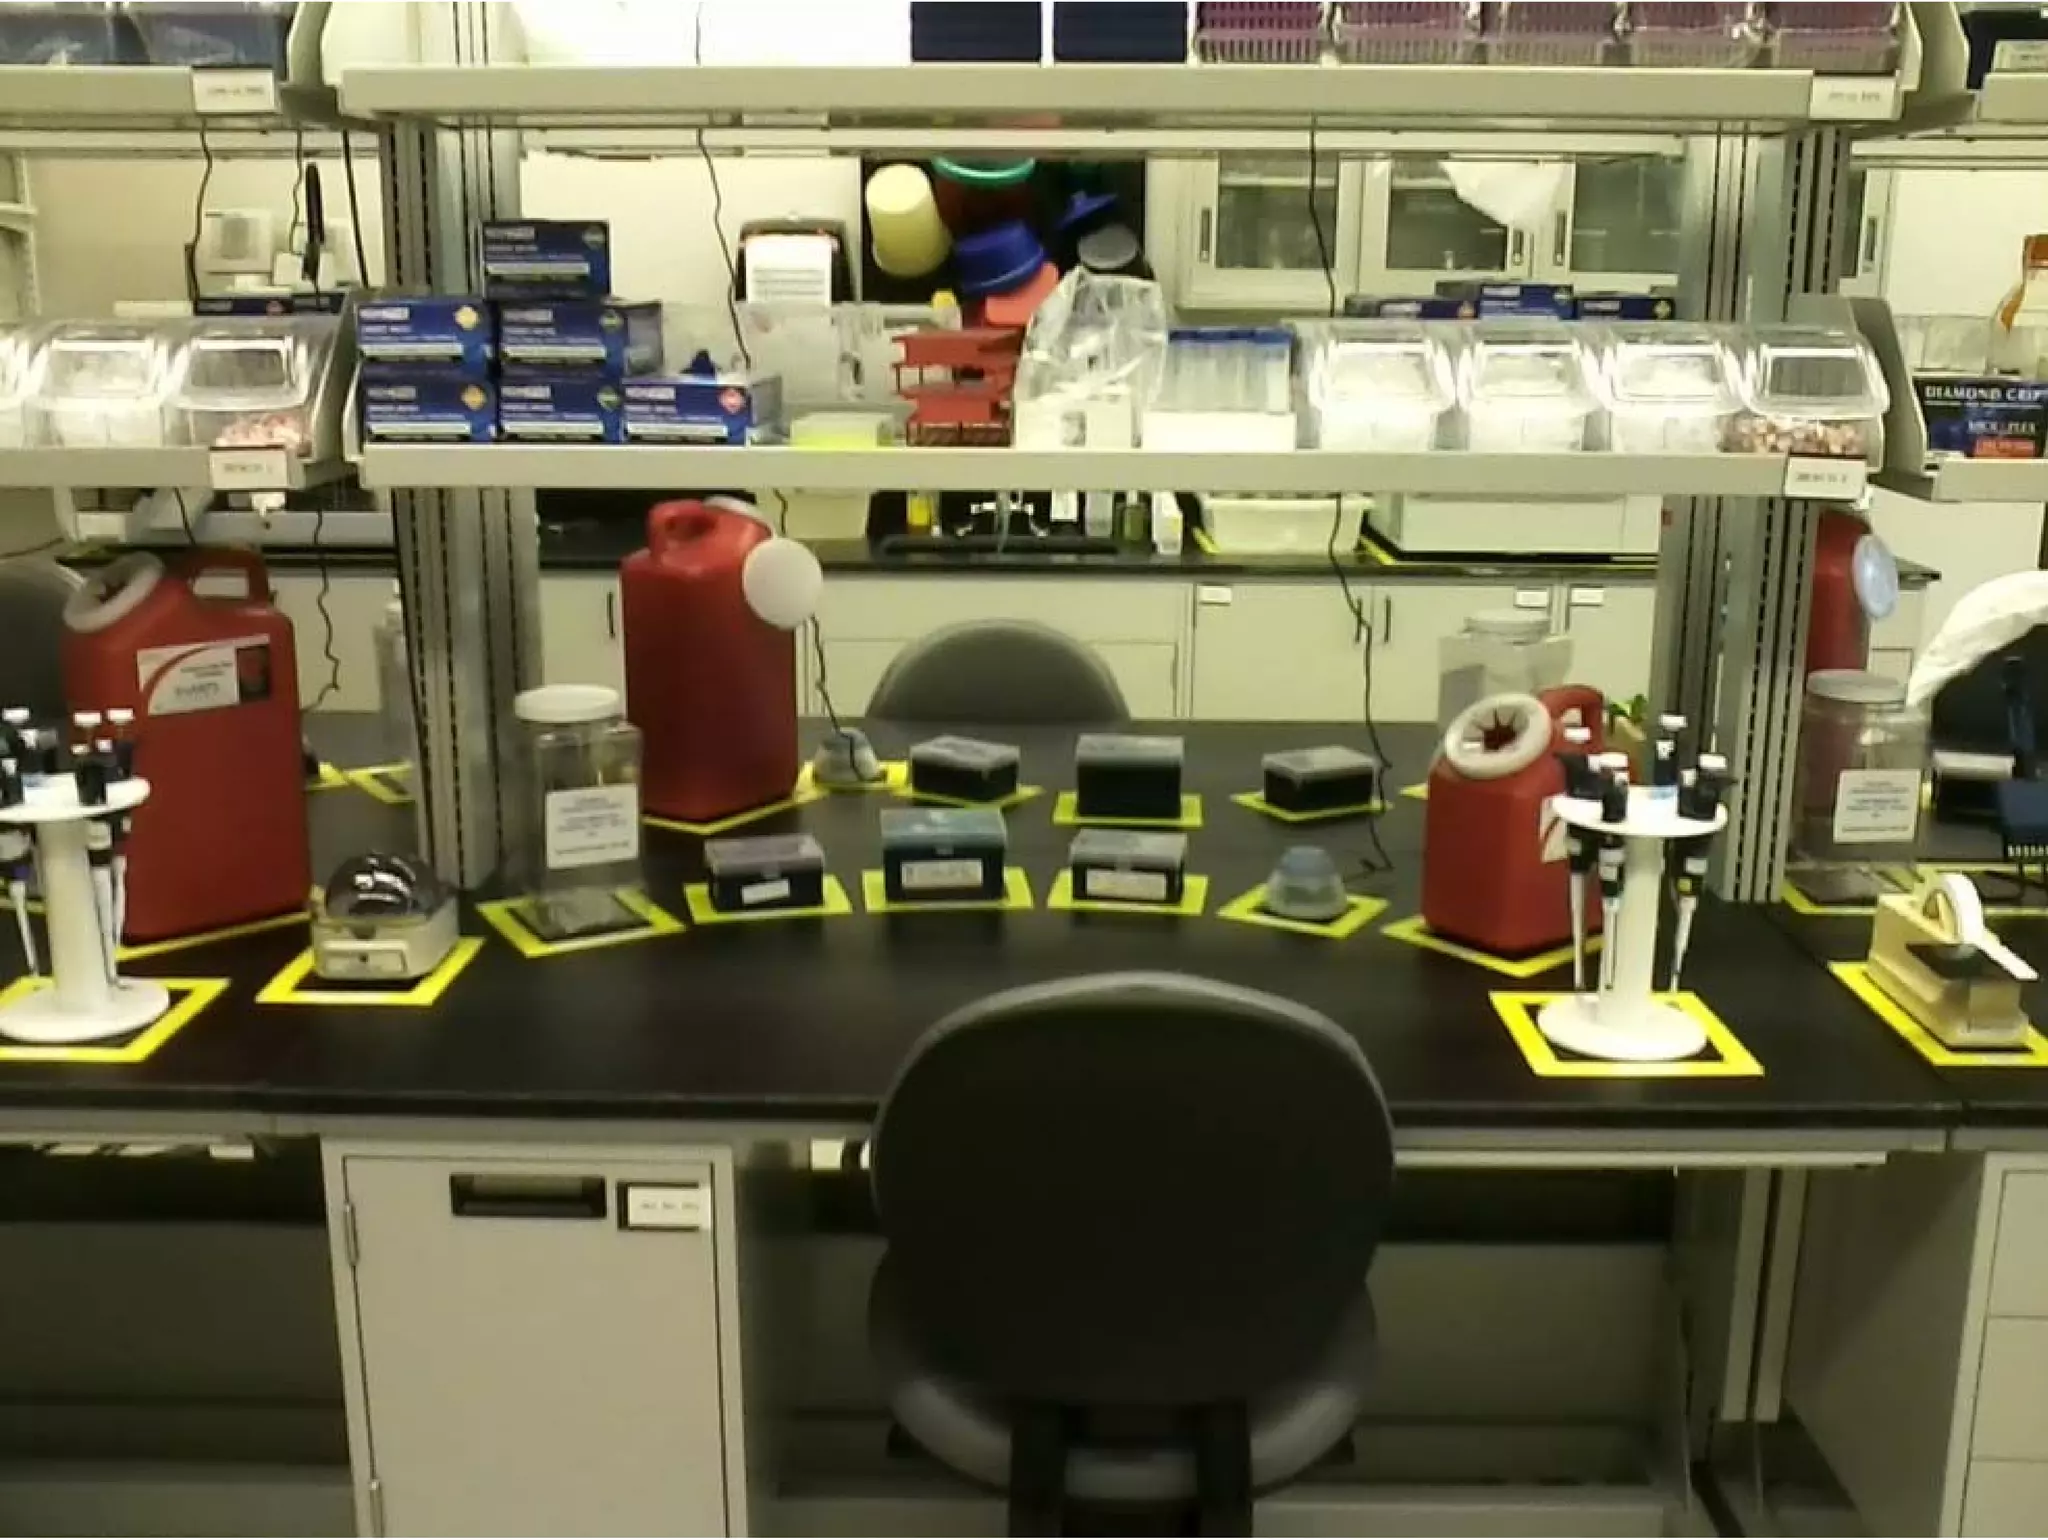
5S](https://image.slidesharecdn.com/leanthinkinginresearch-140612083945-phpapp02/75/Lean-innovation-Basic-principles-of-Lean-41-2048.jpg)
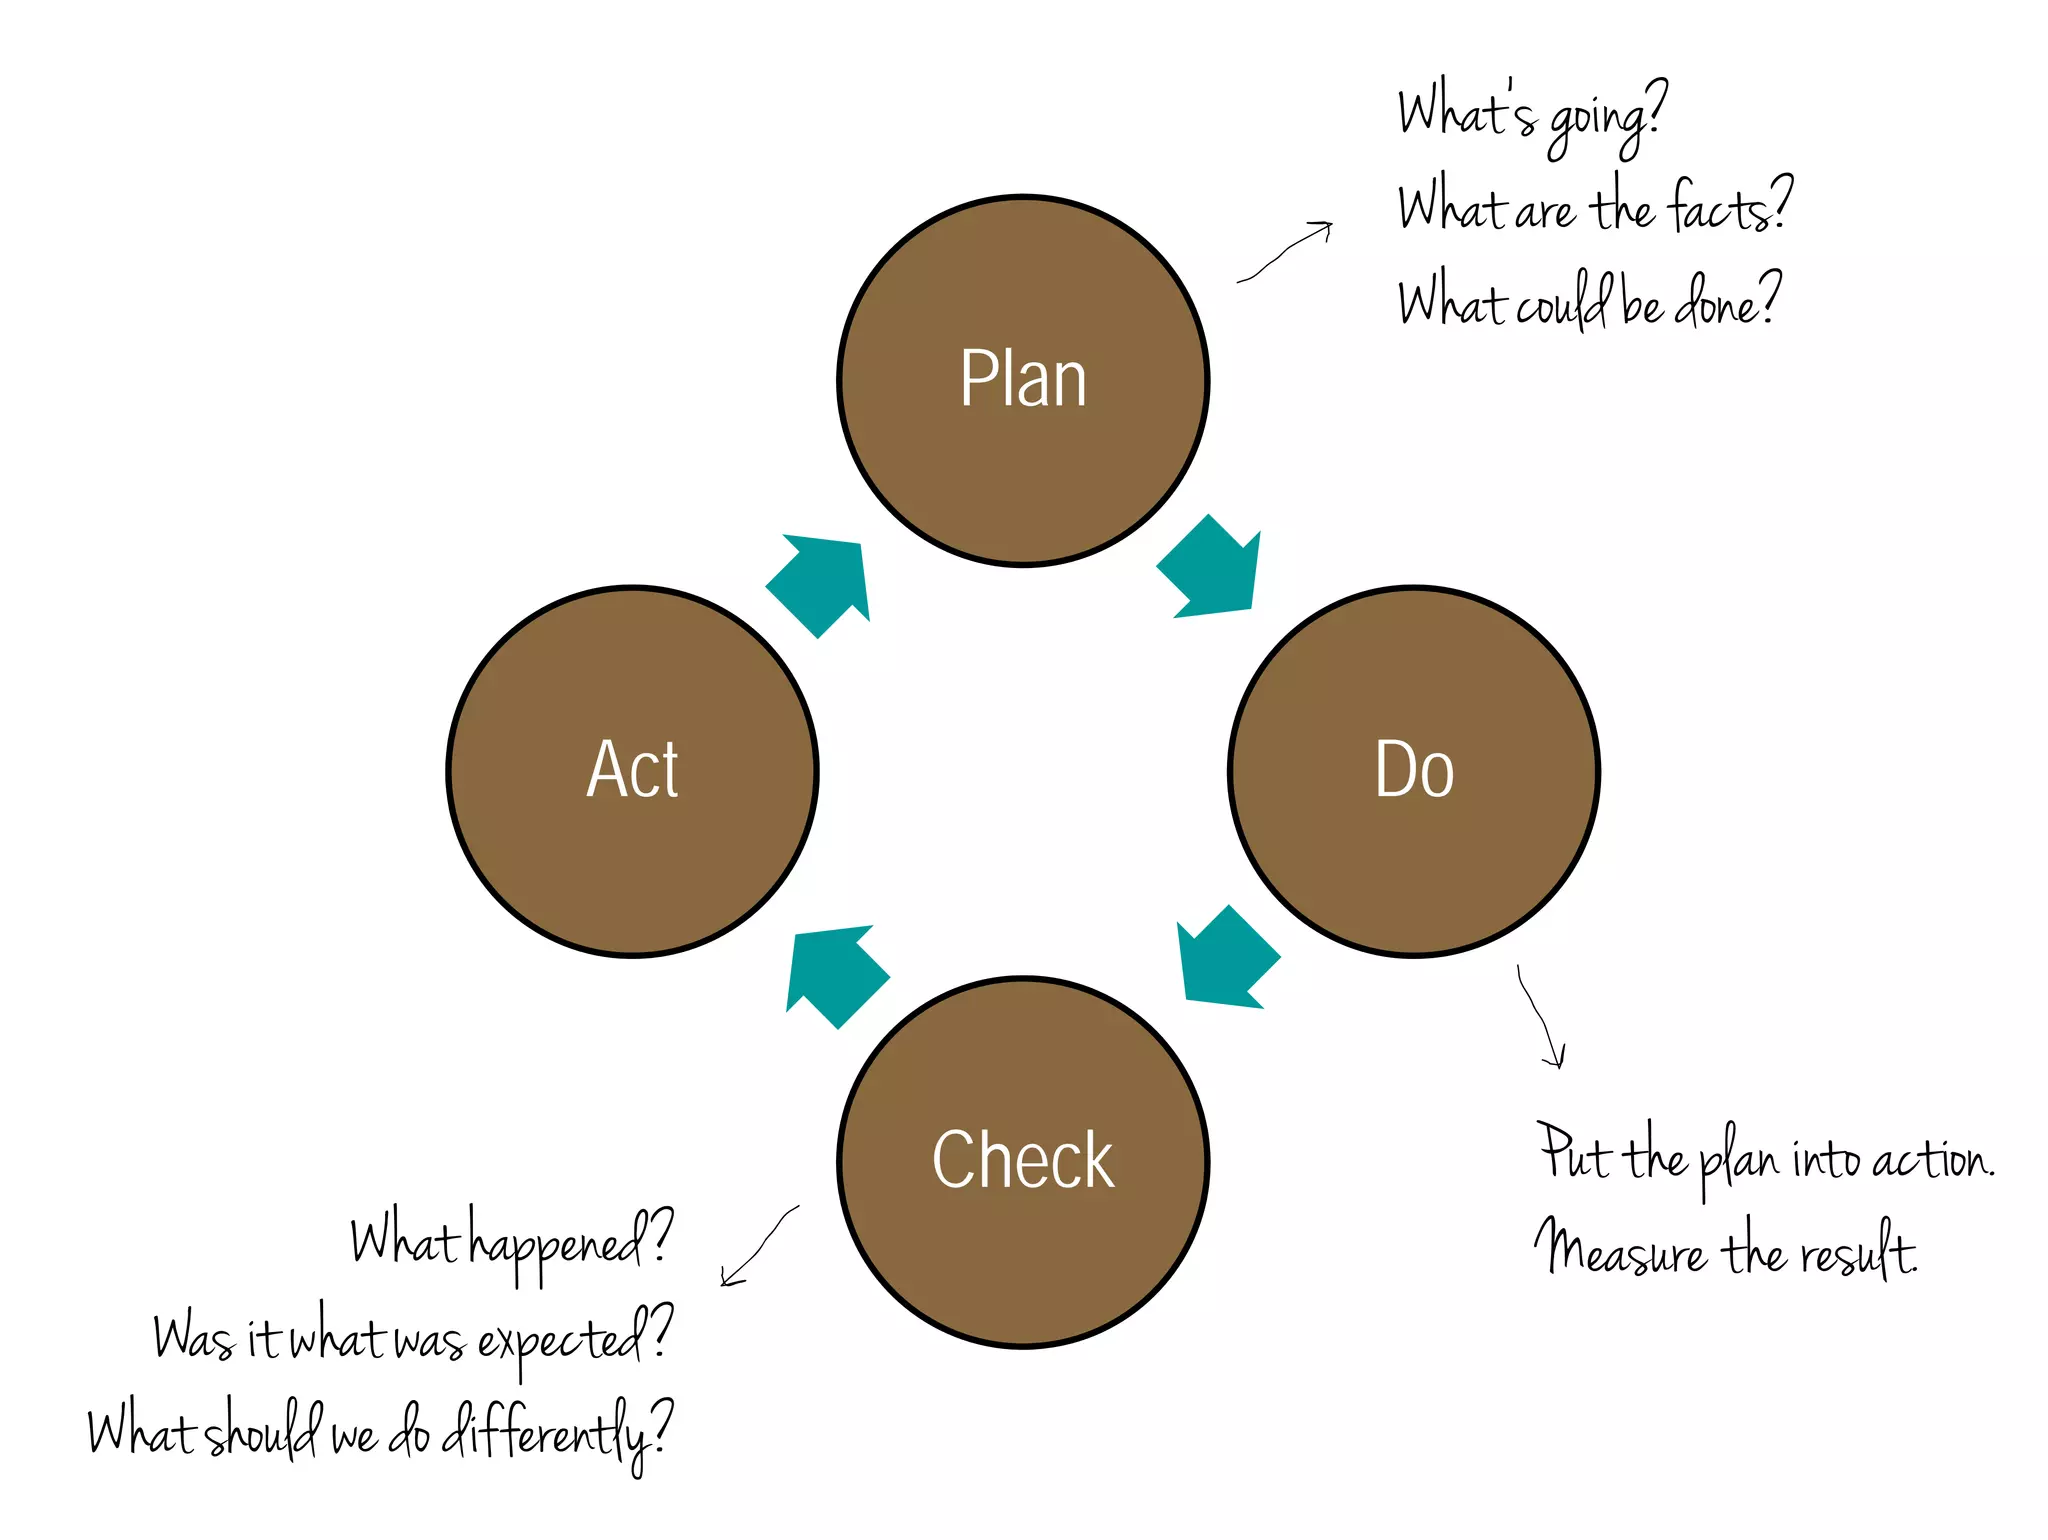
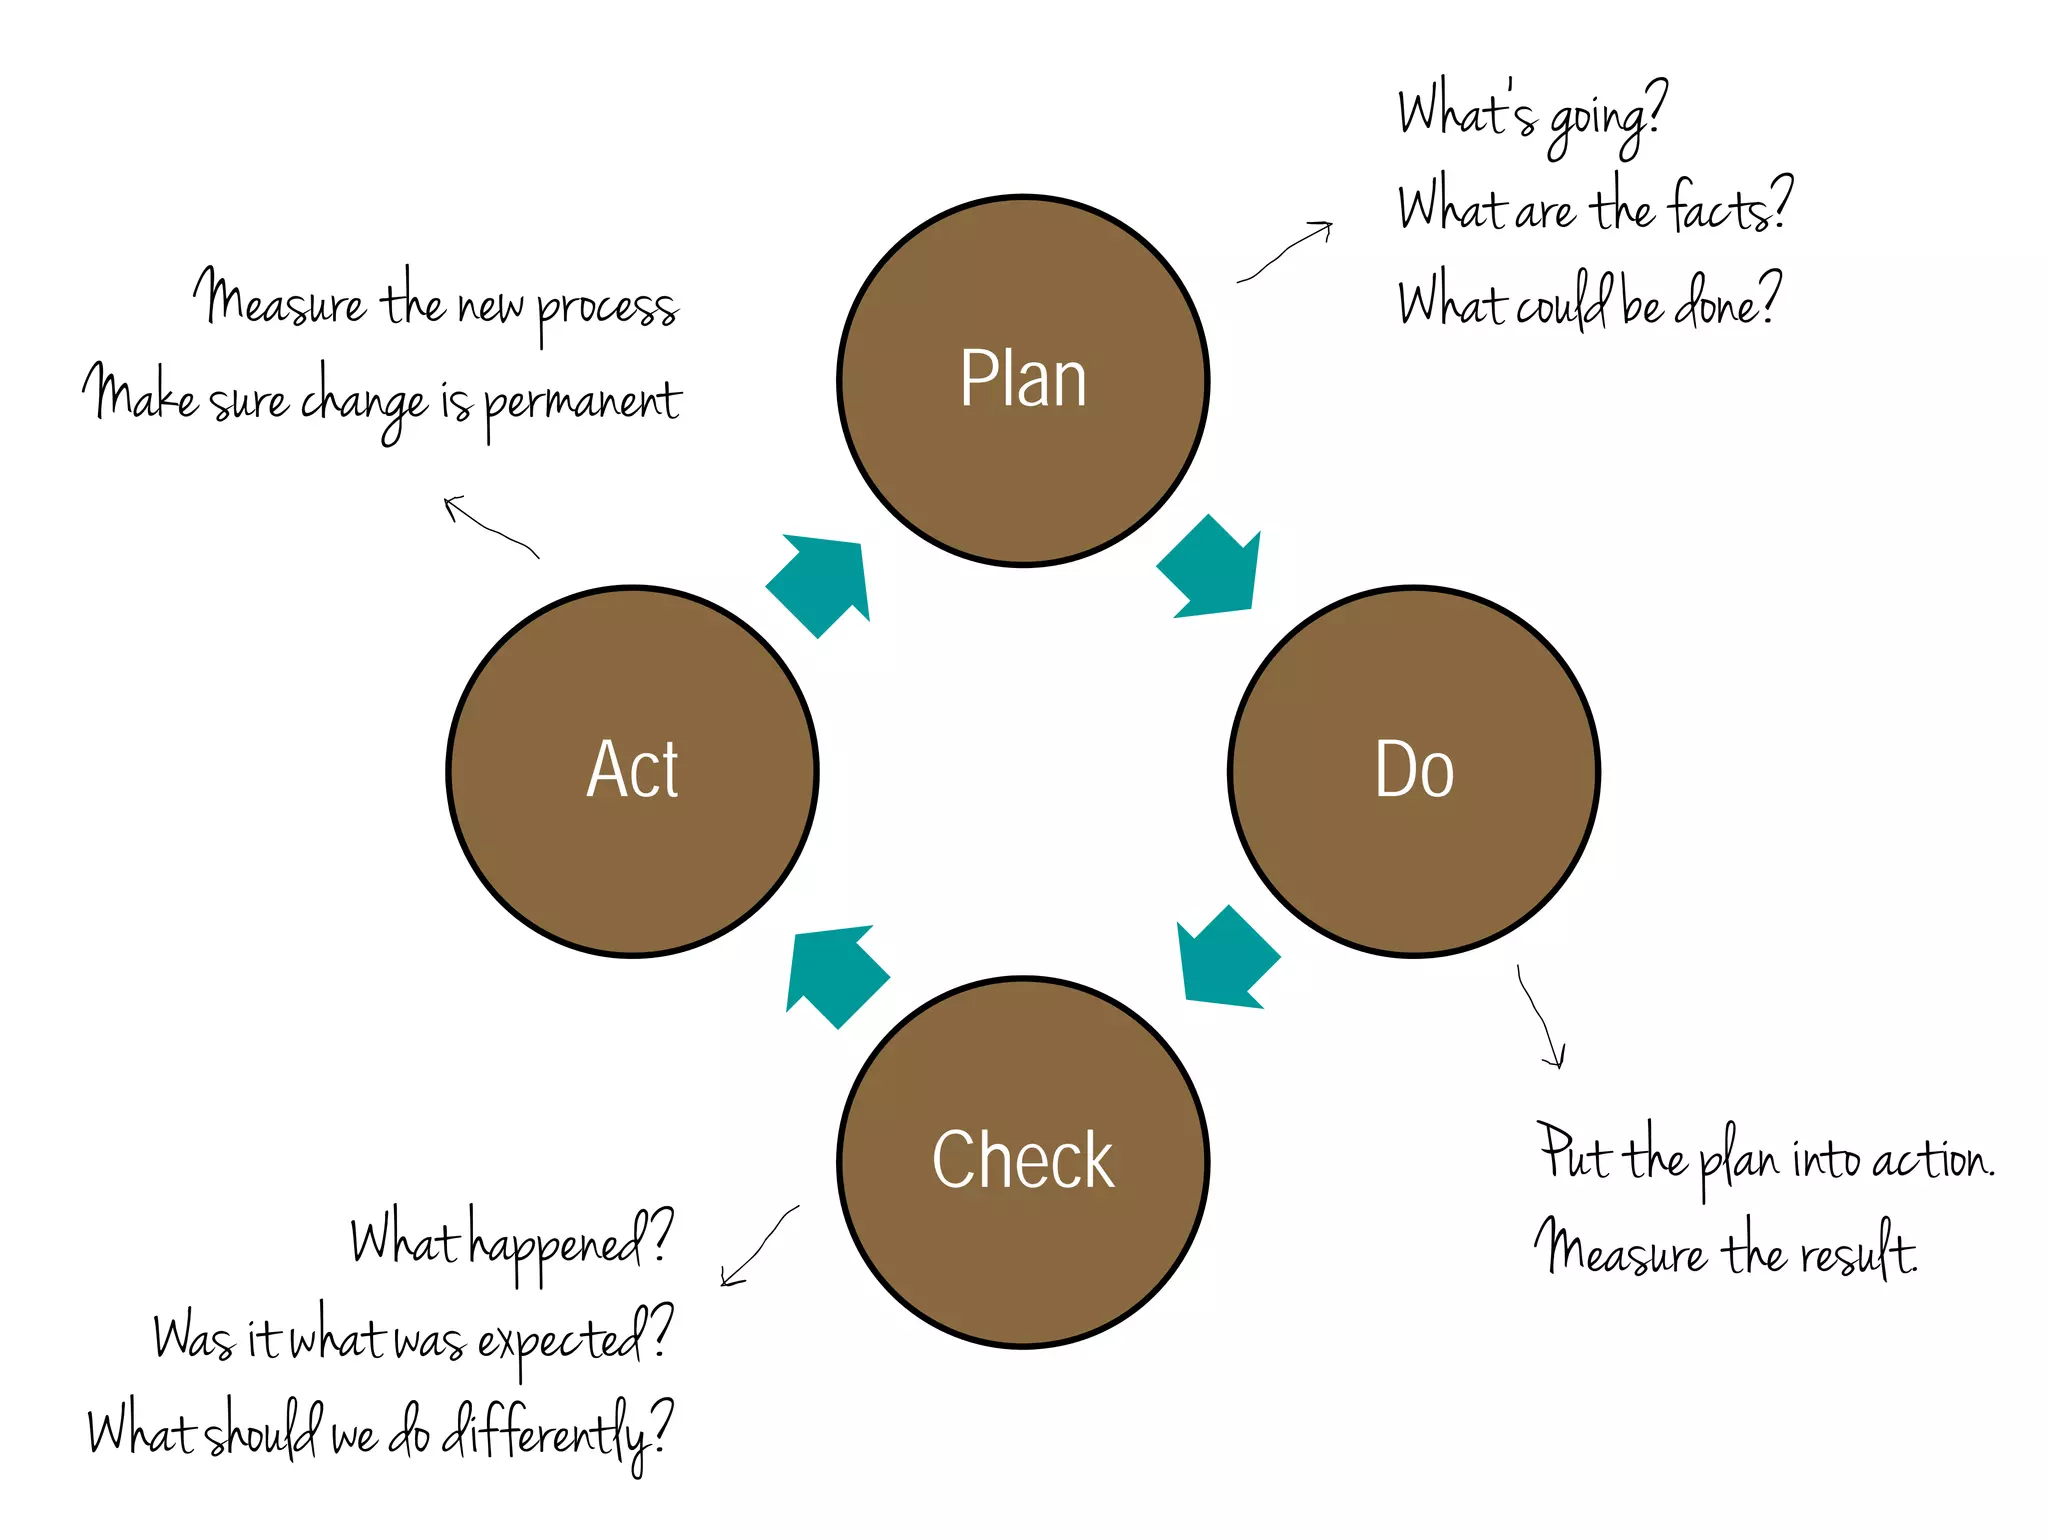
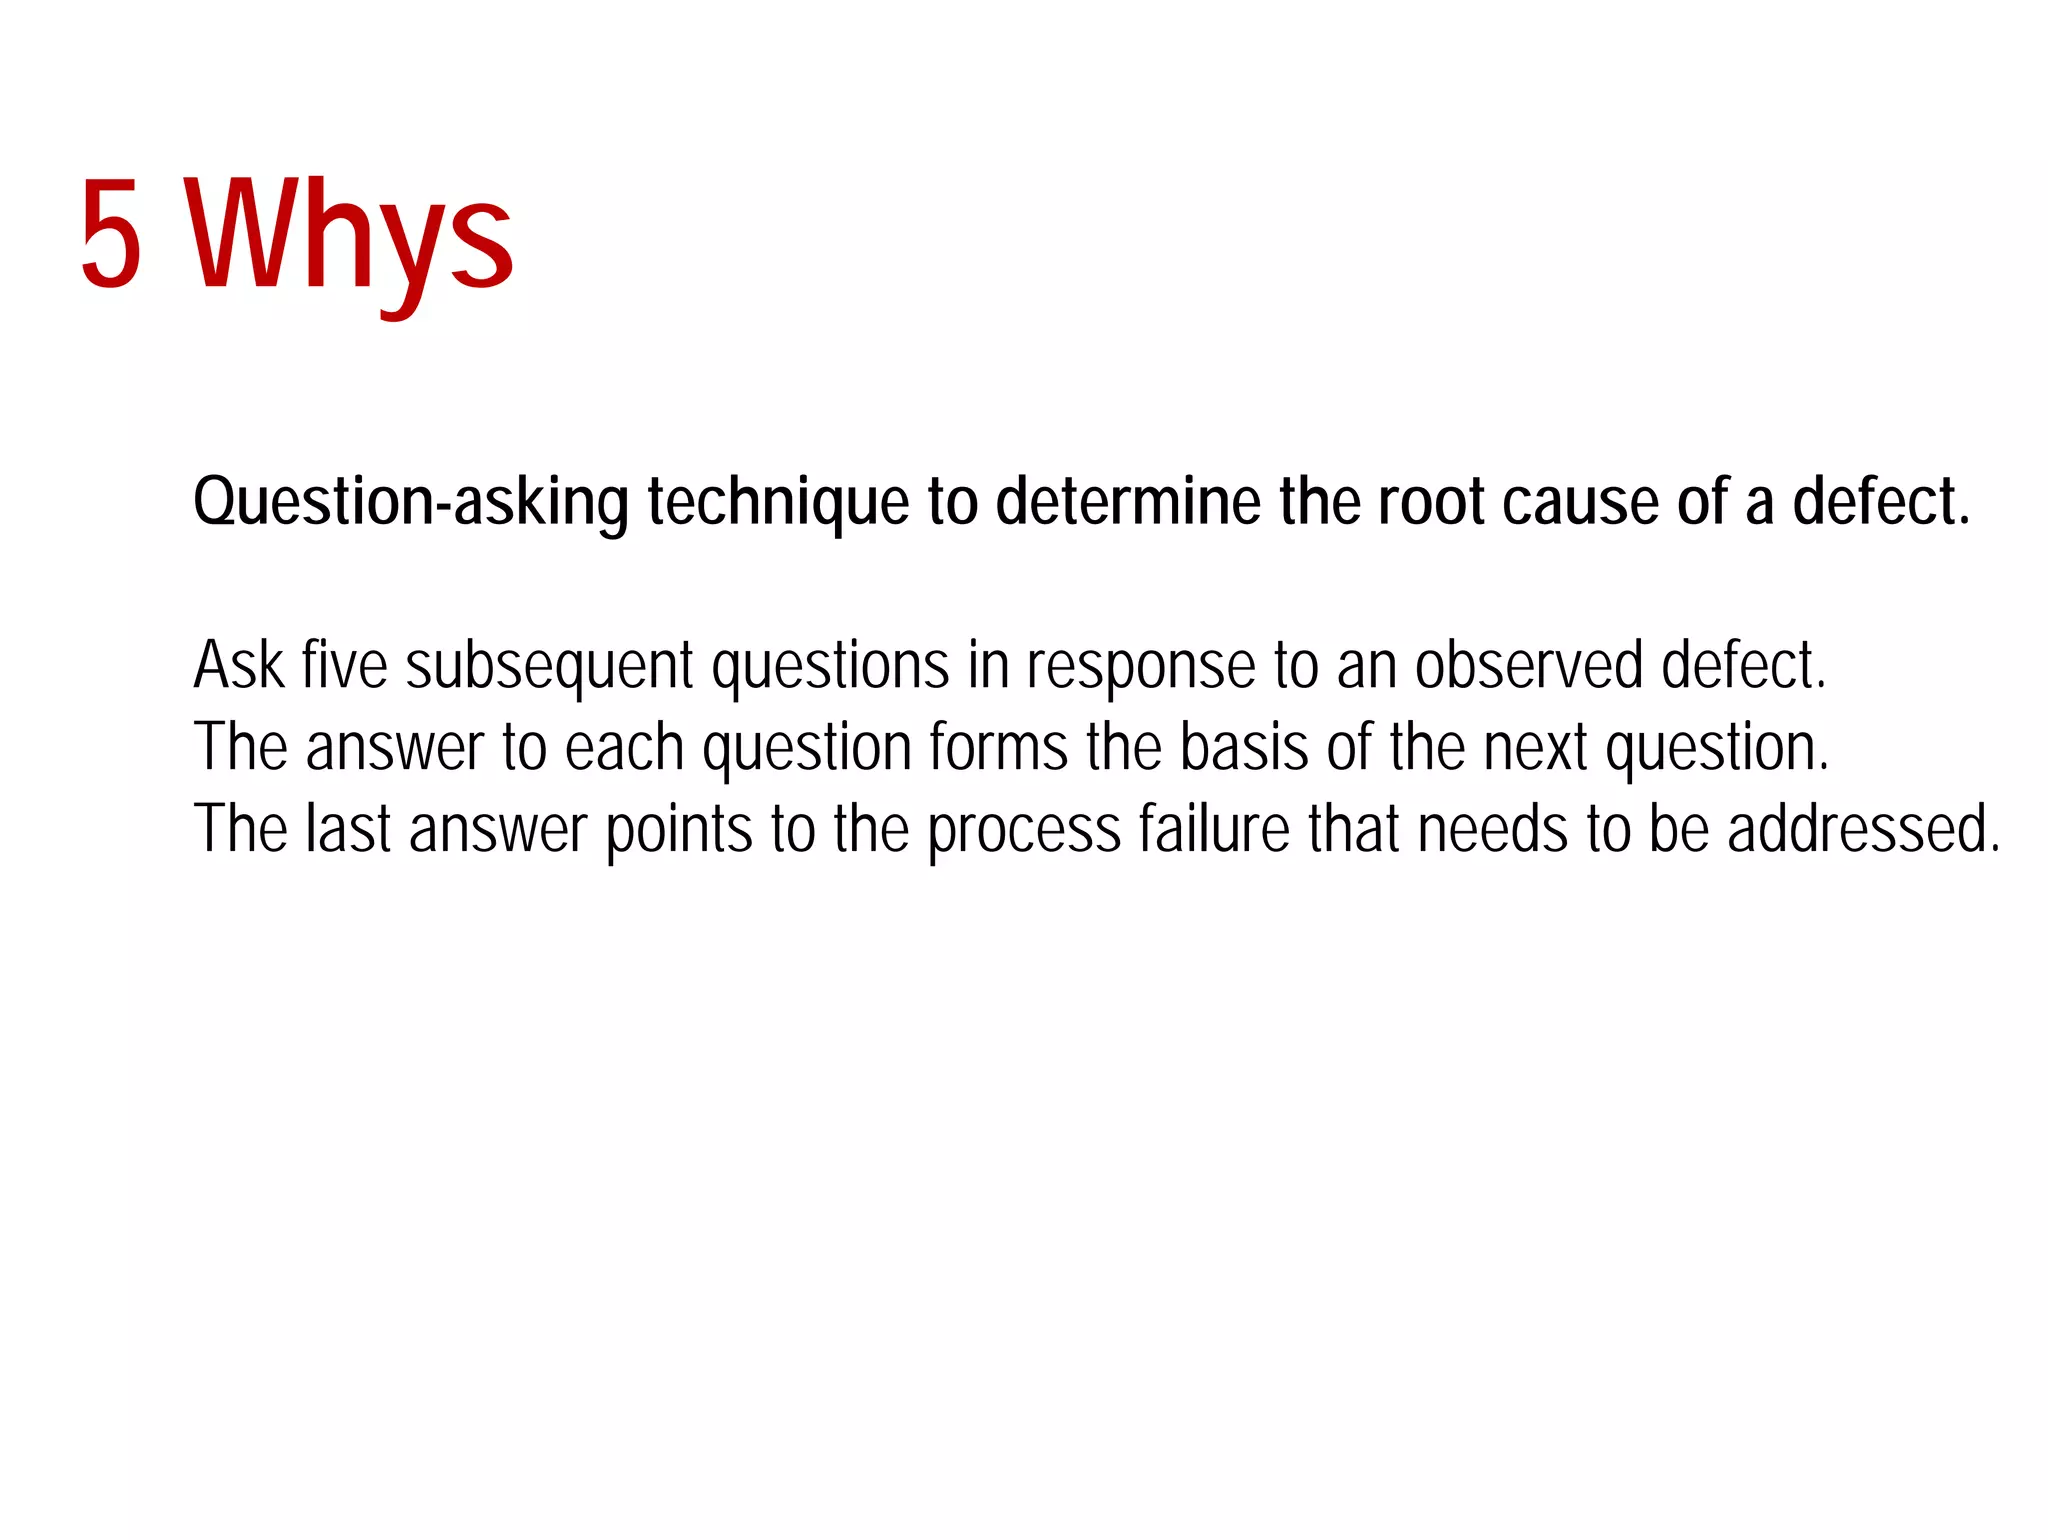
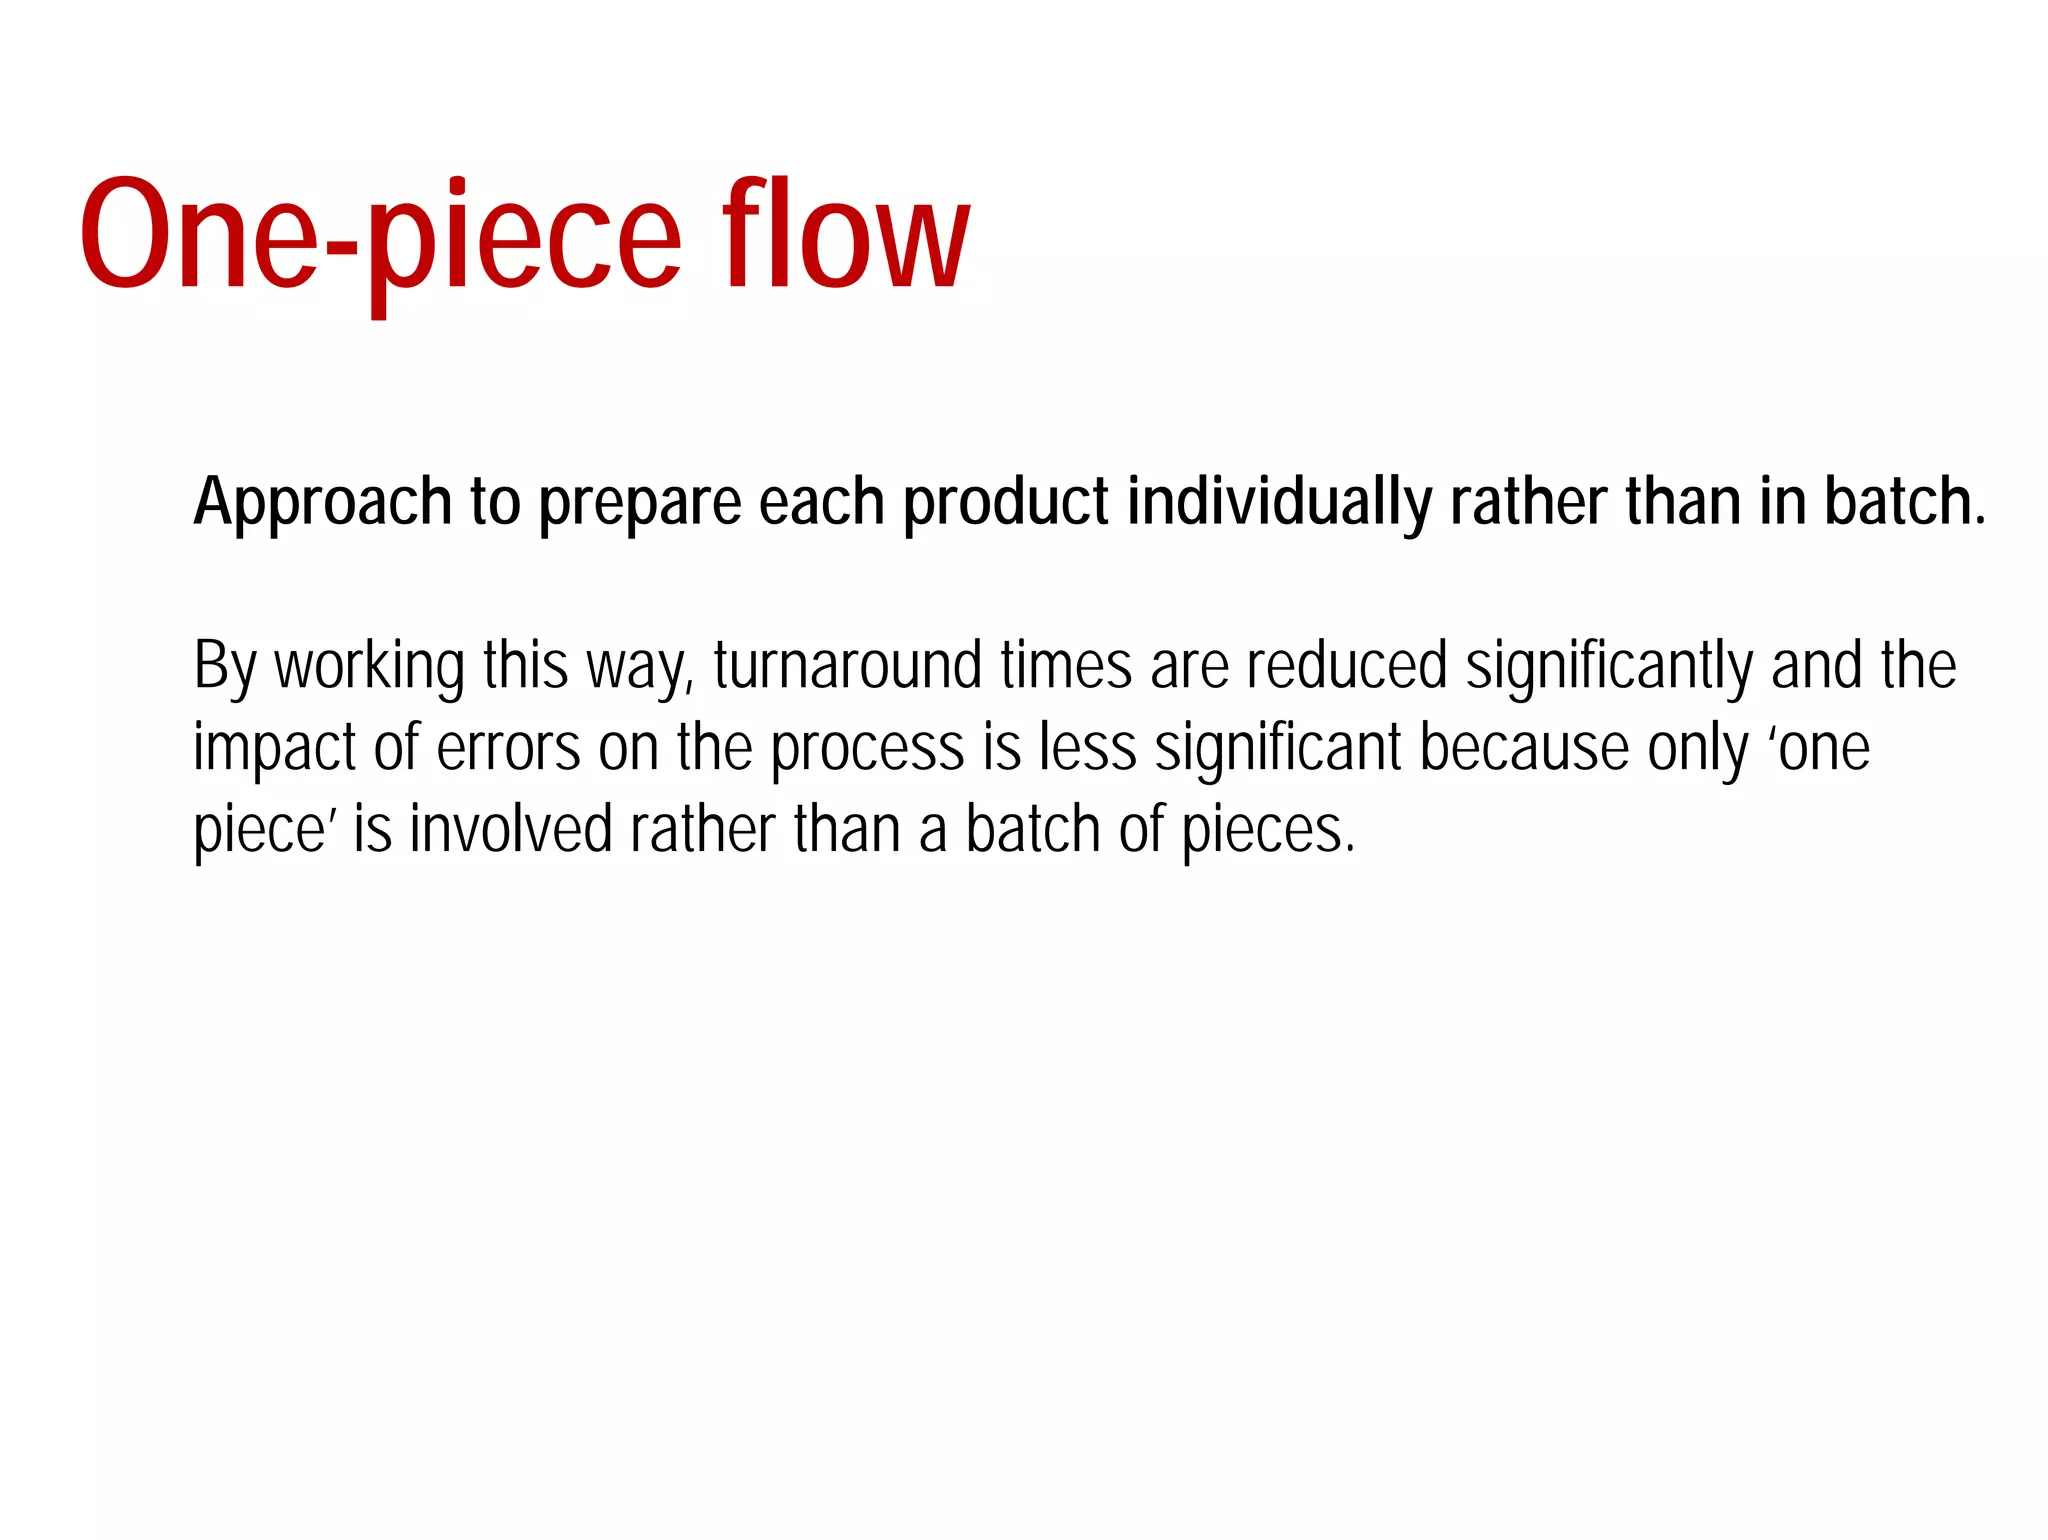


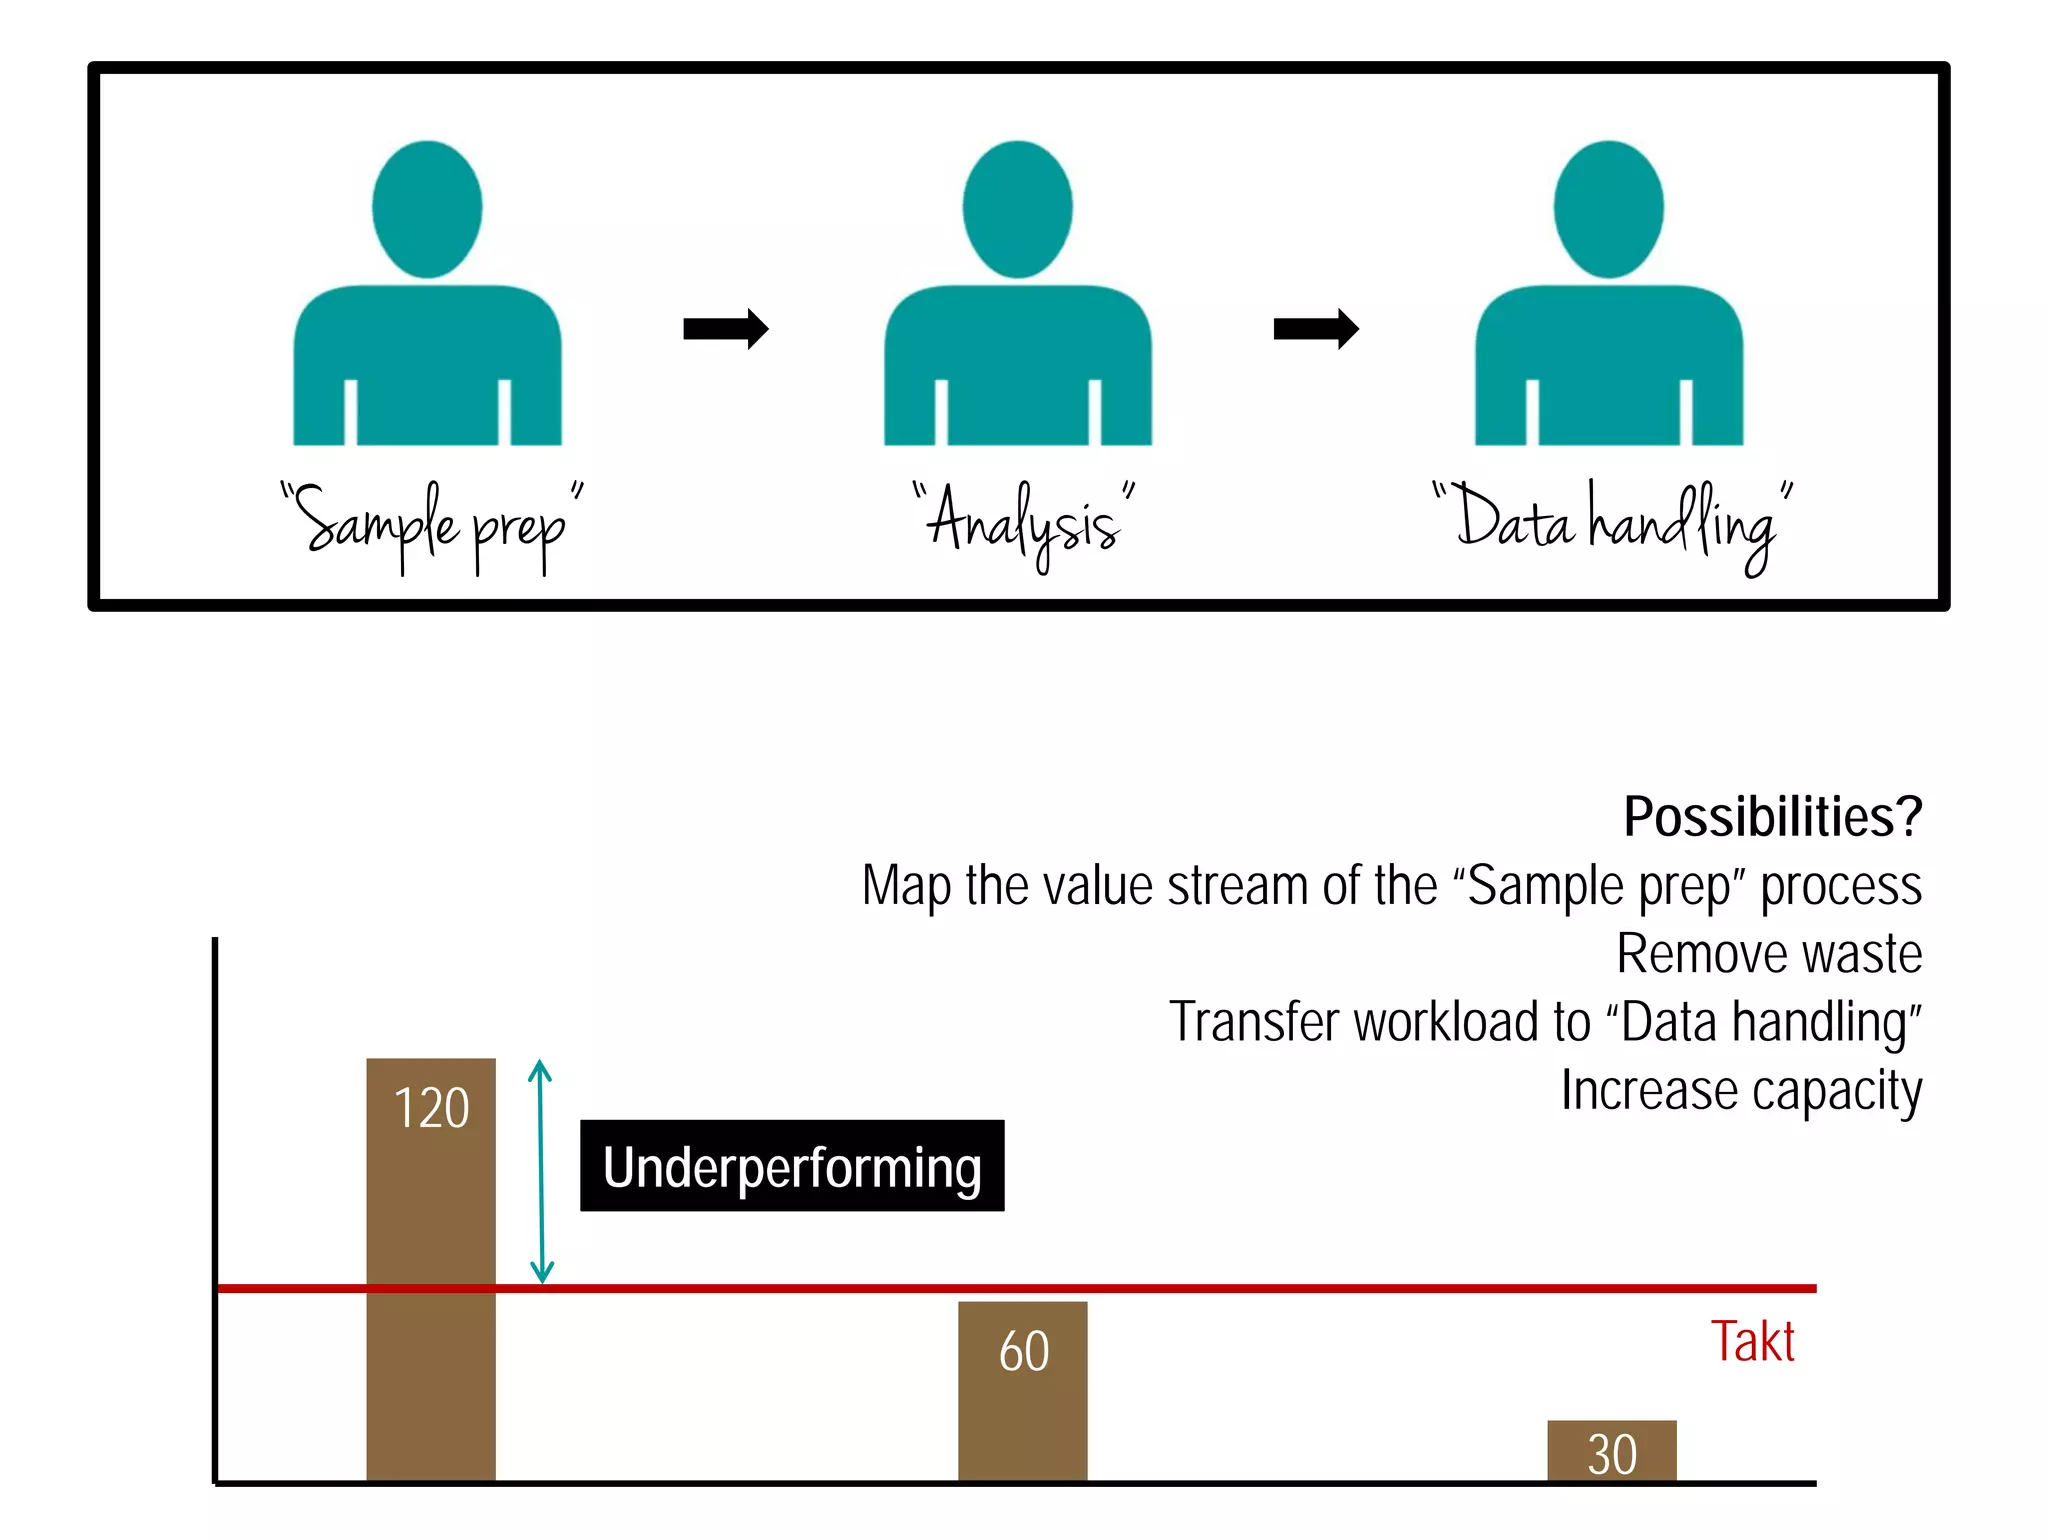


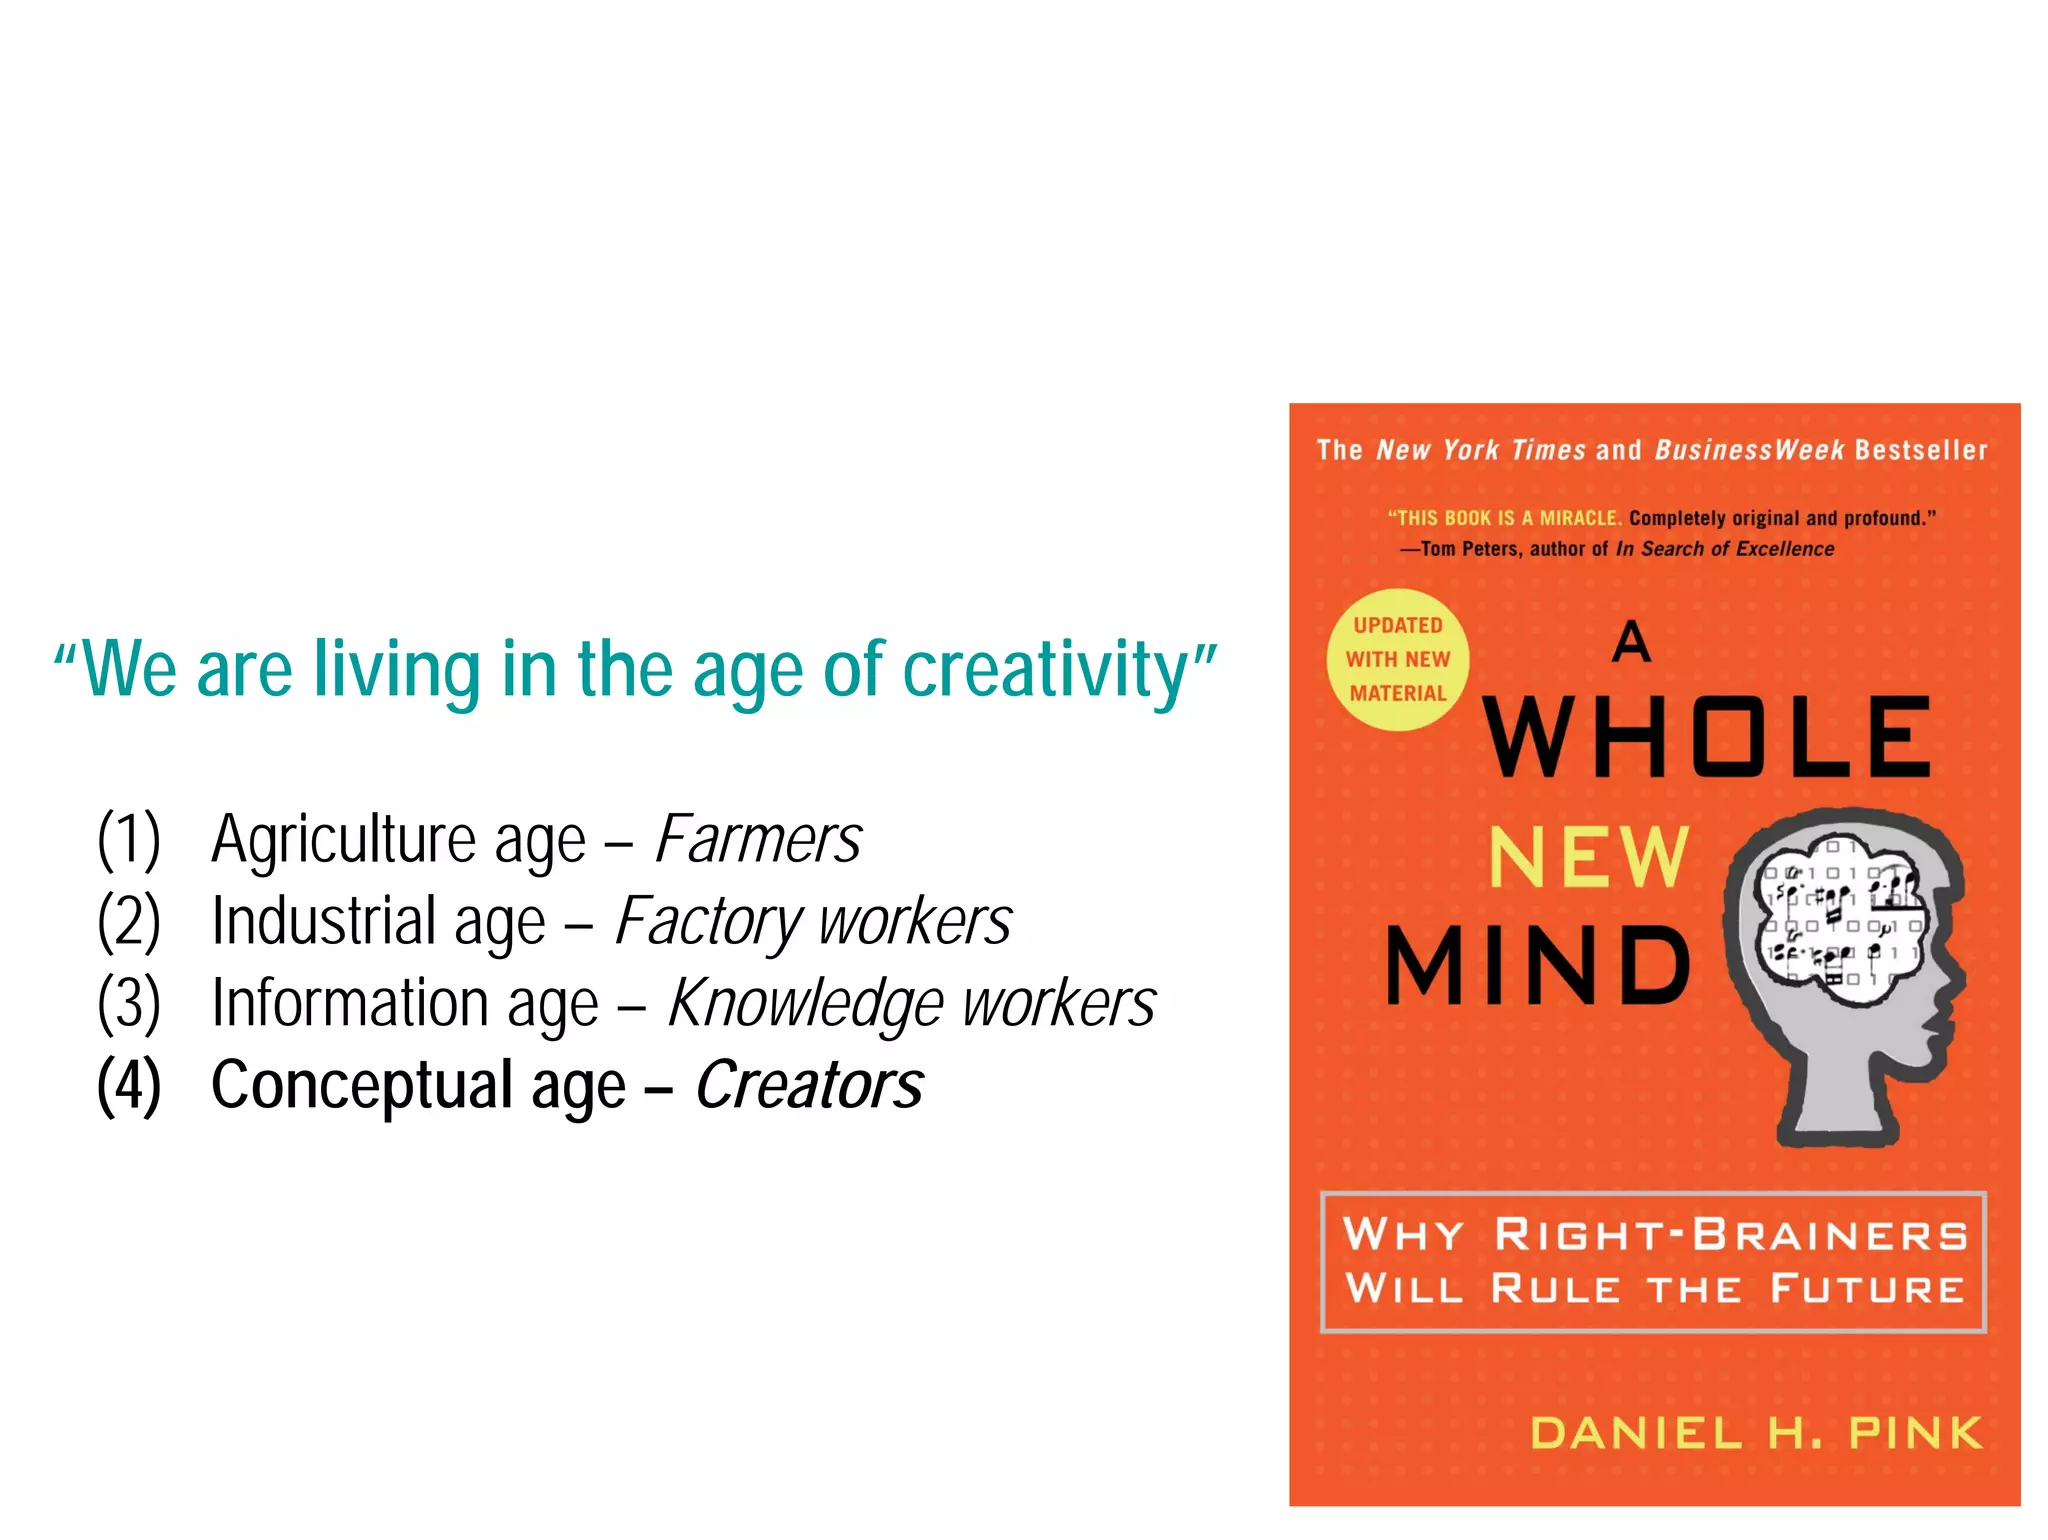
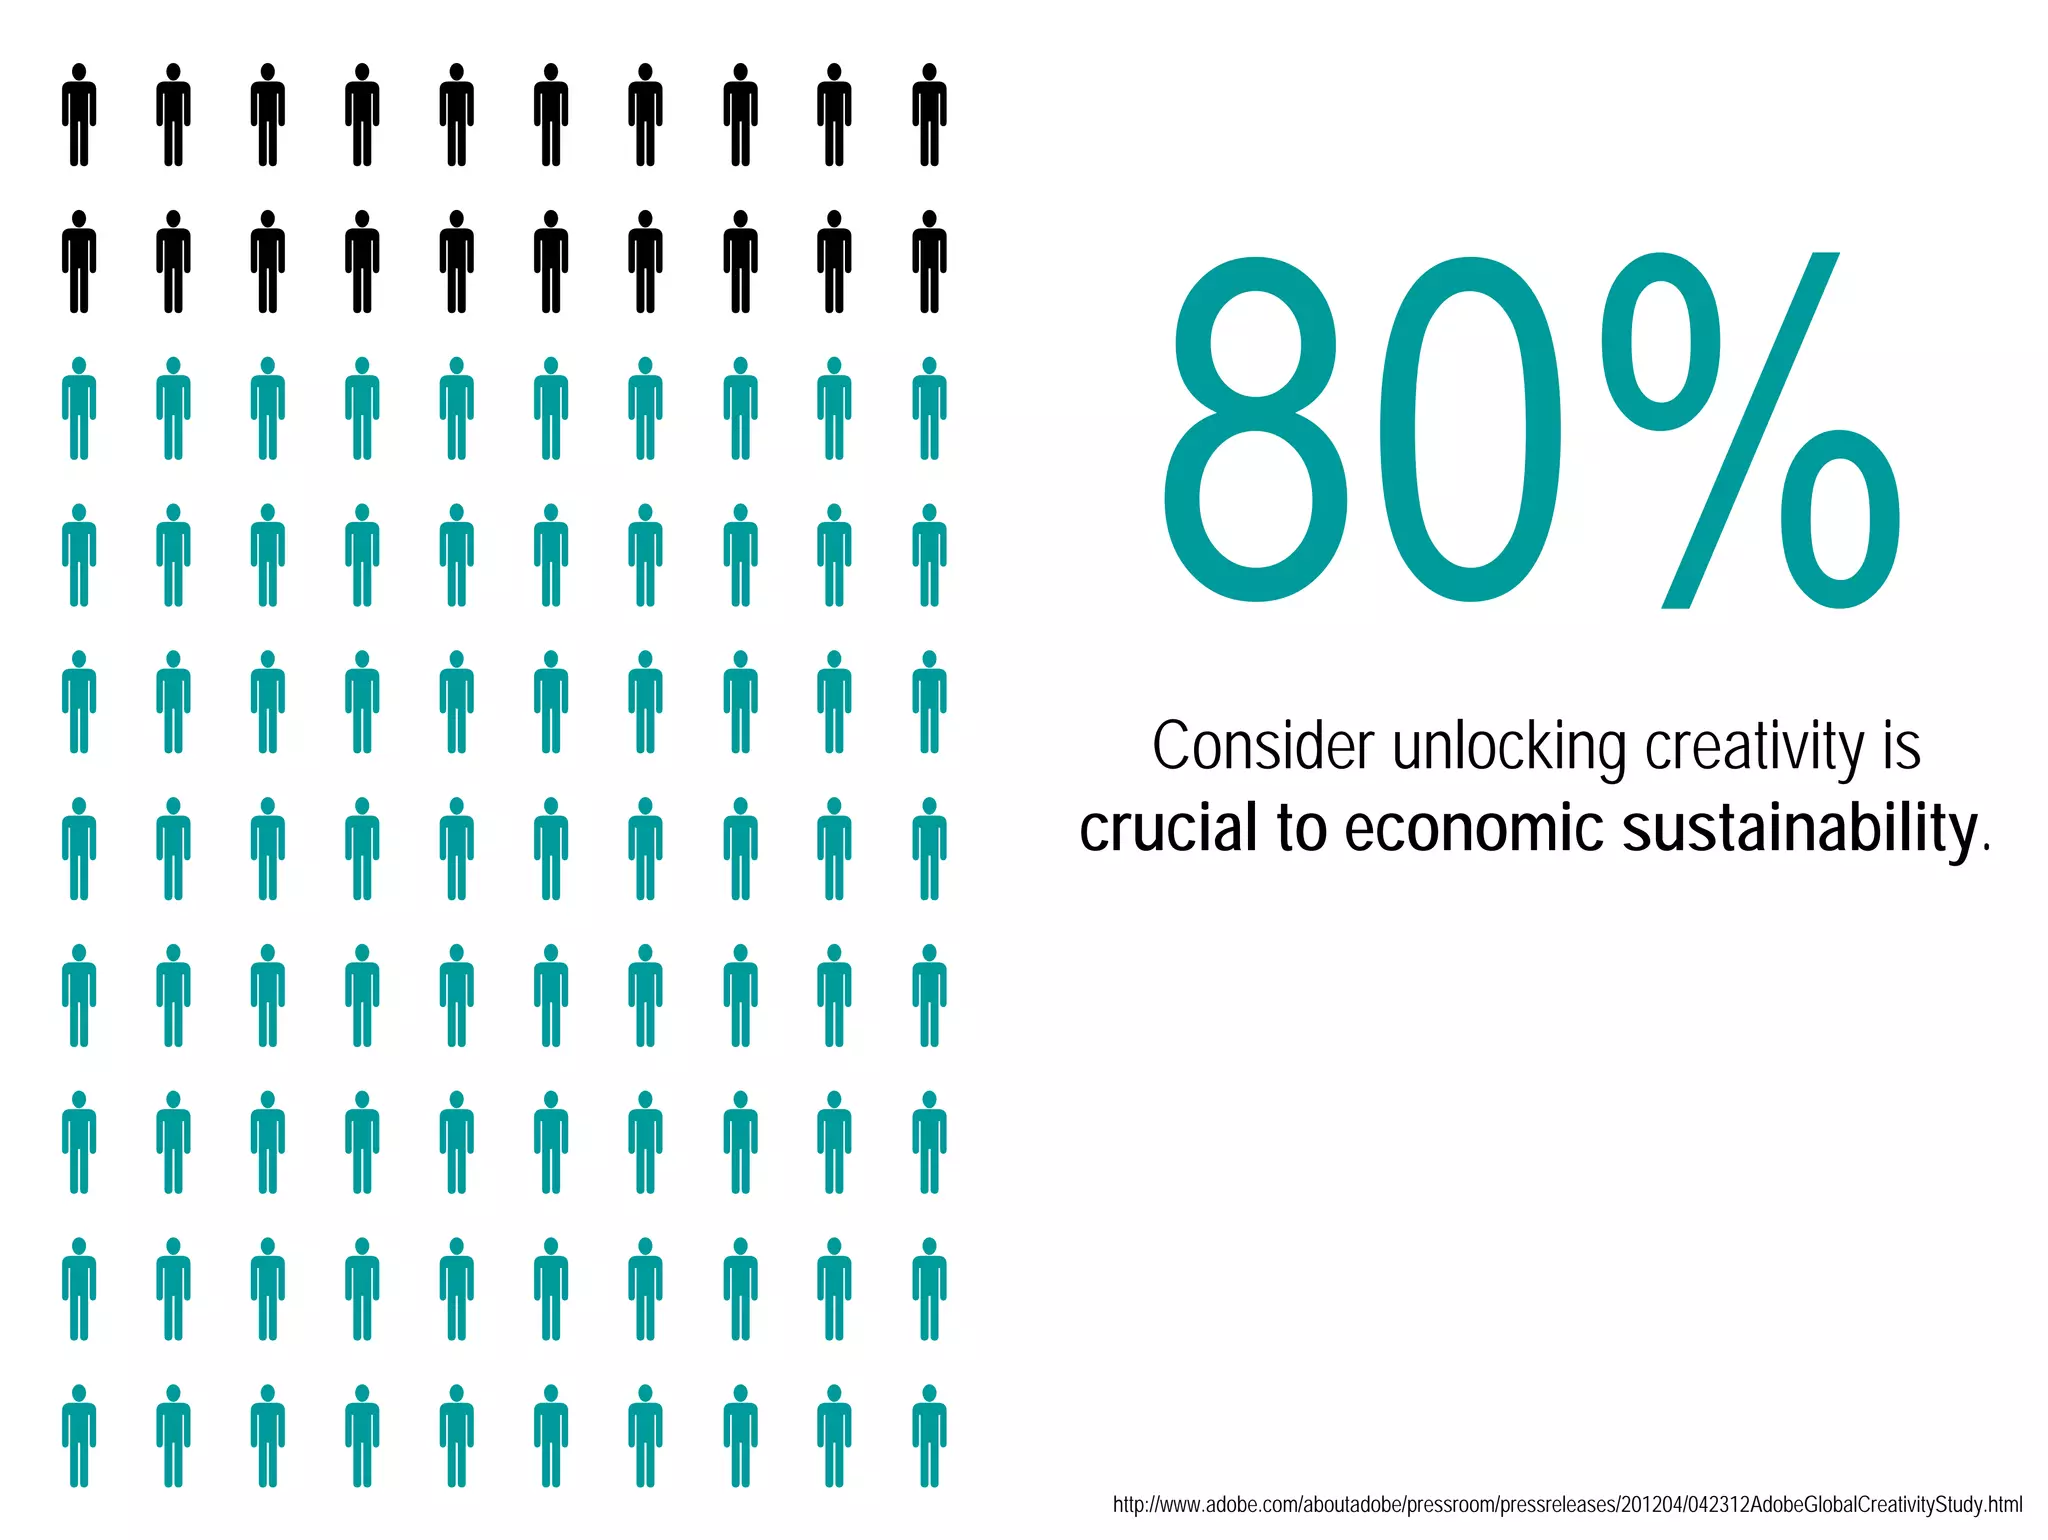
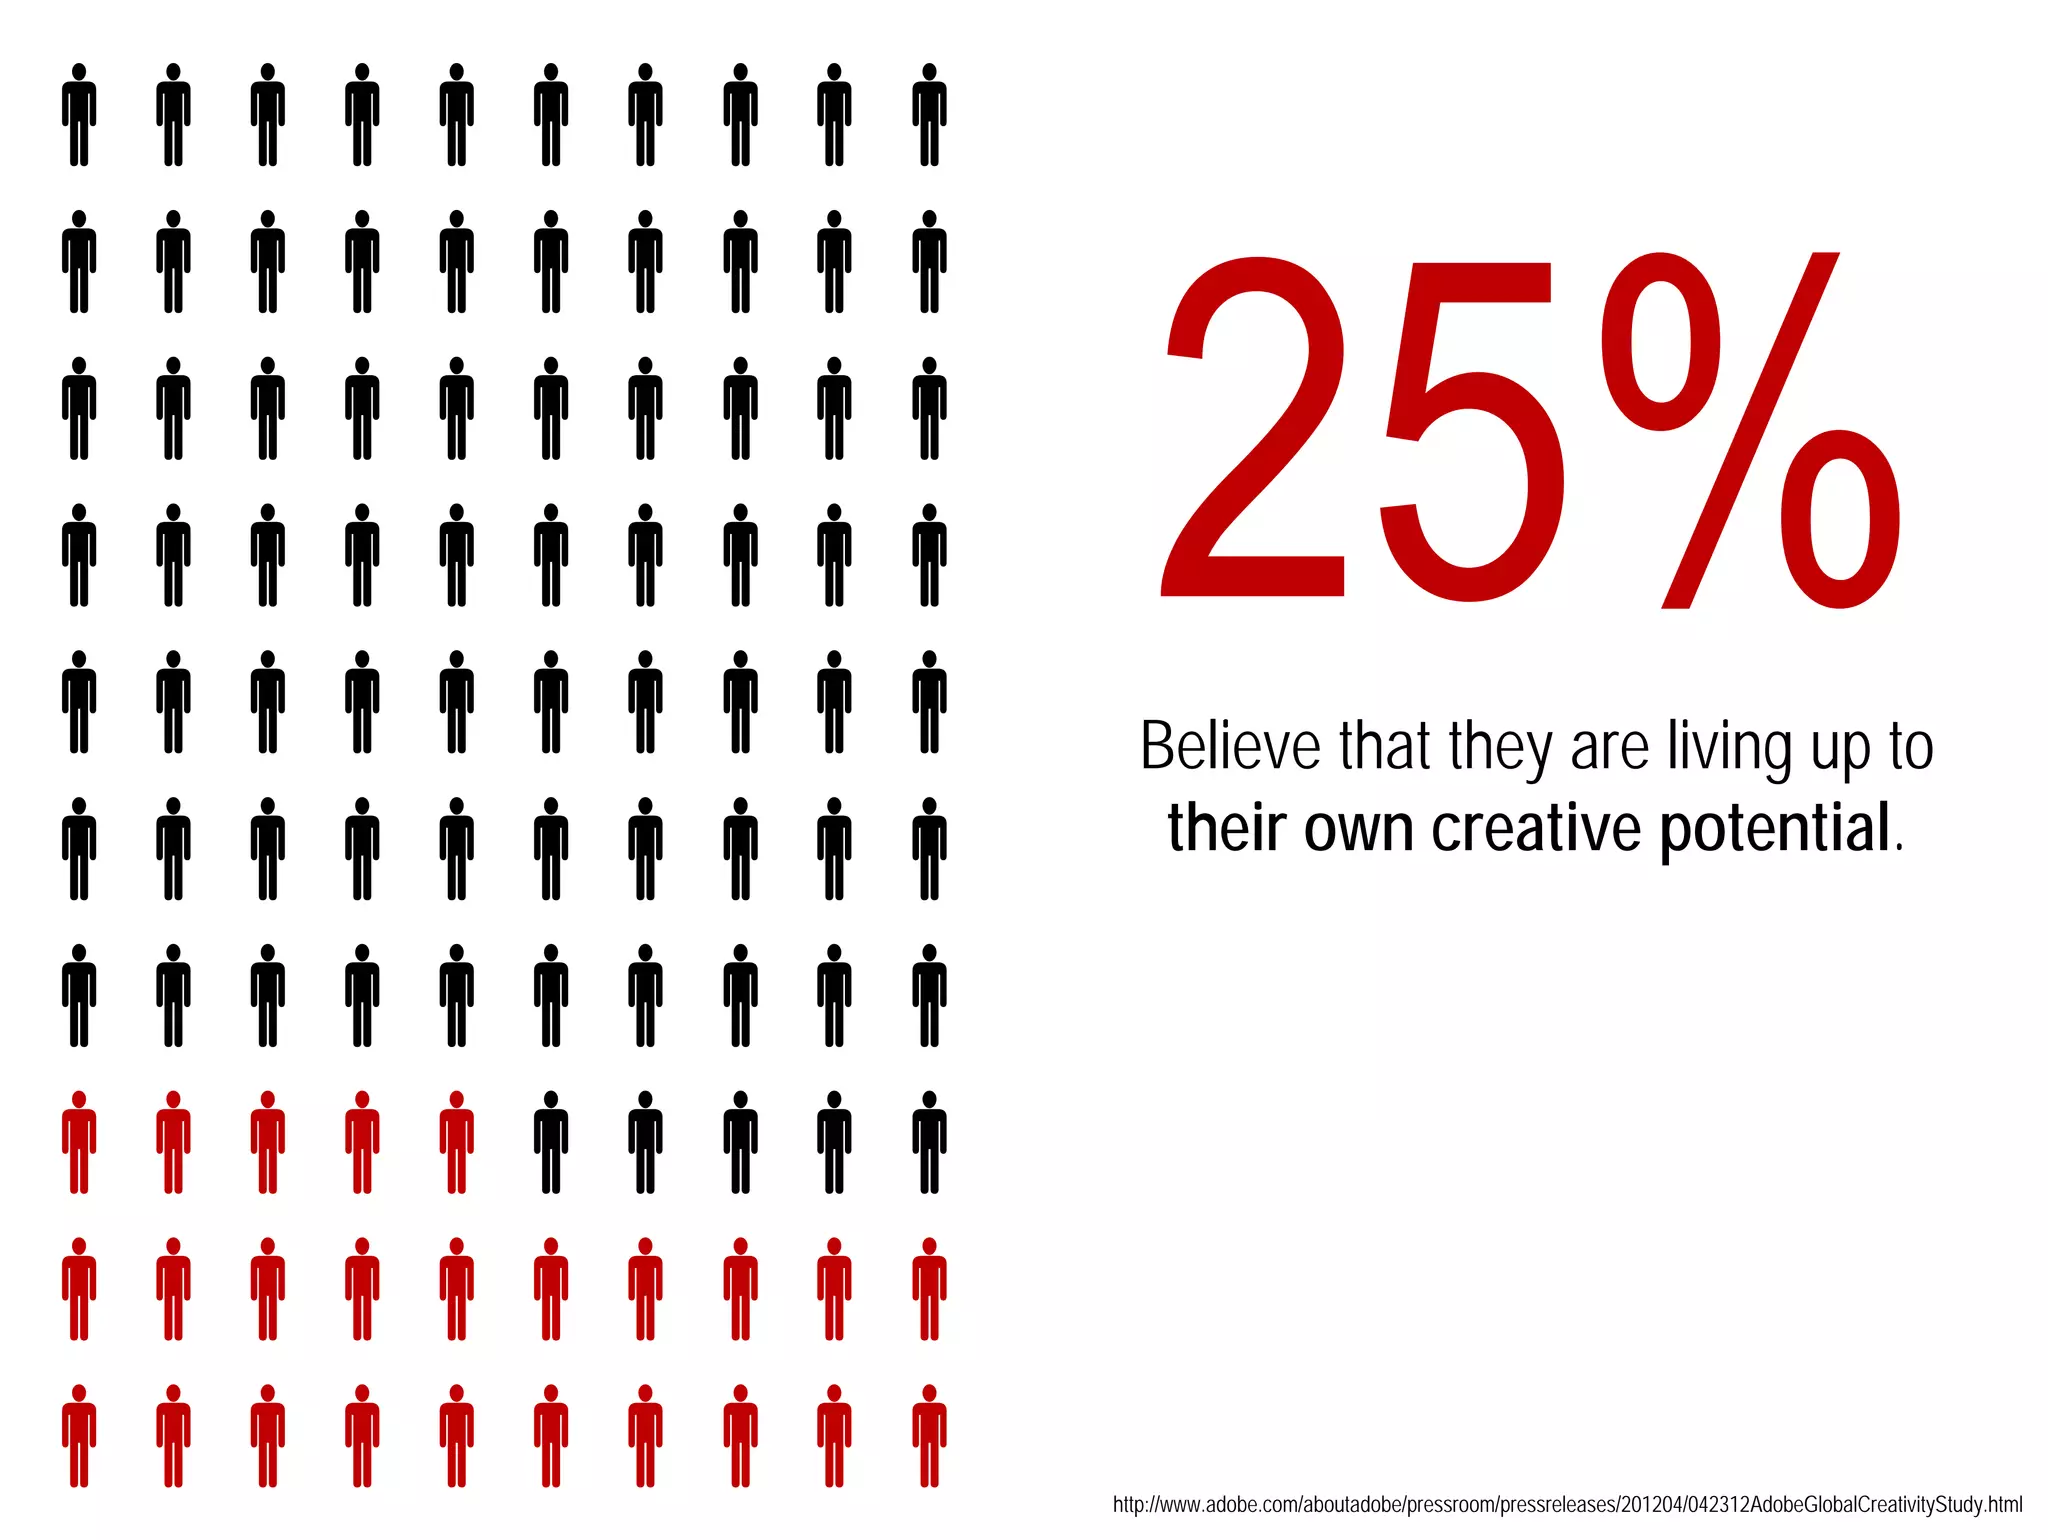
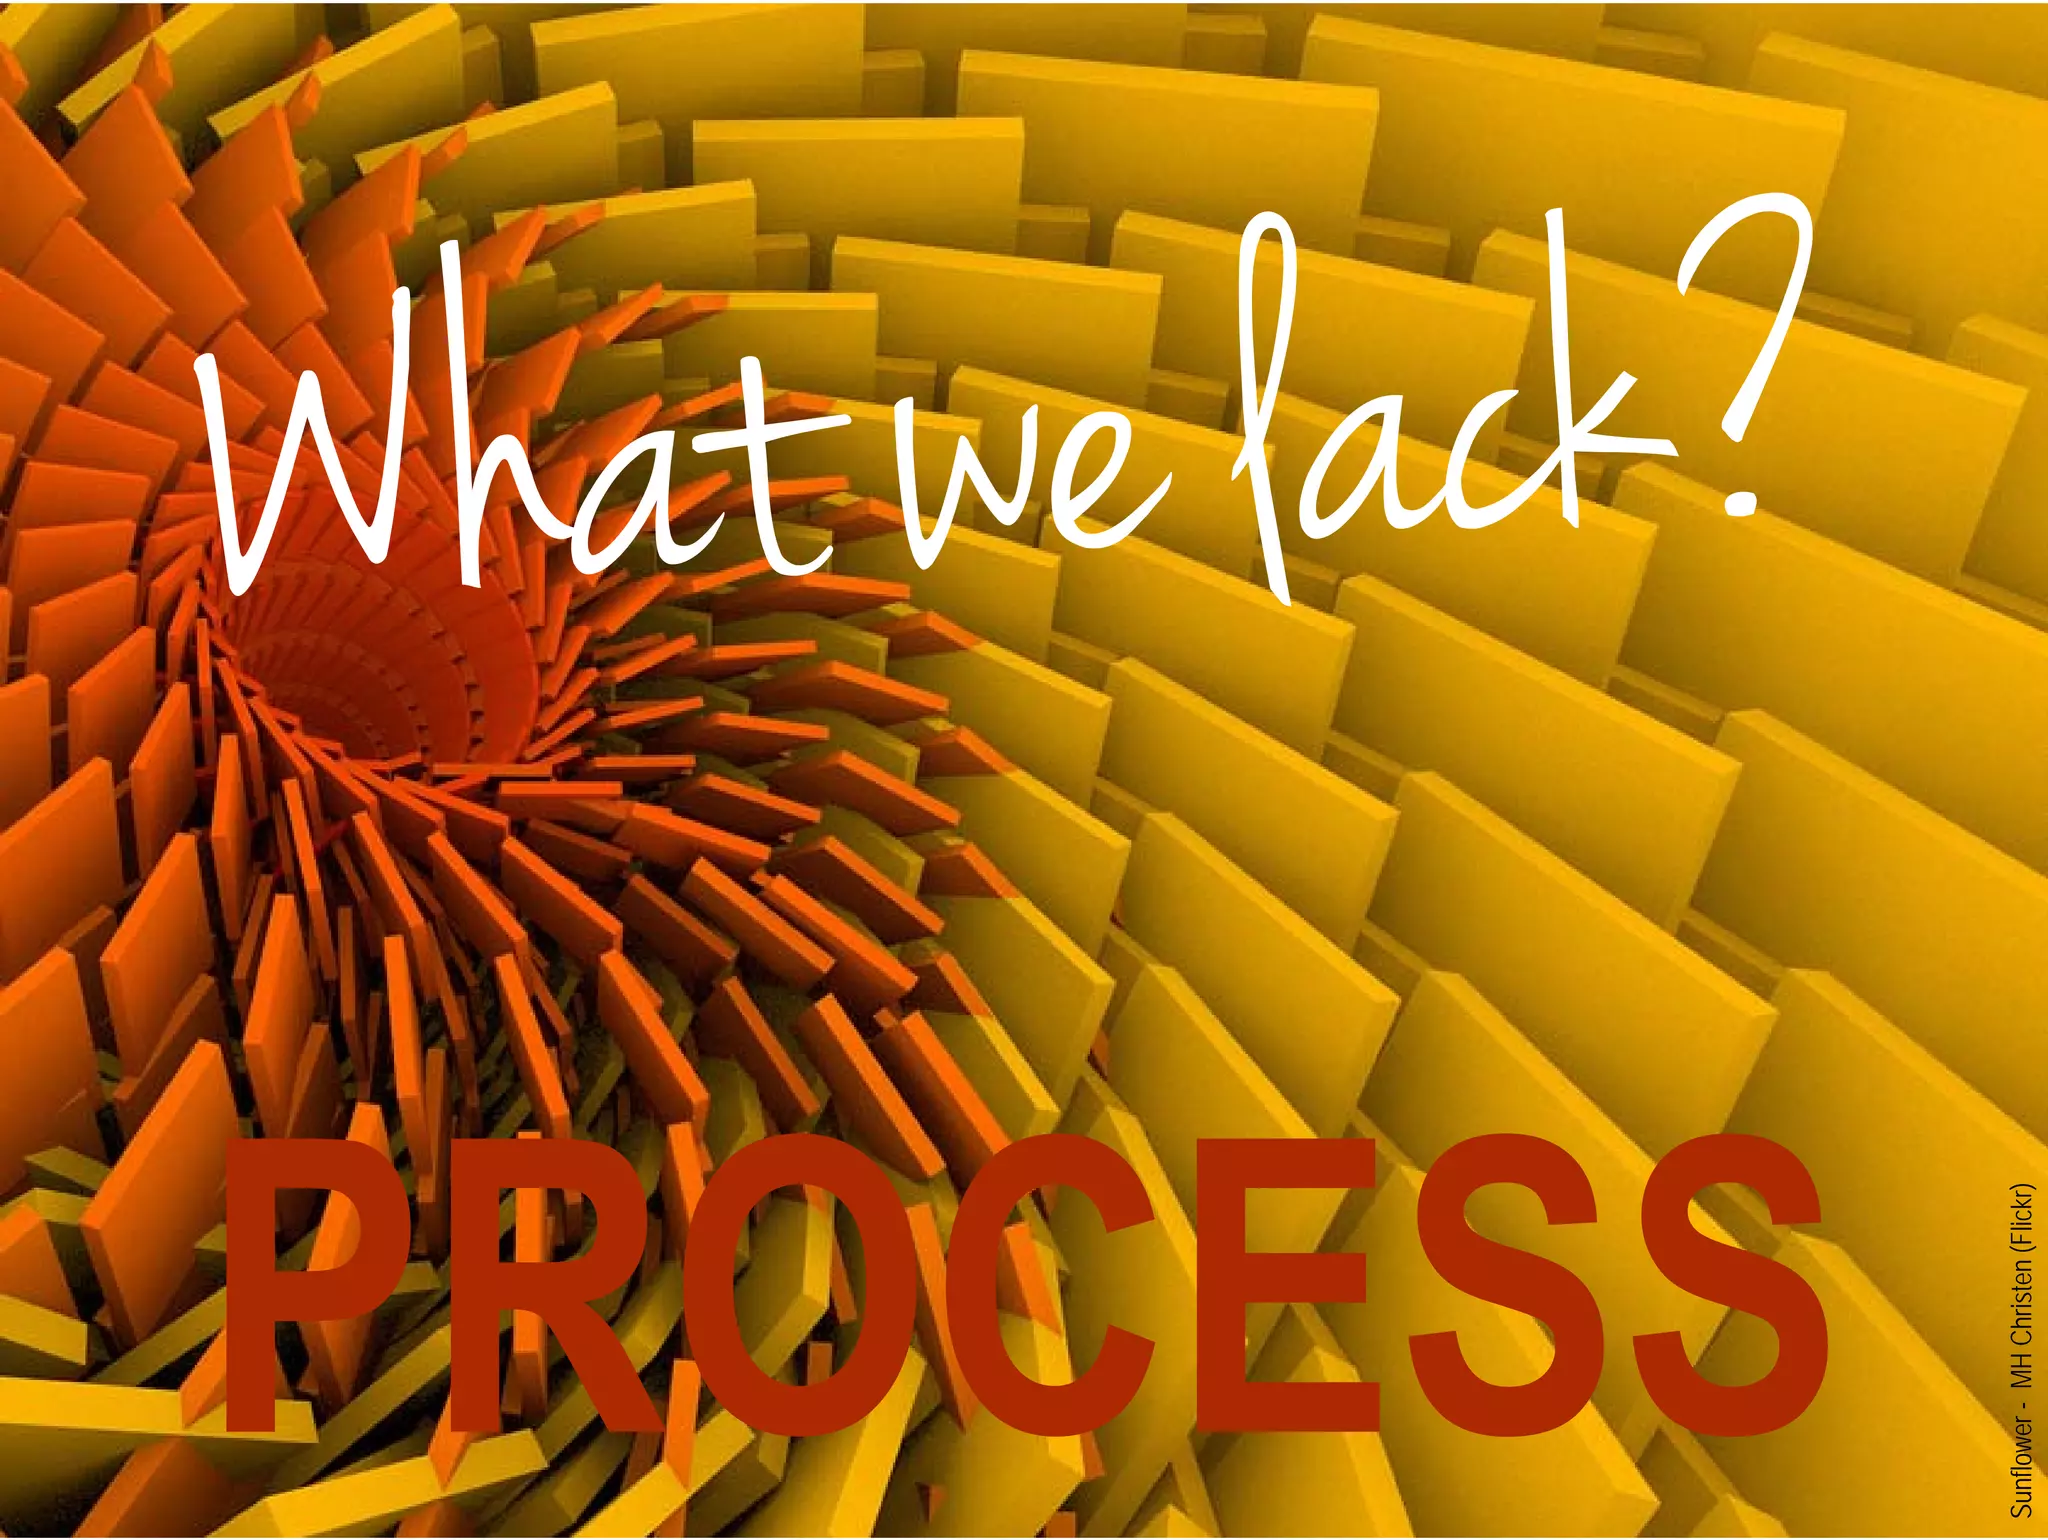
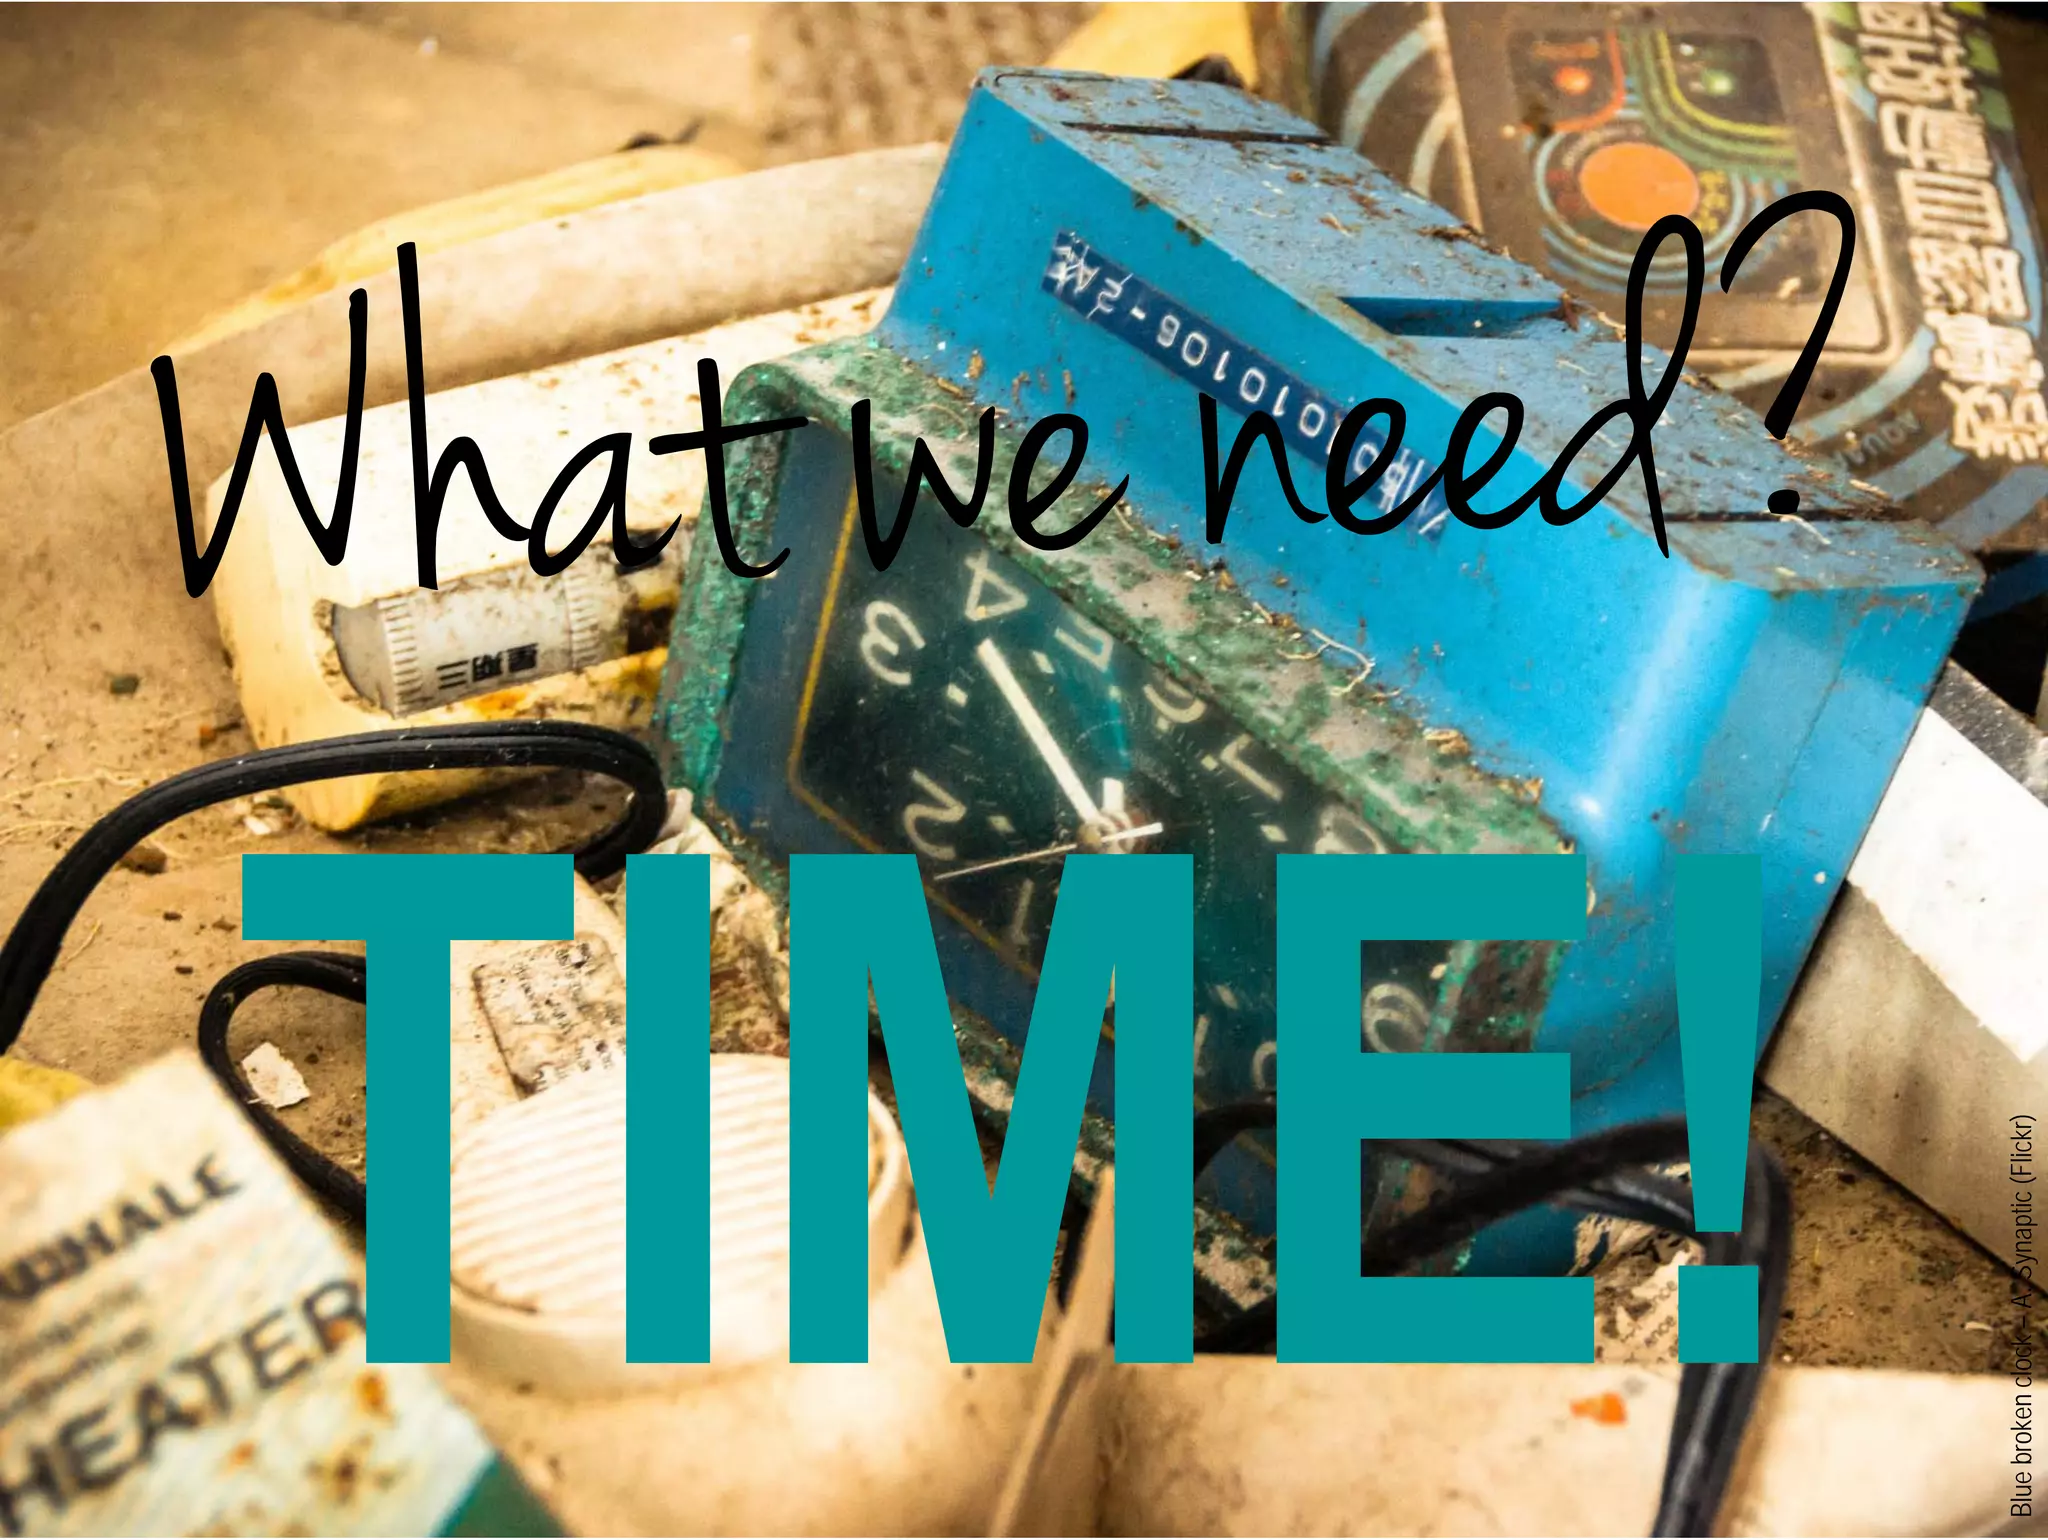
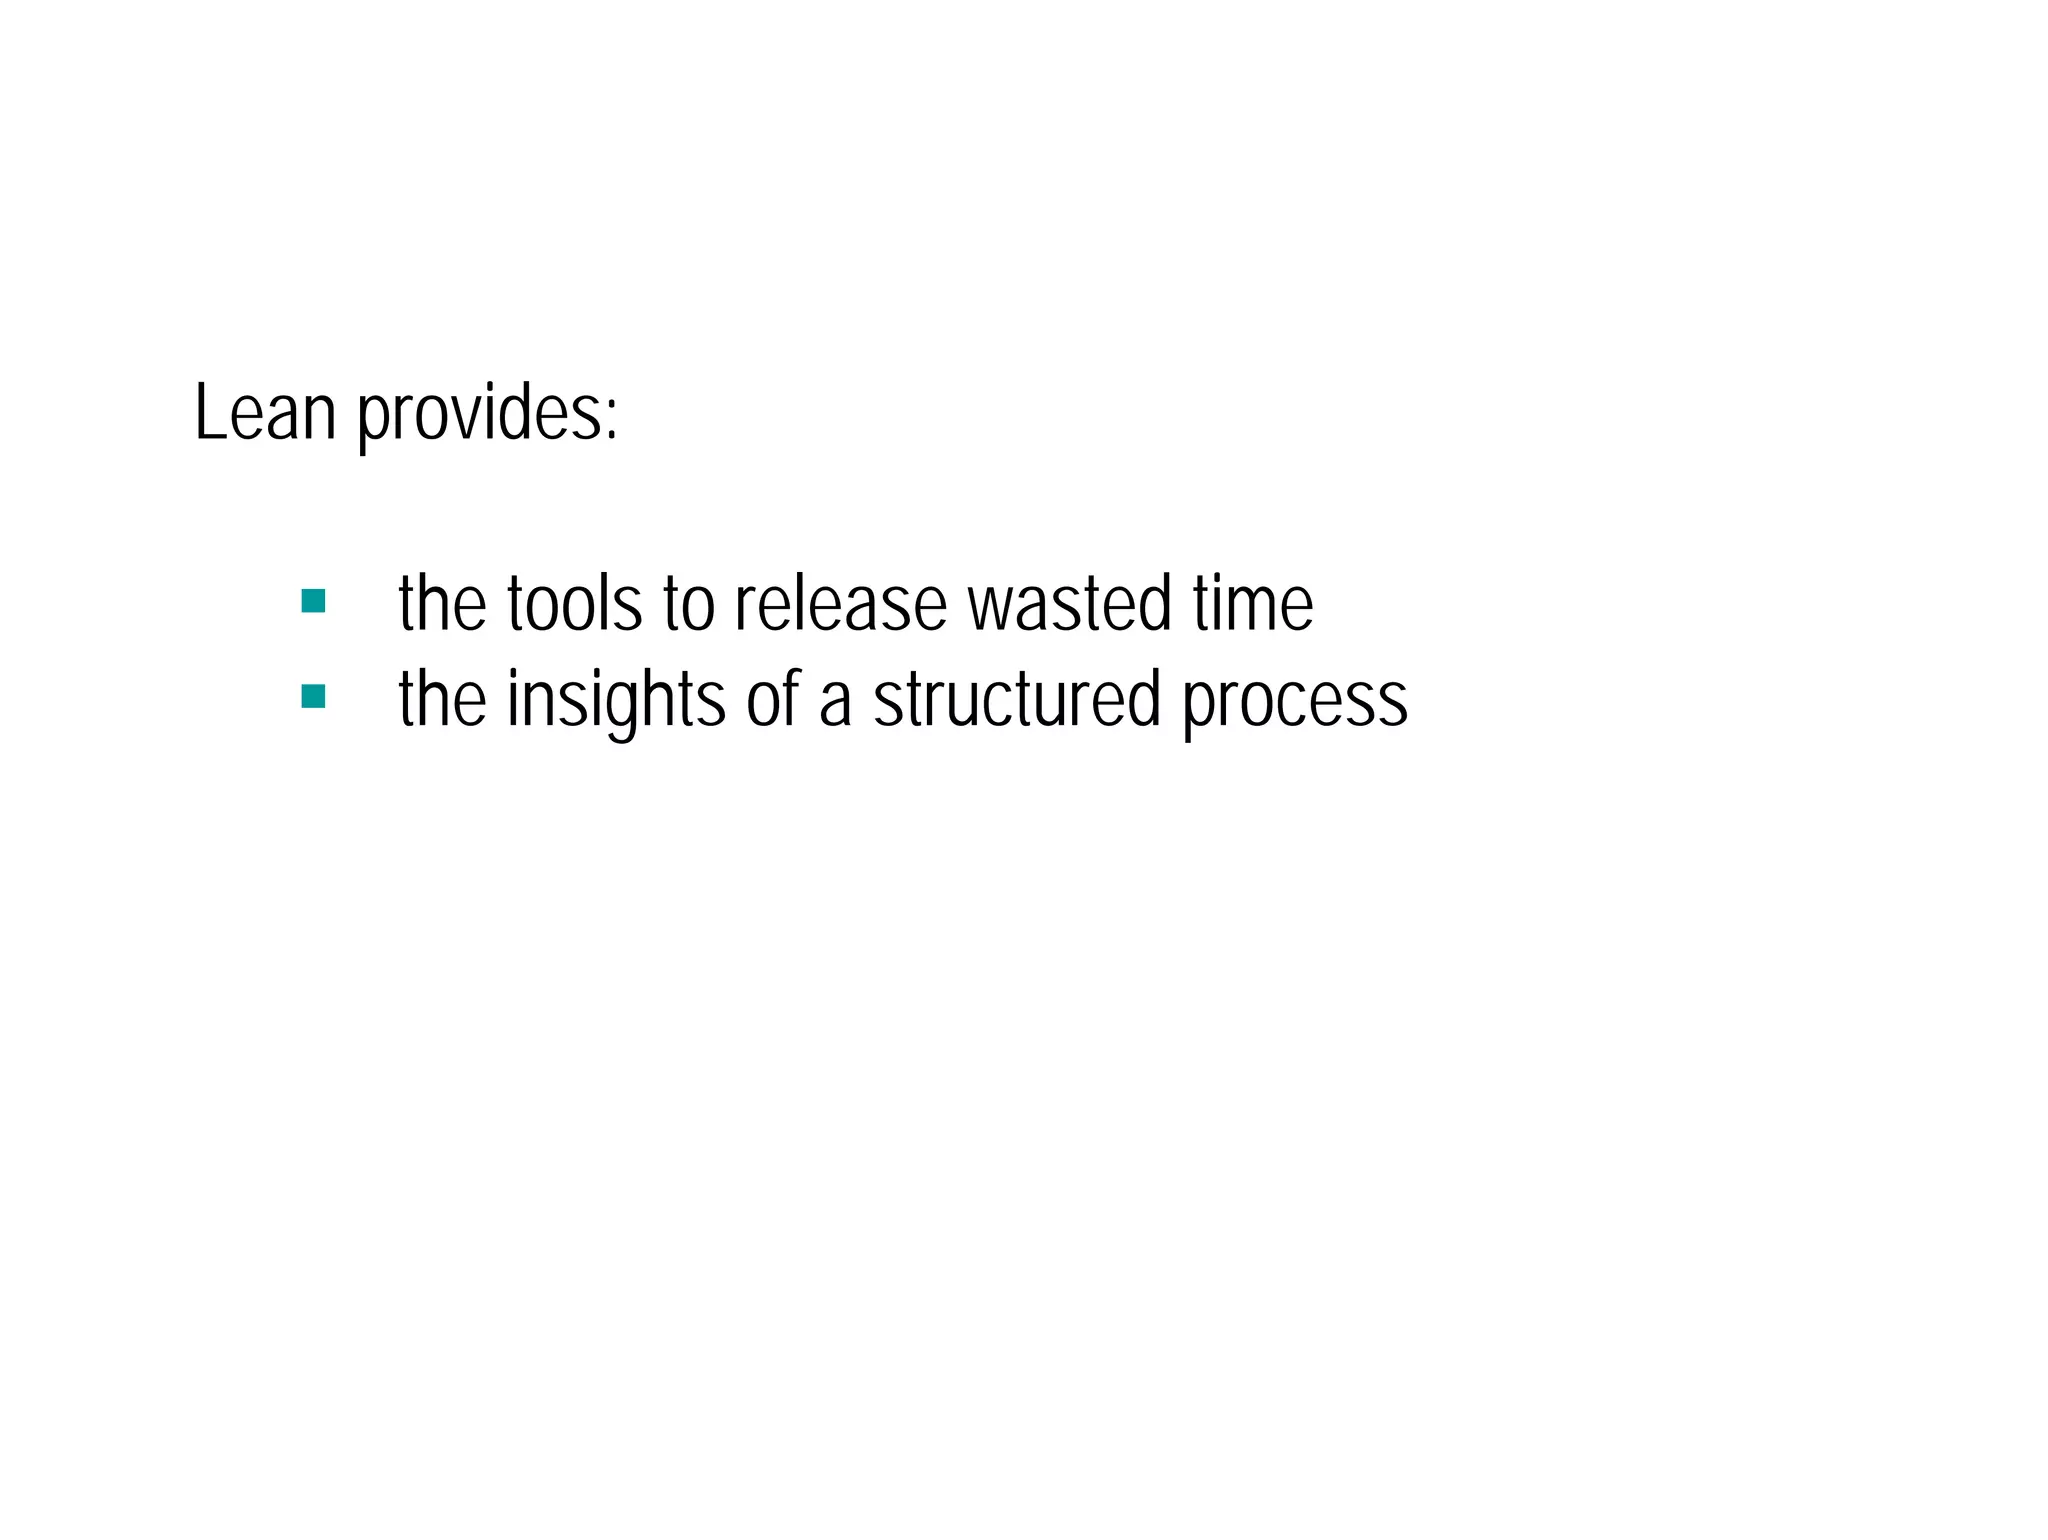
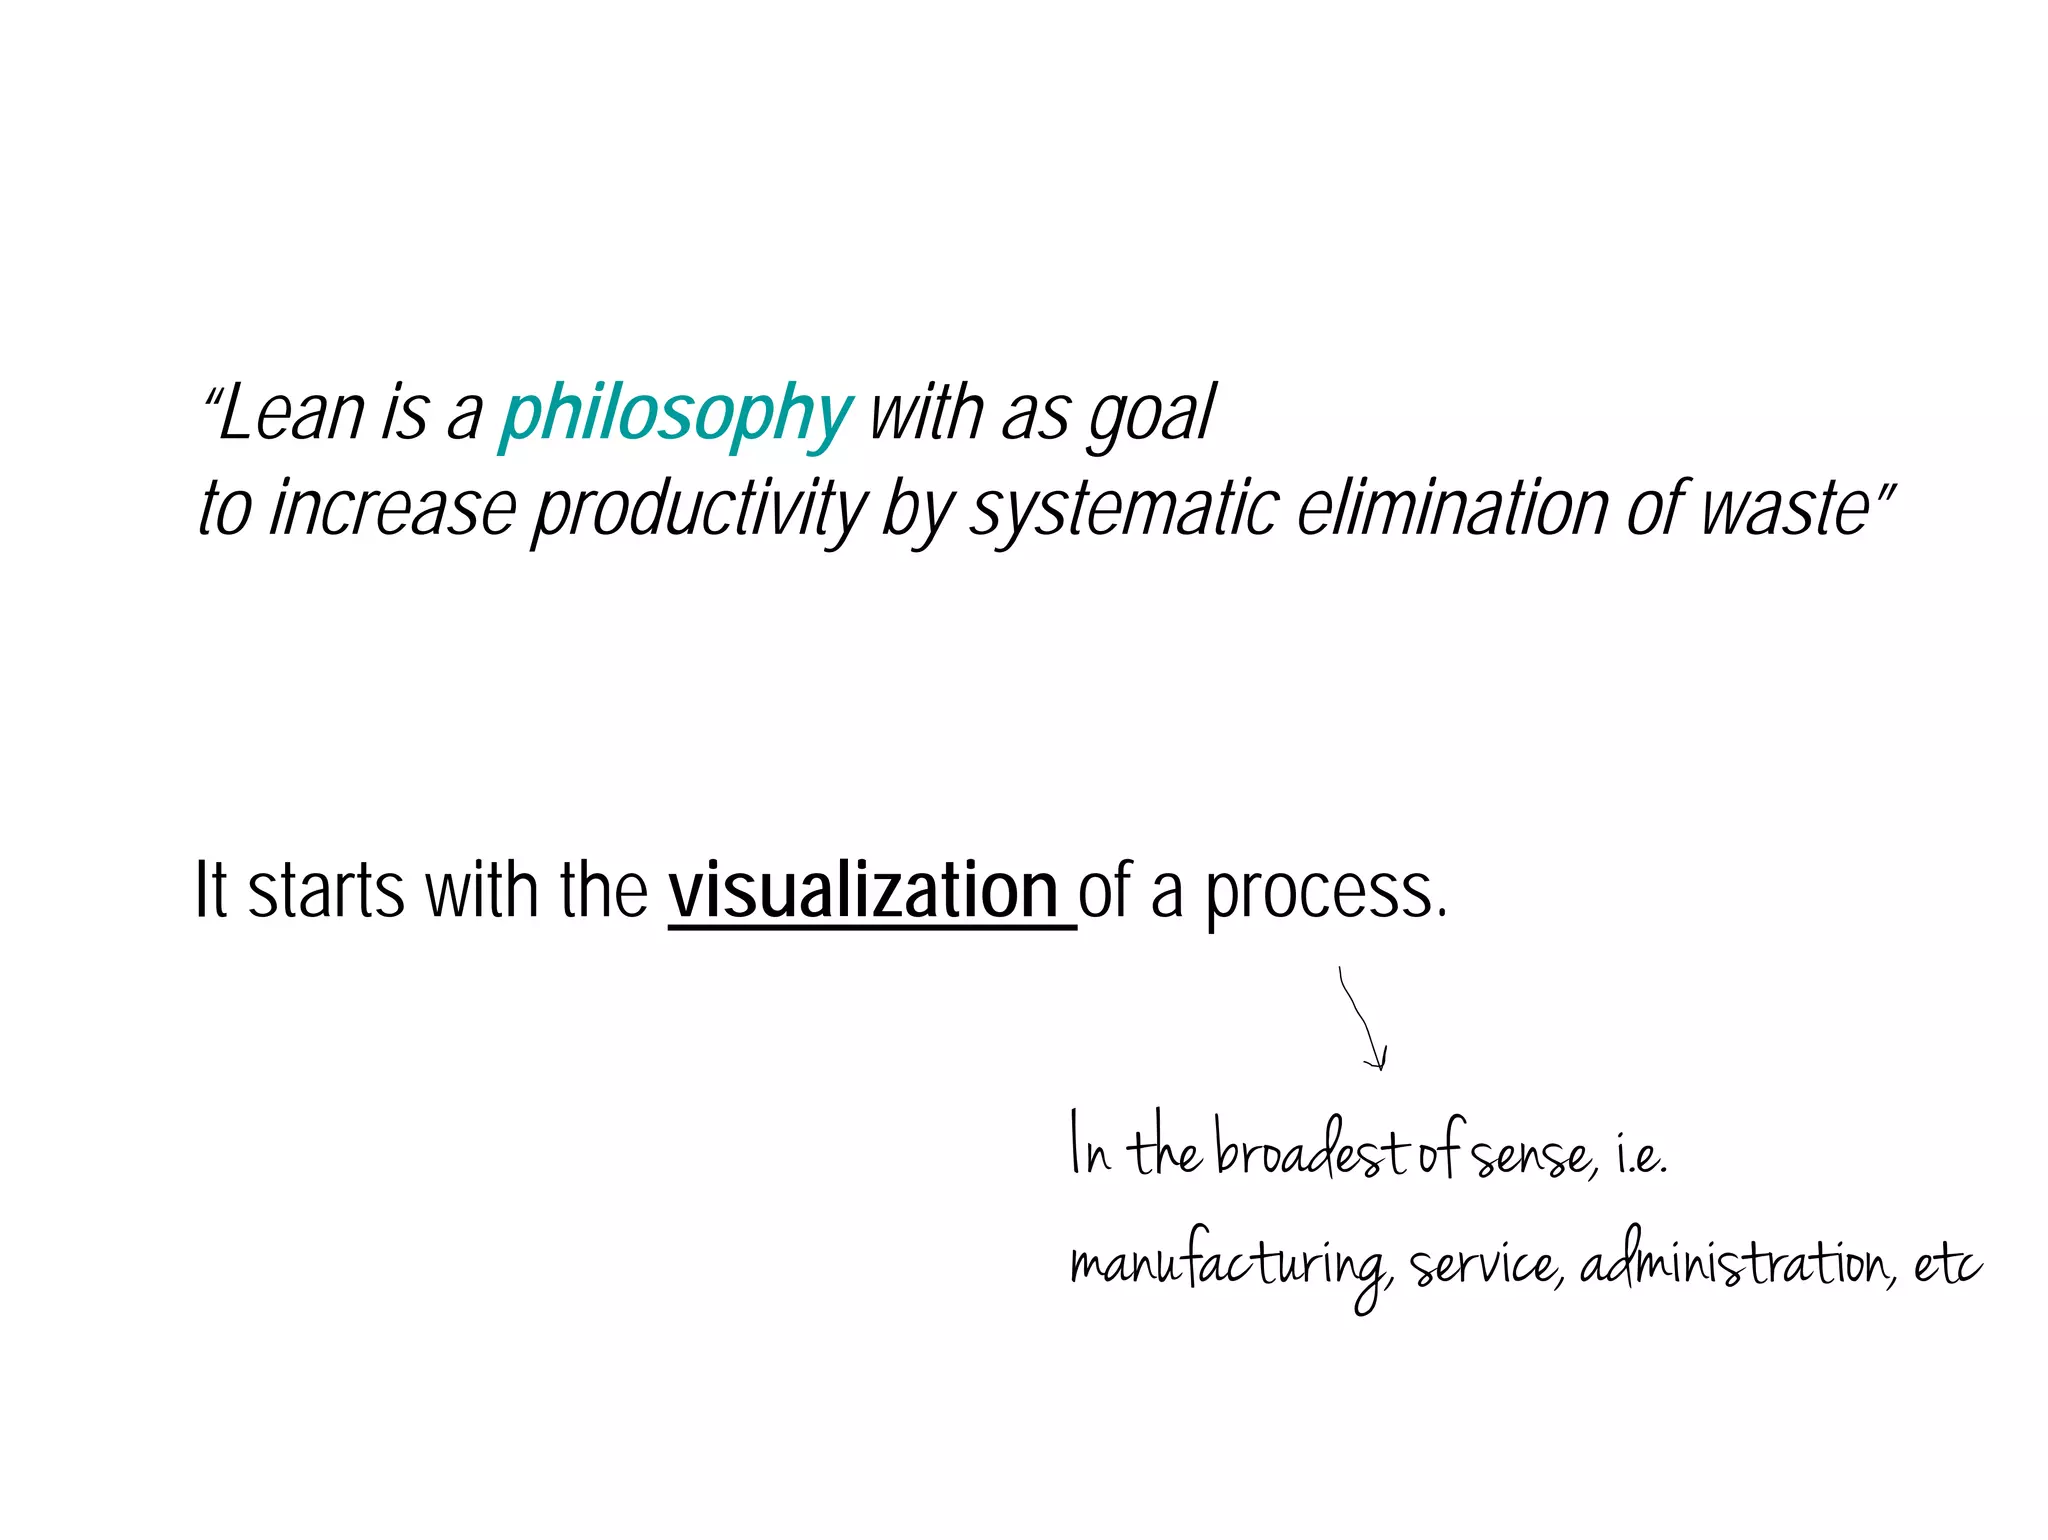
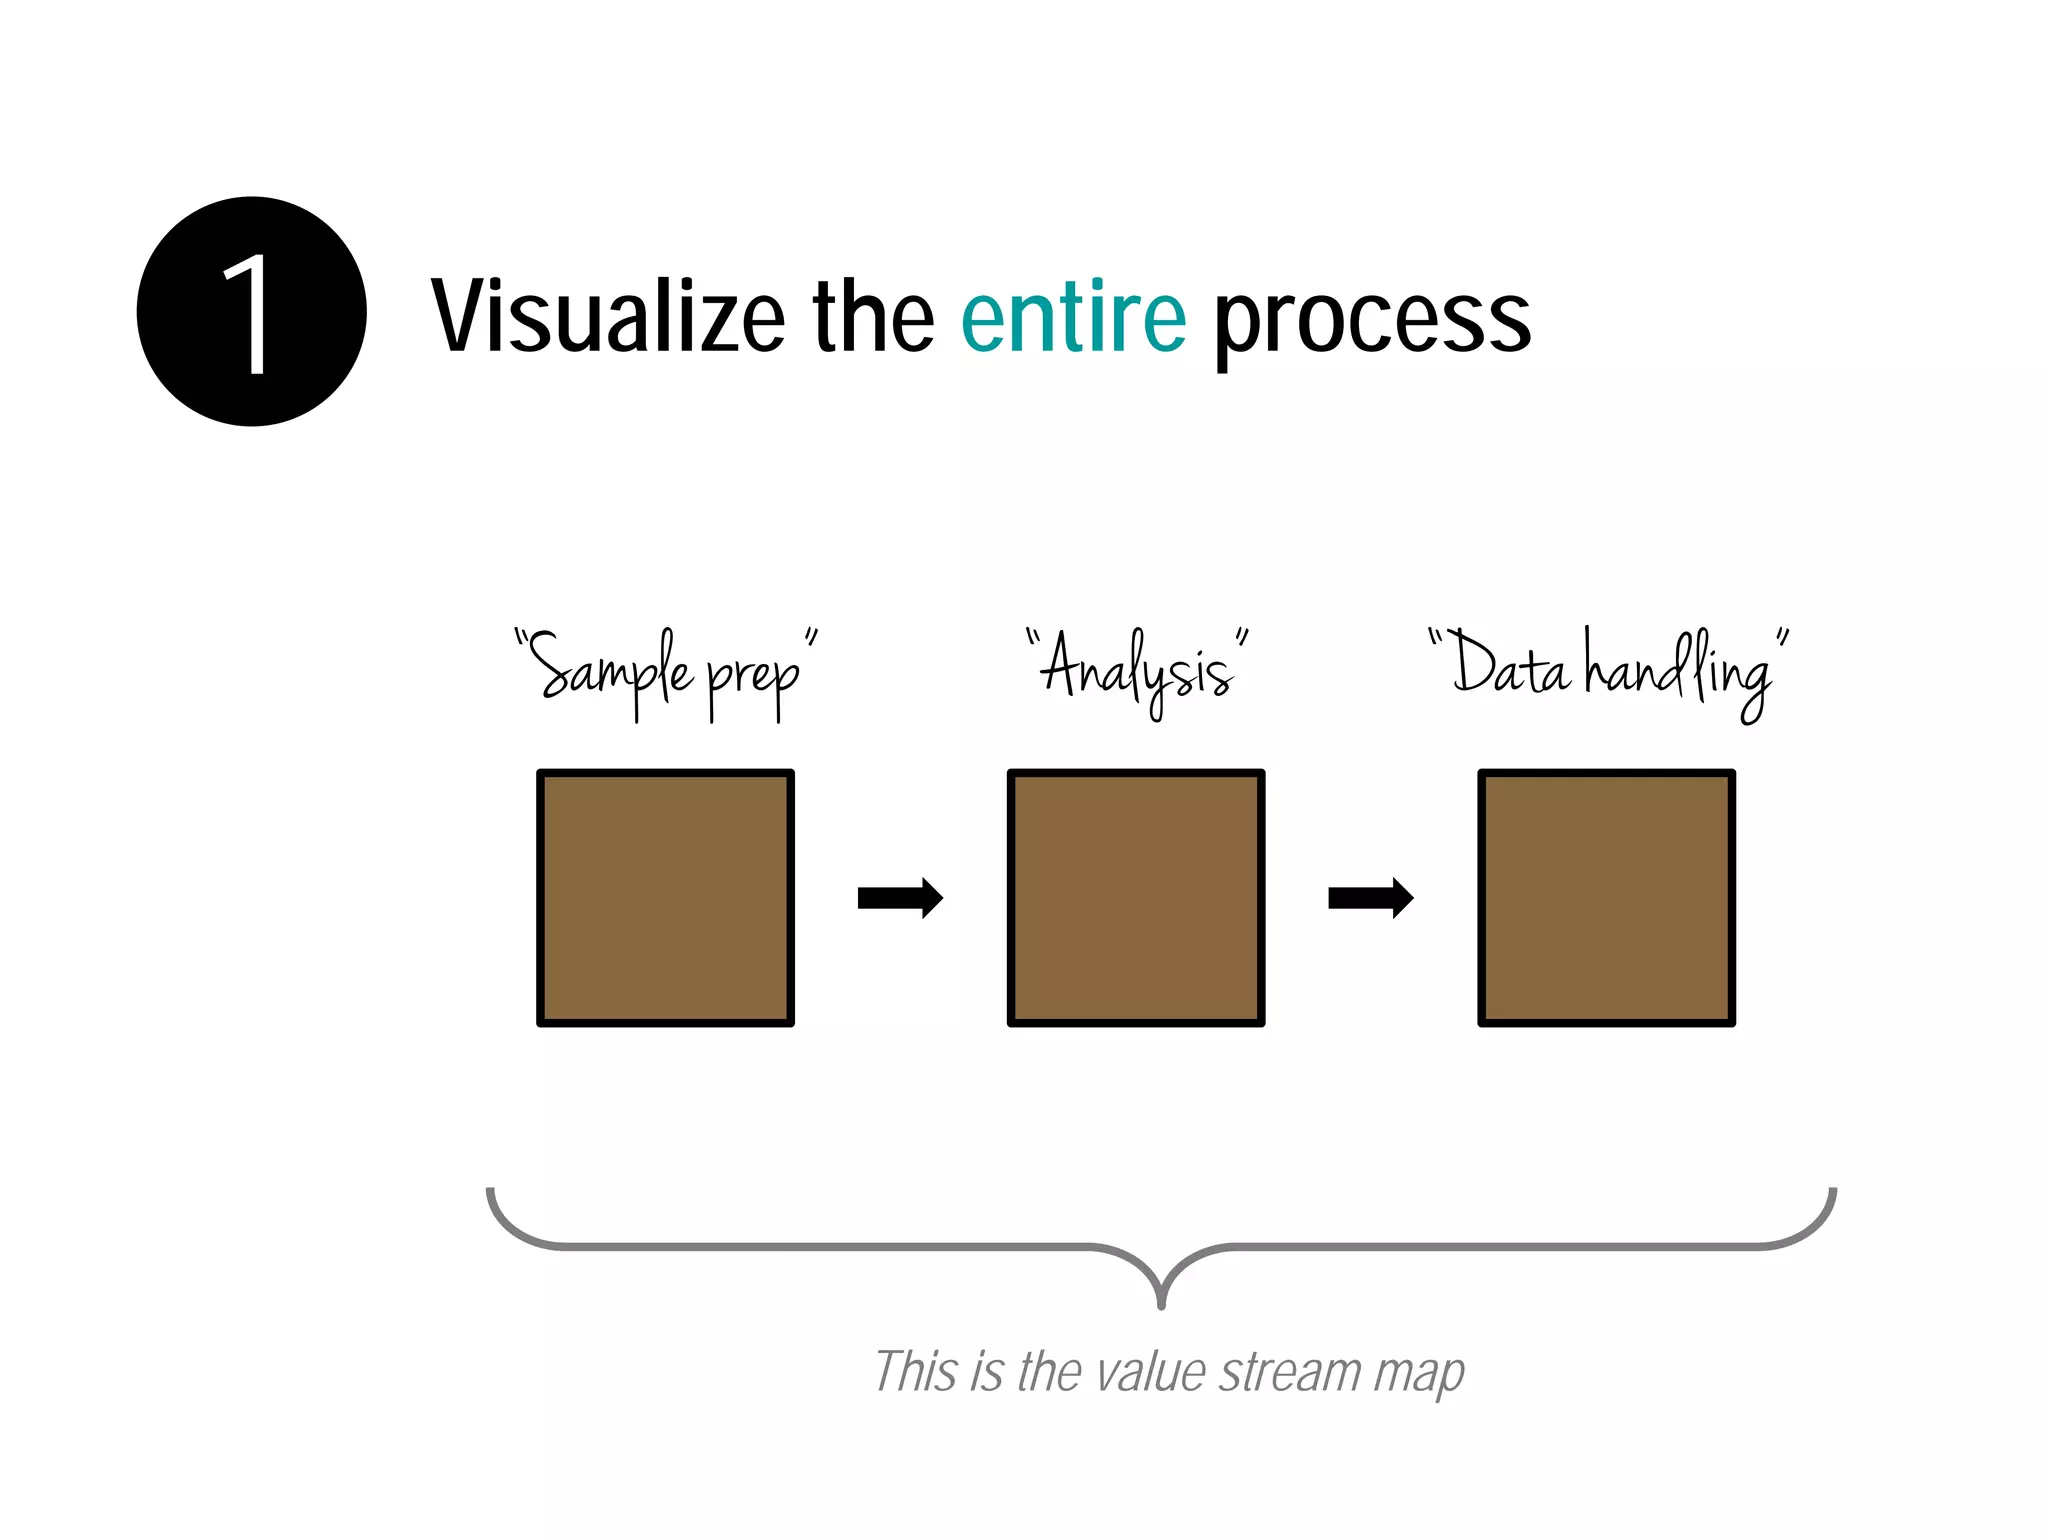
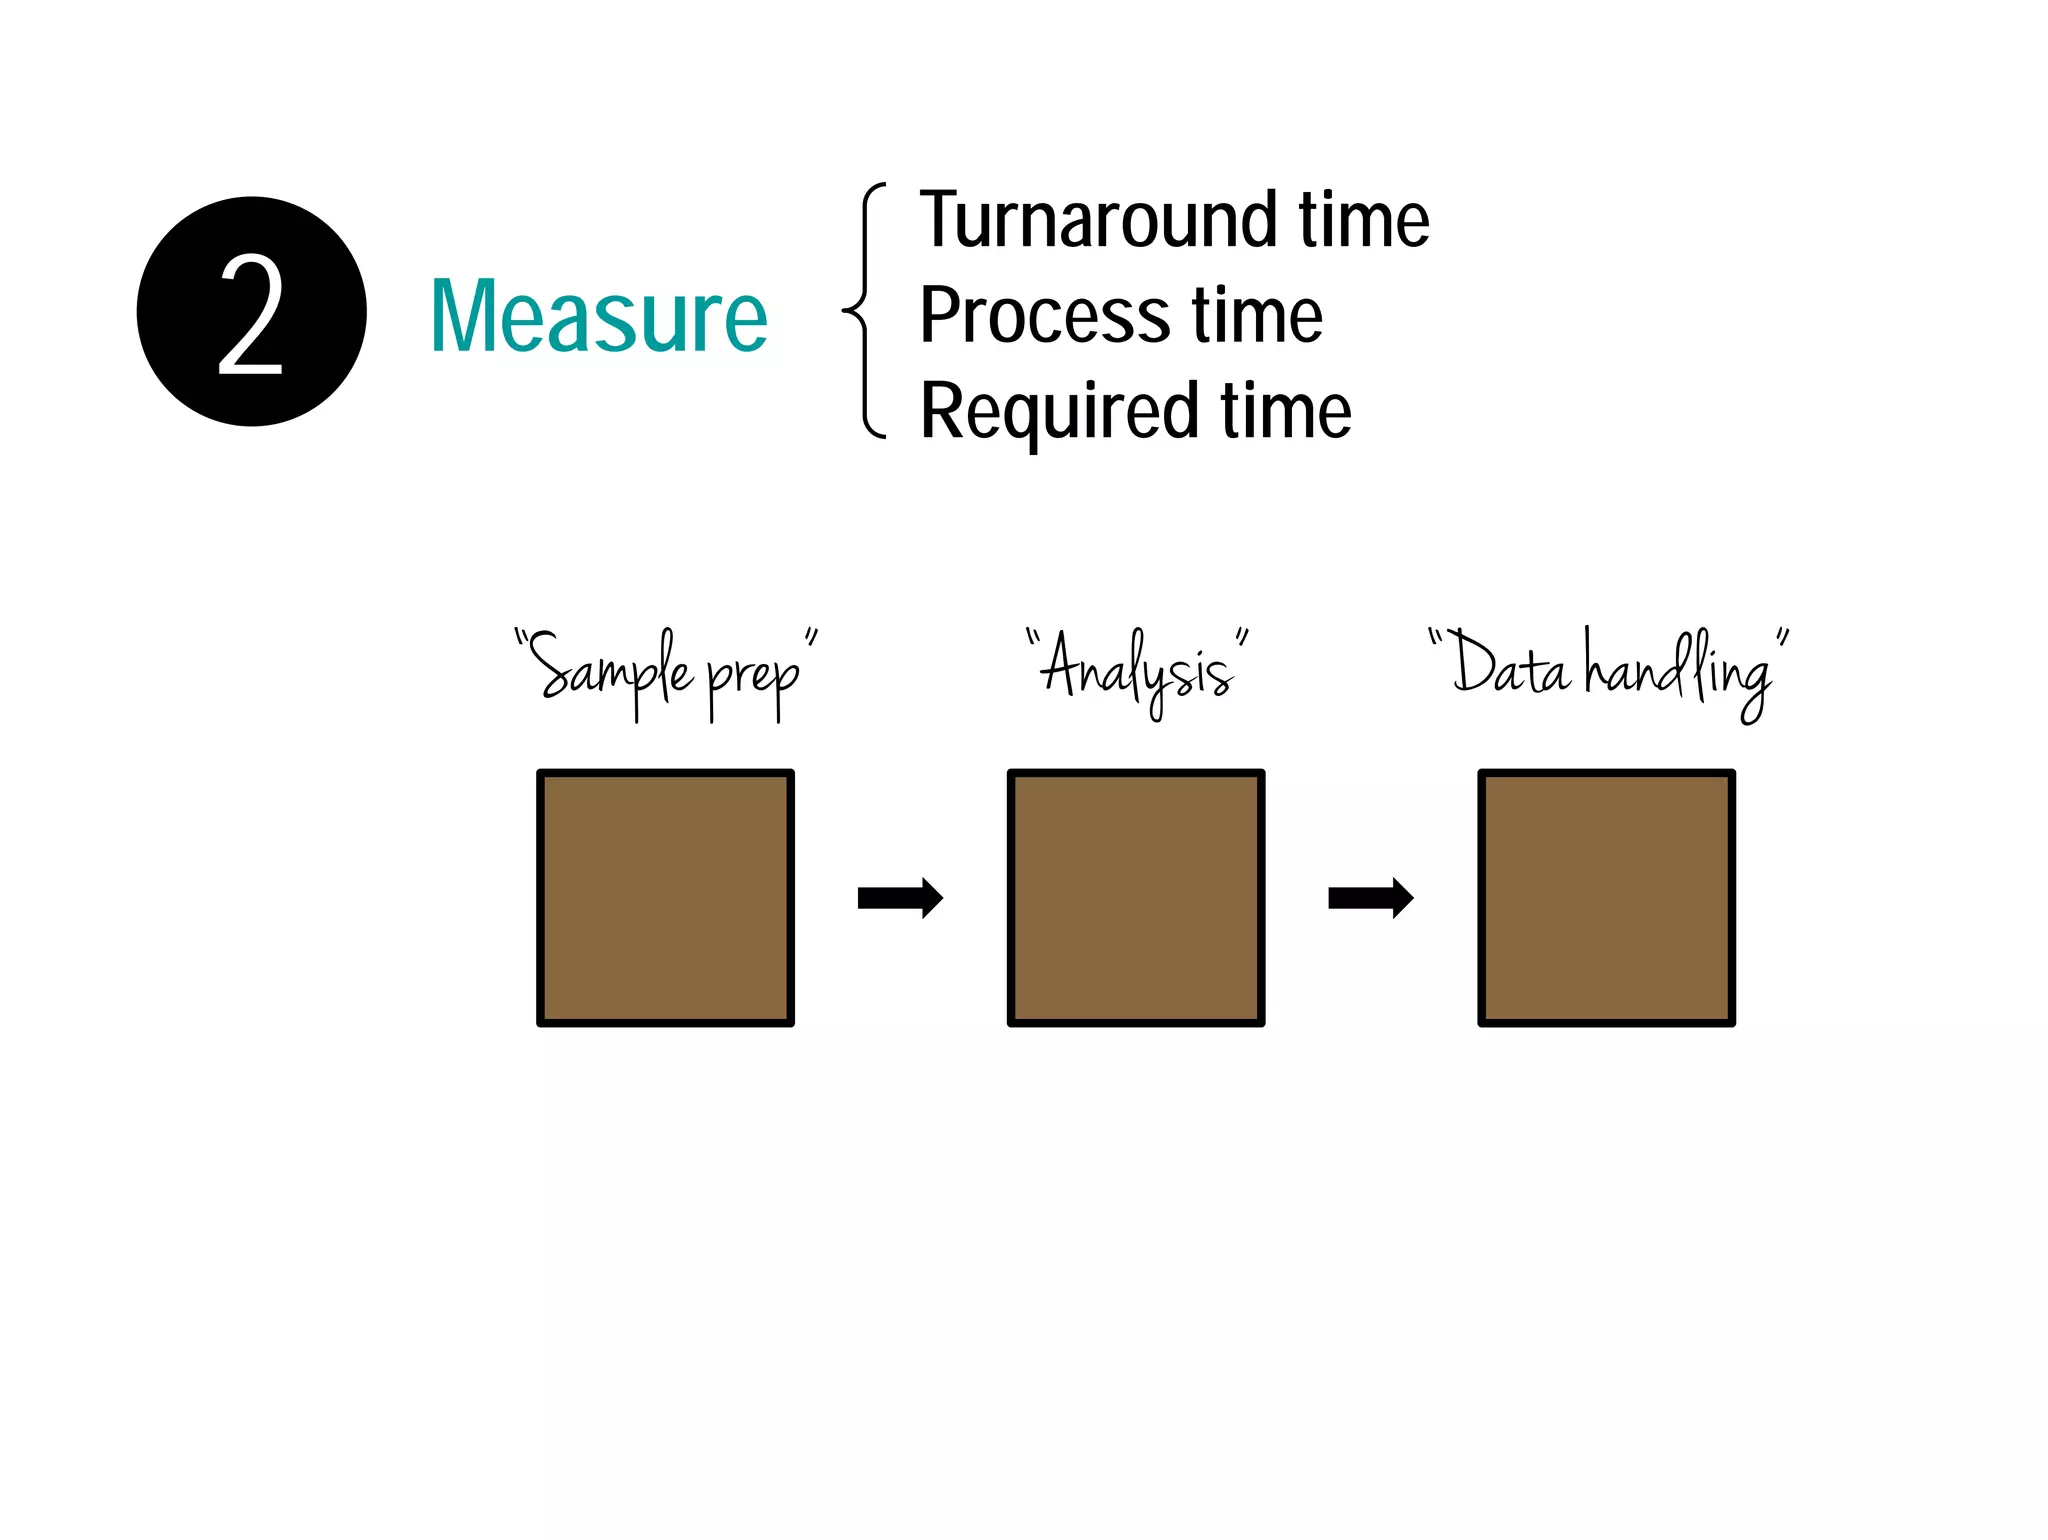
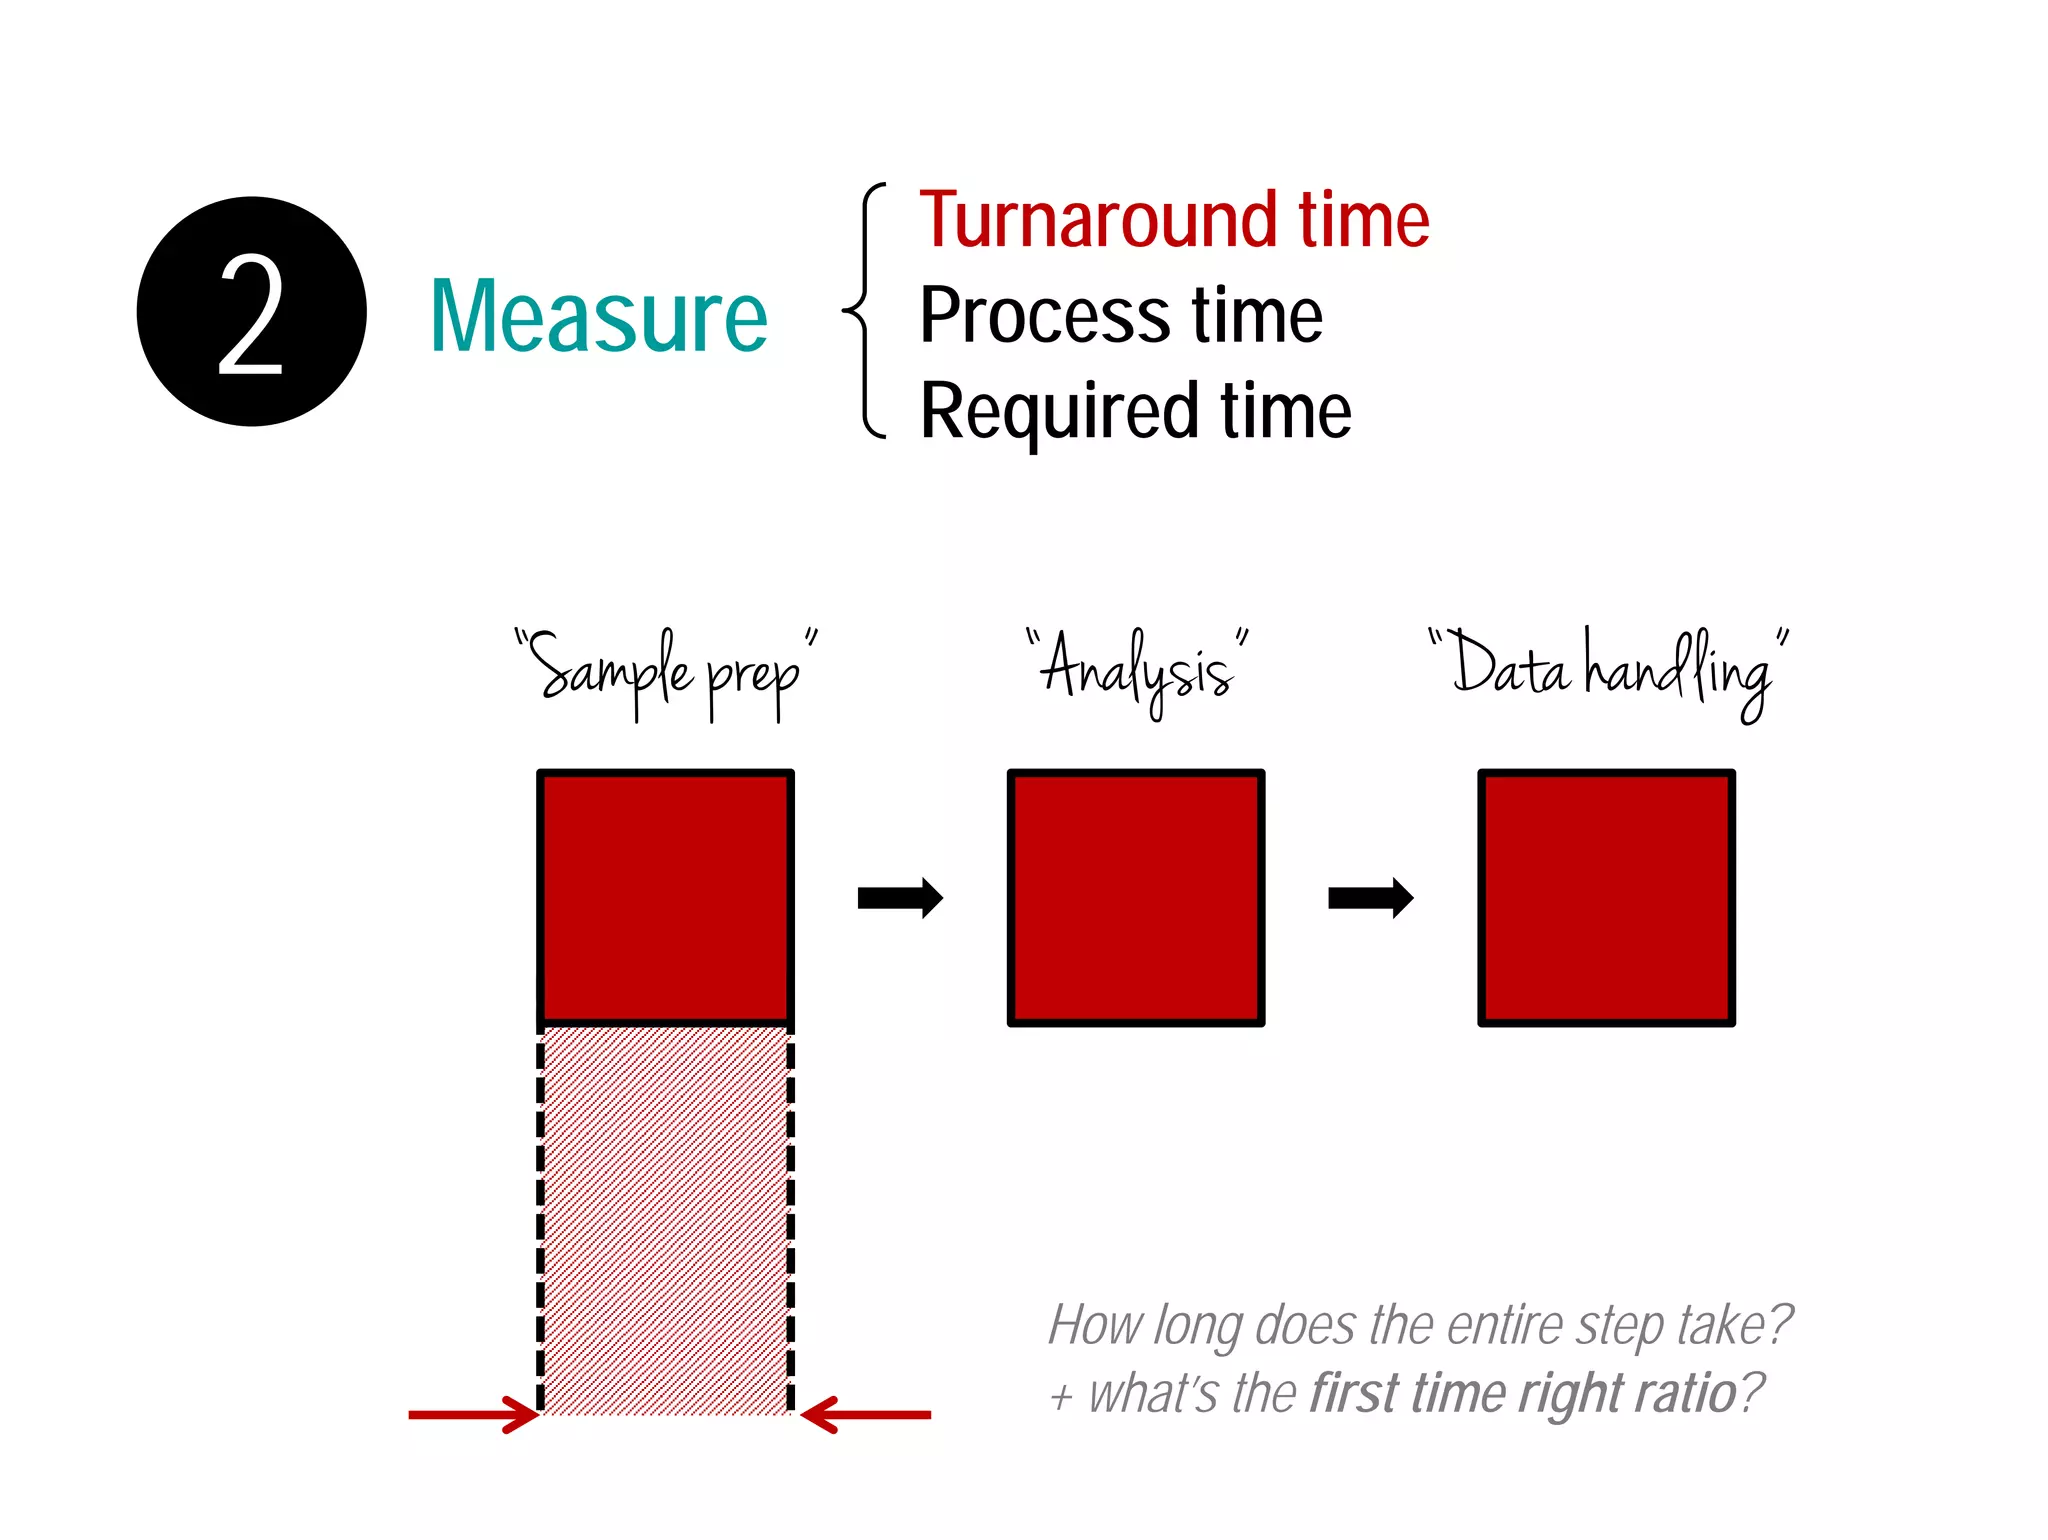
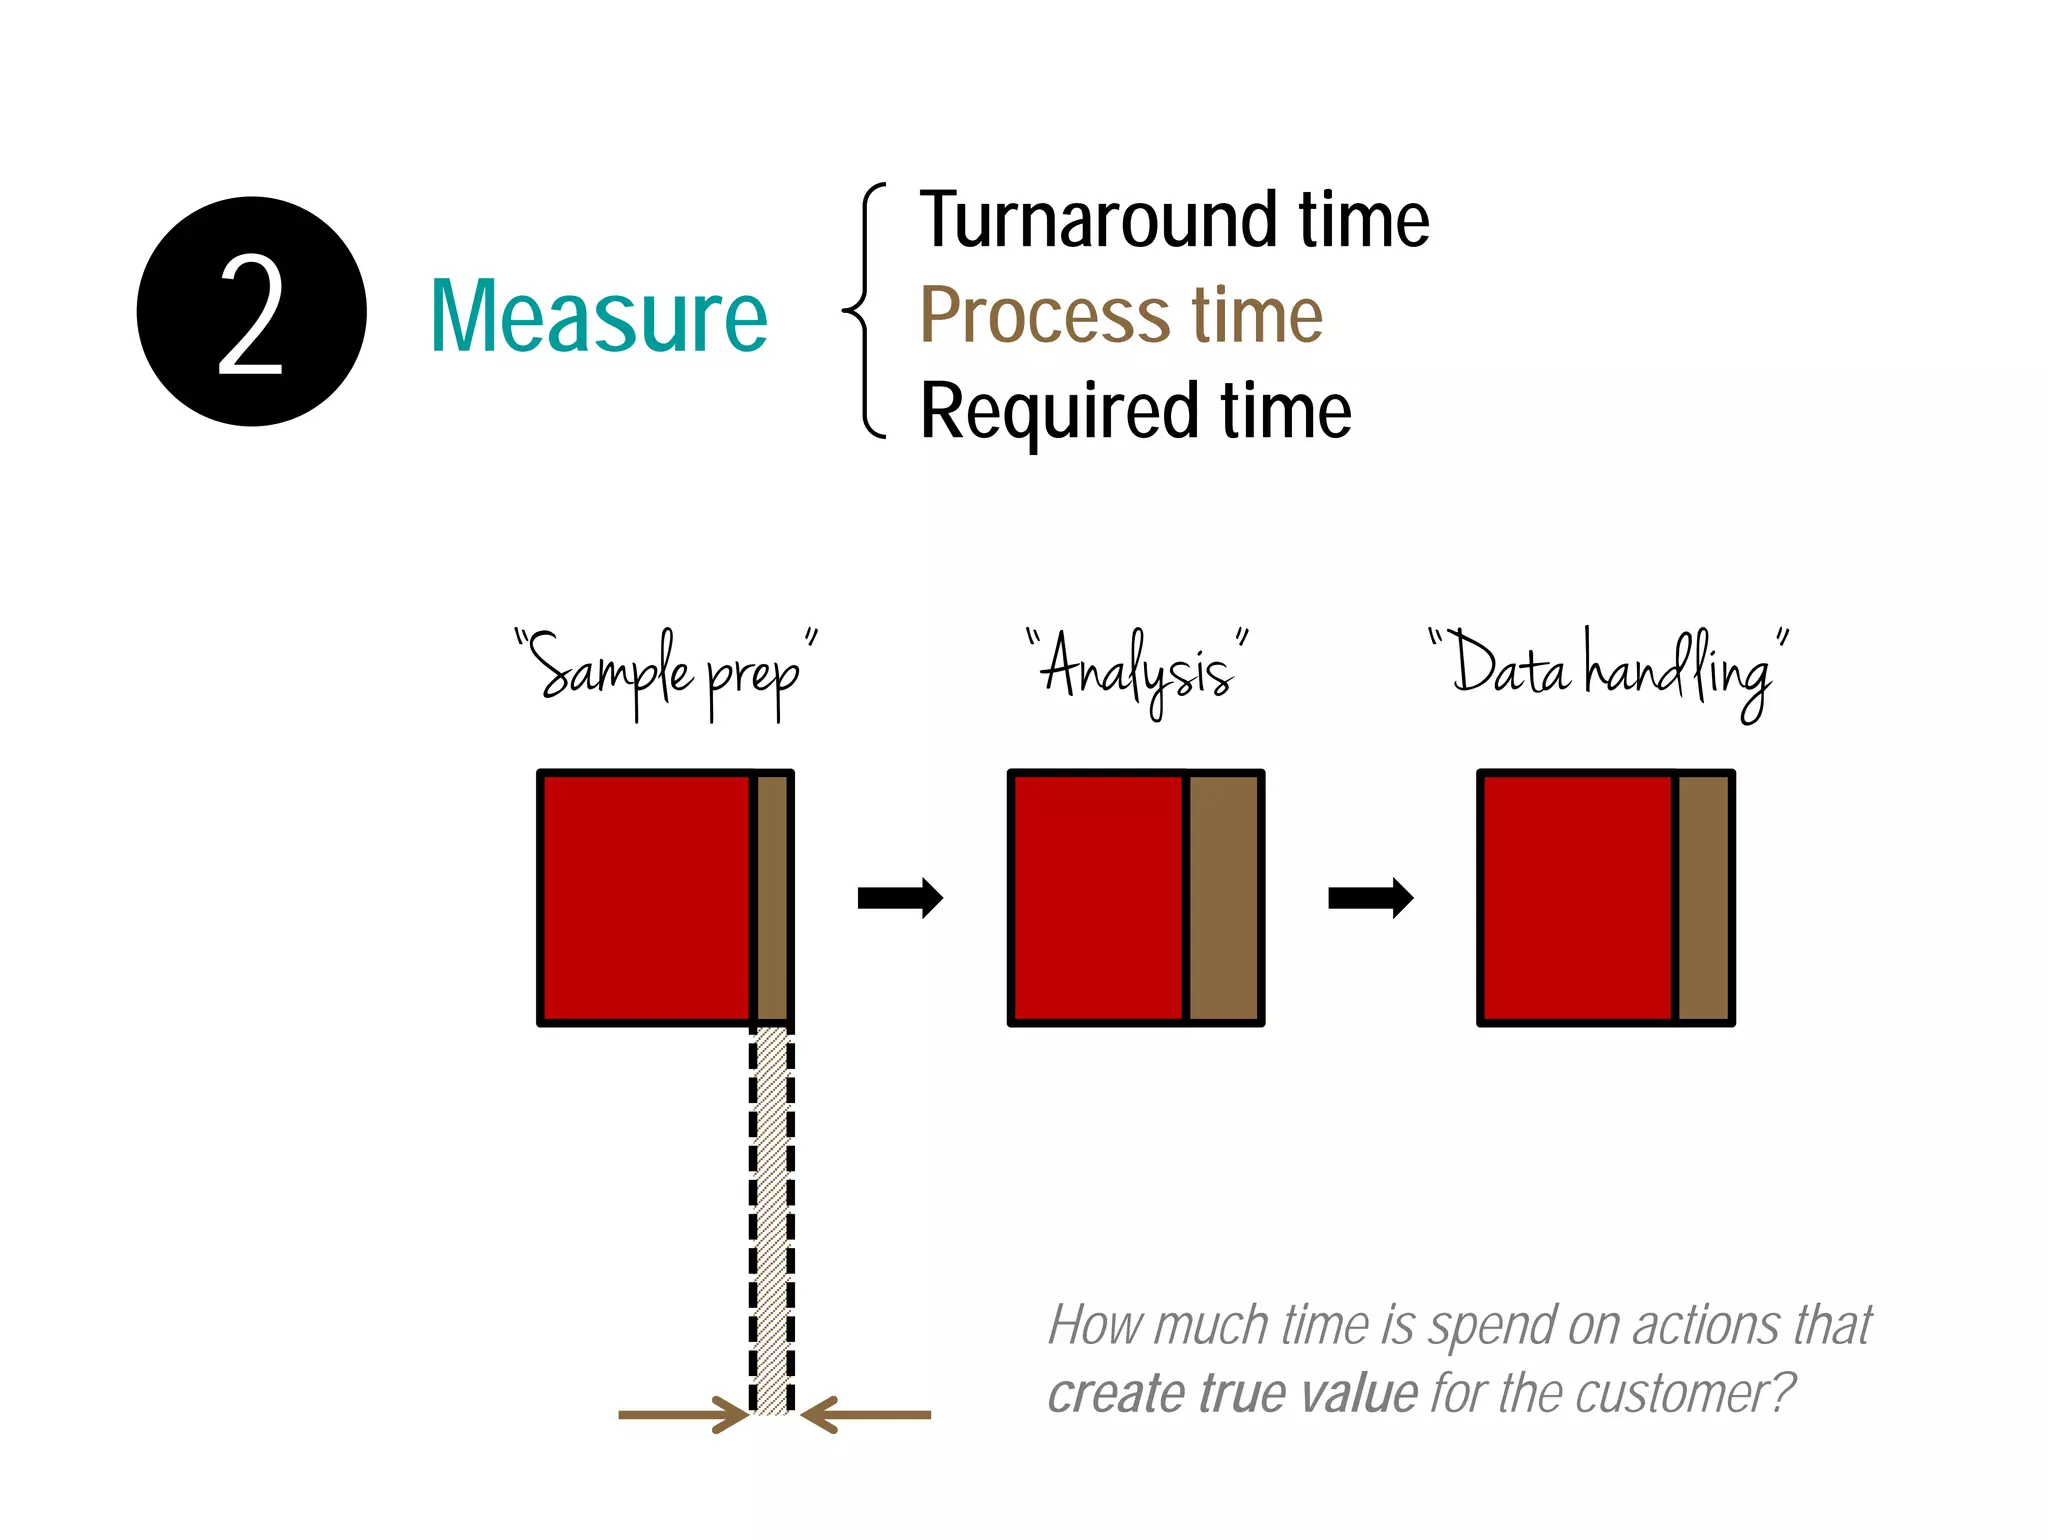
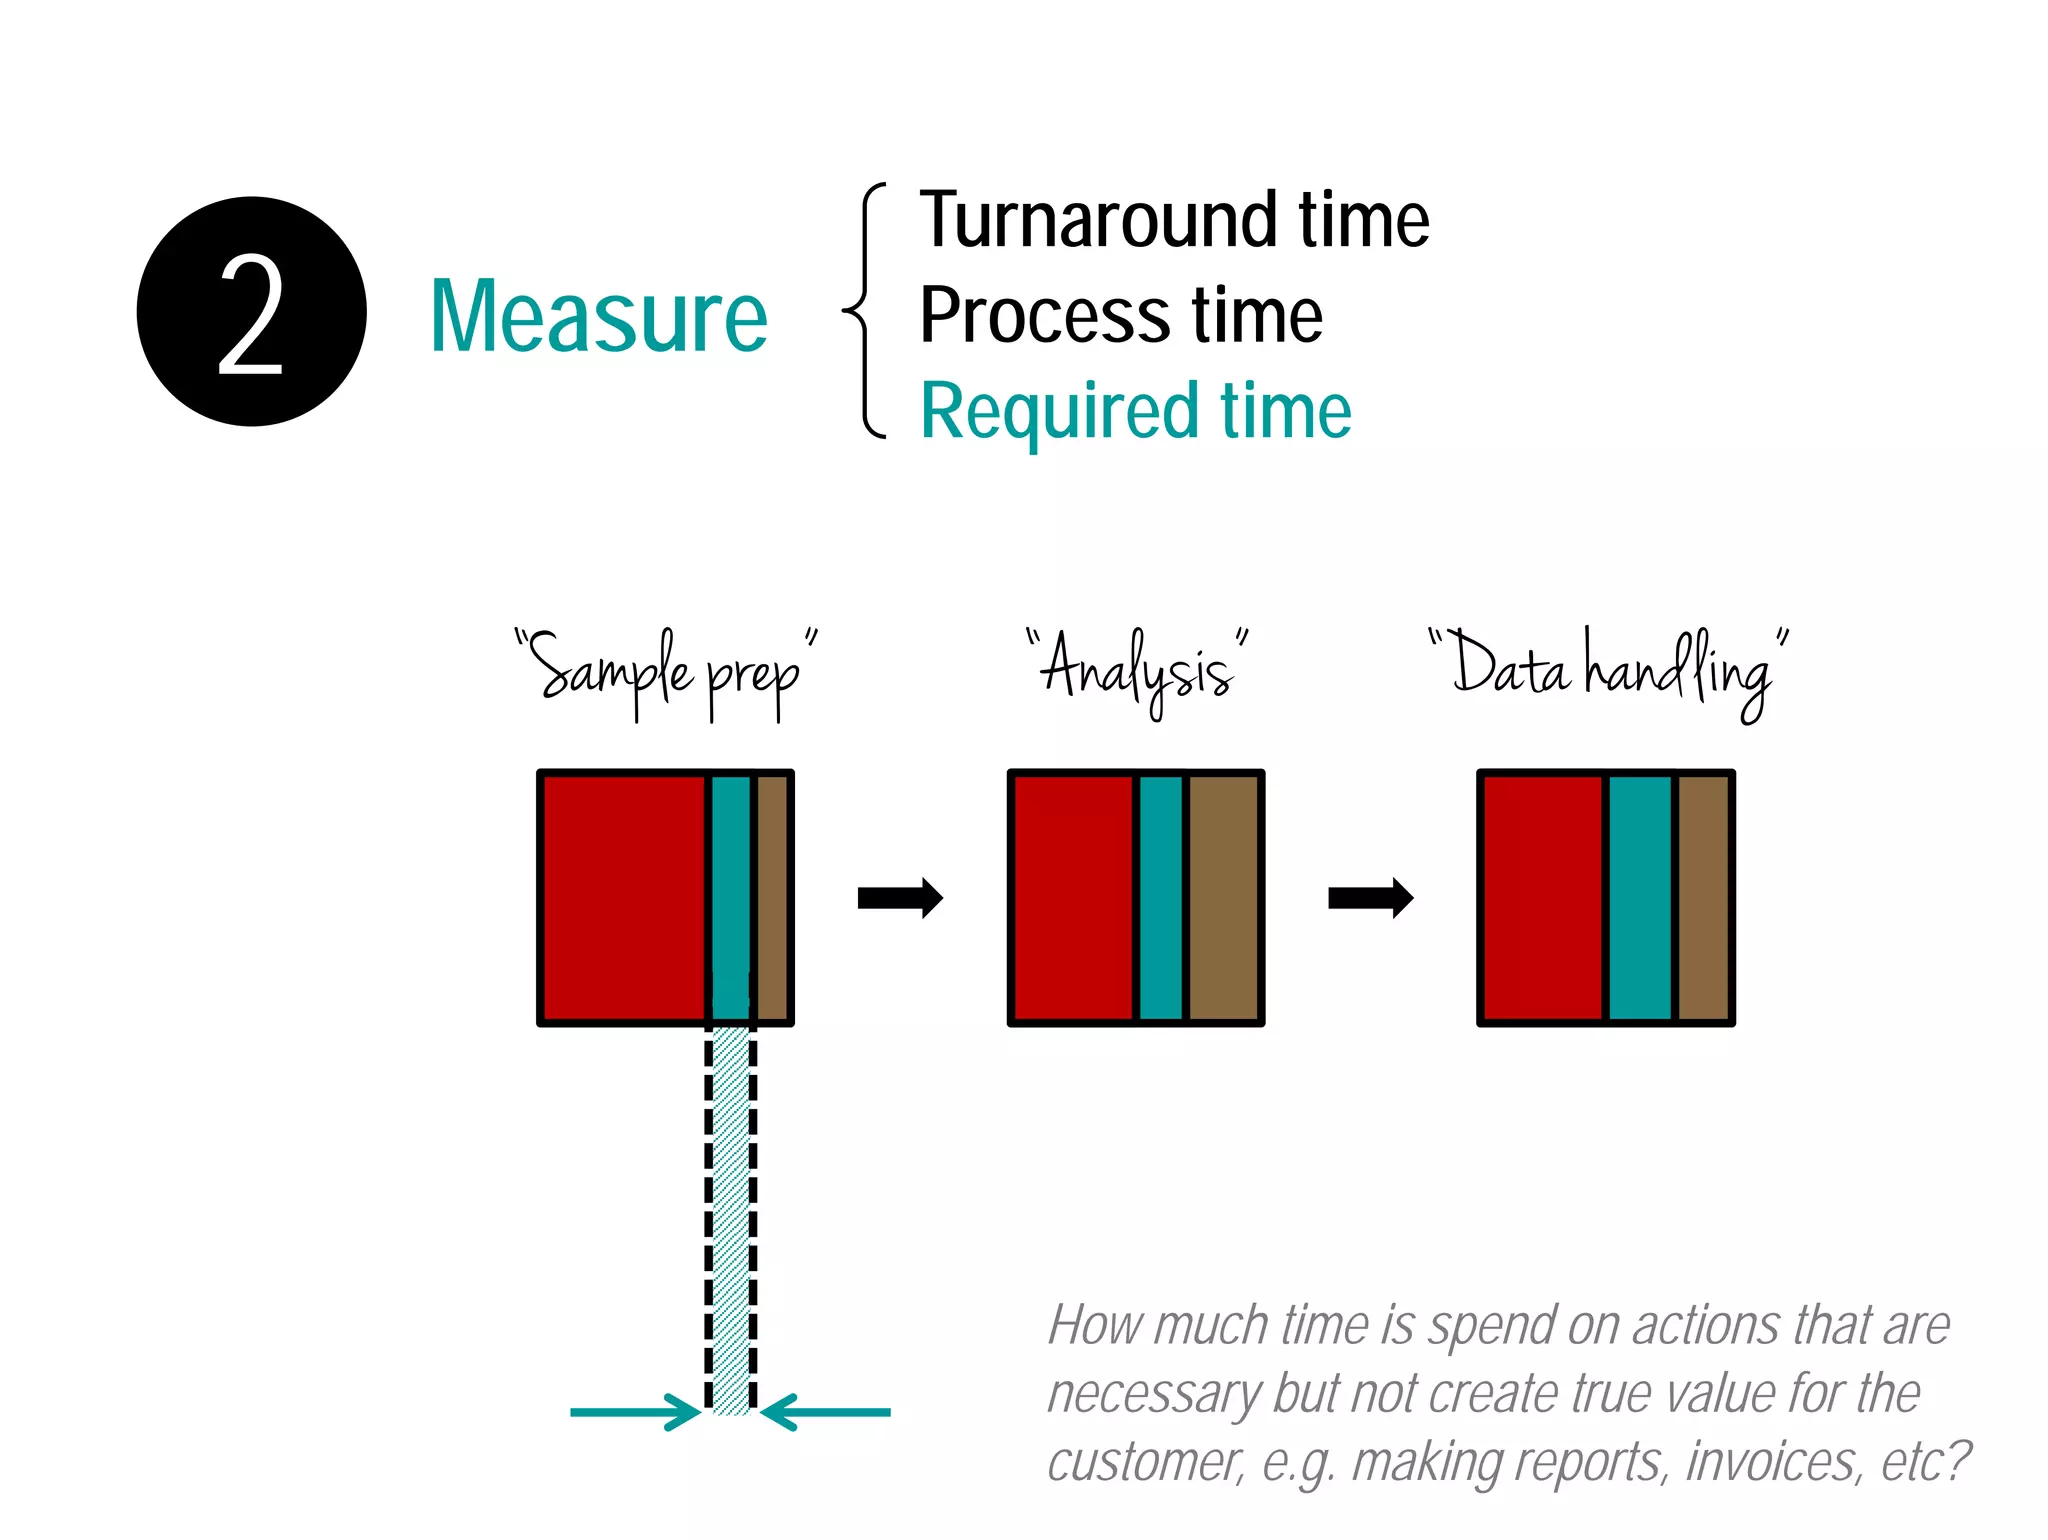
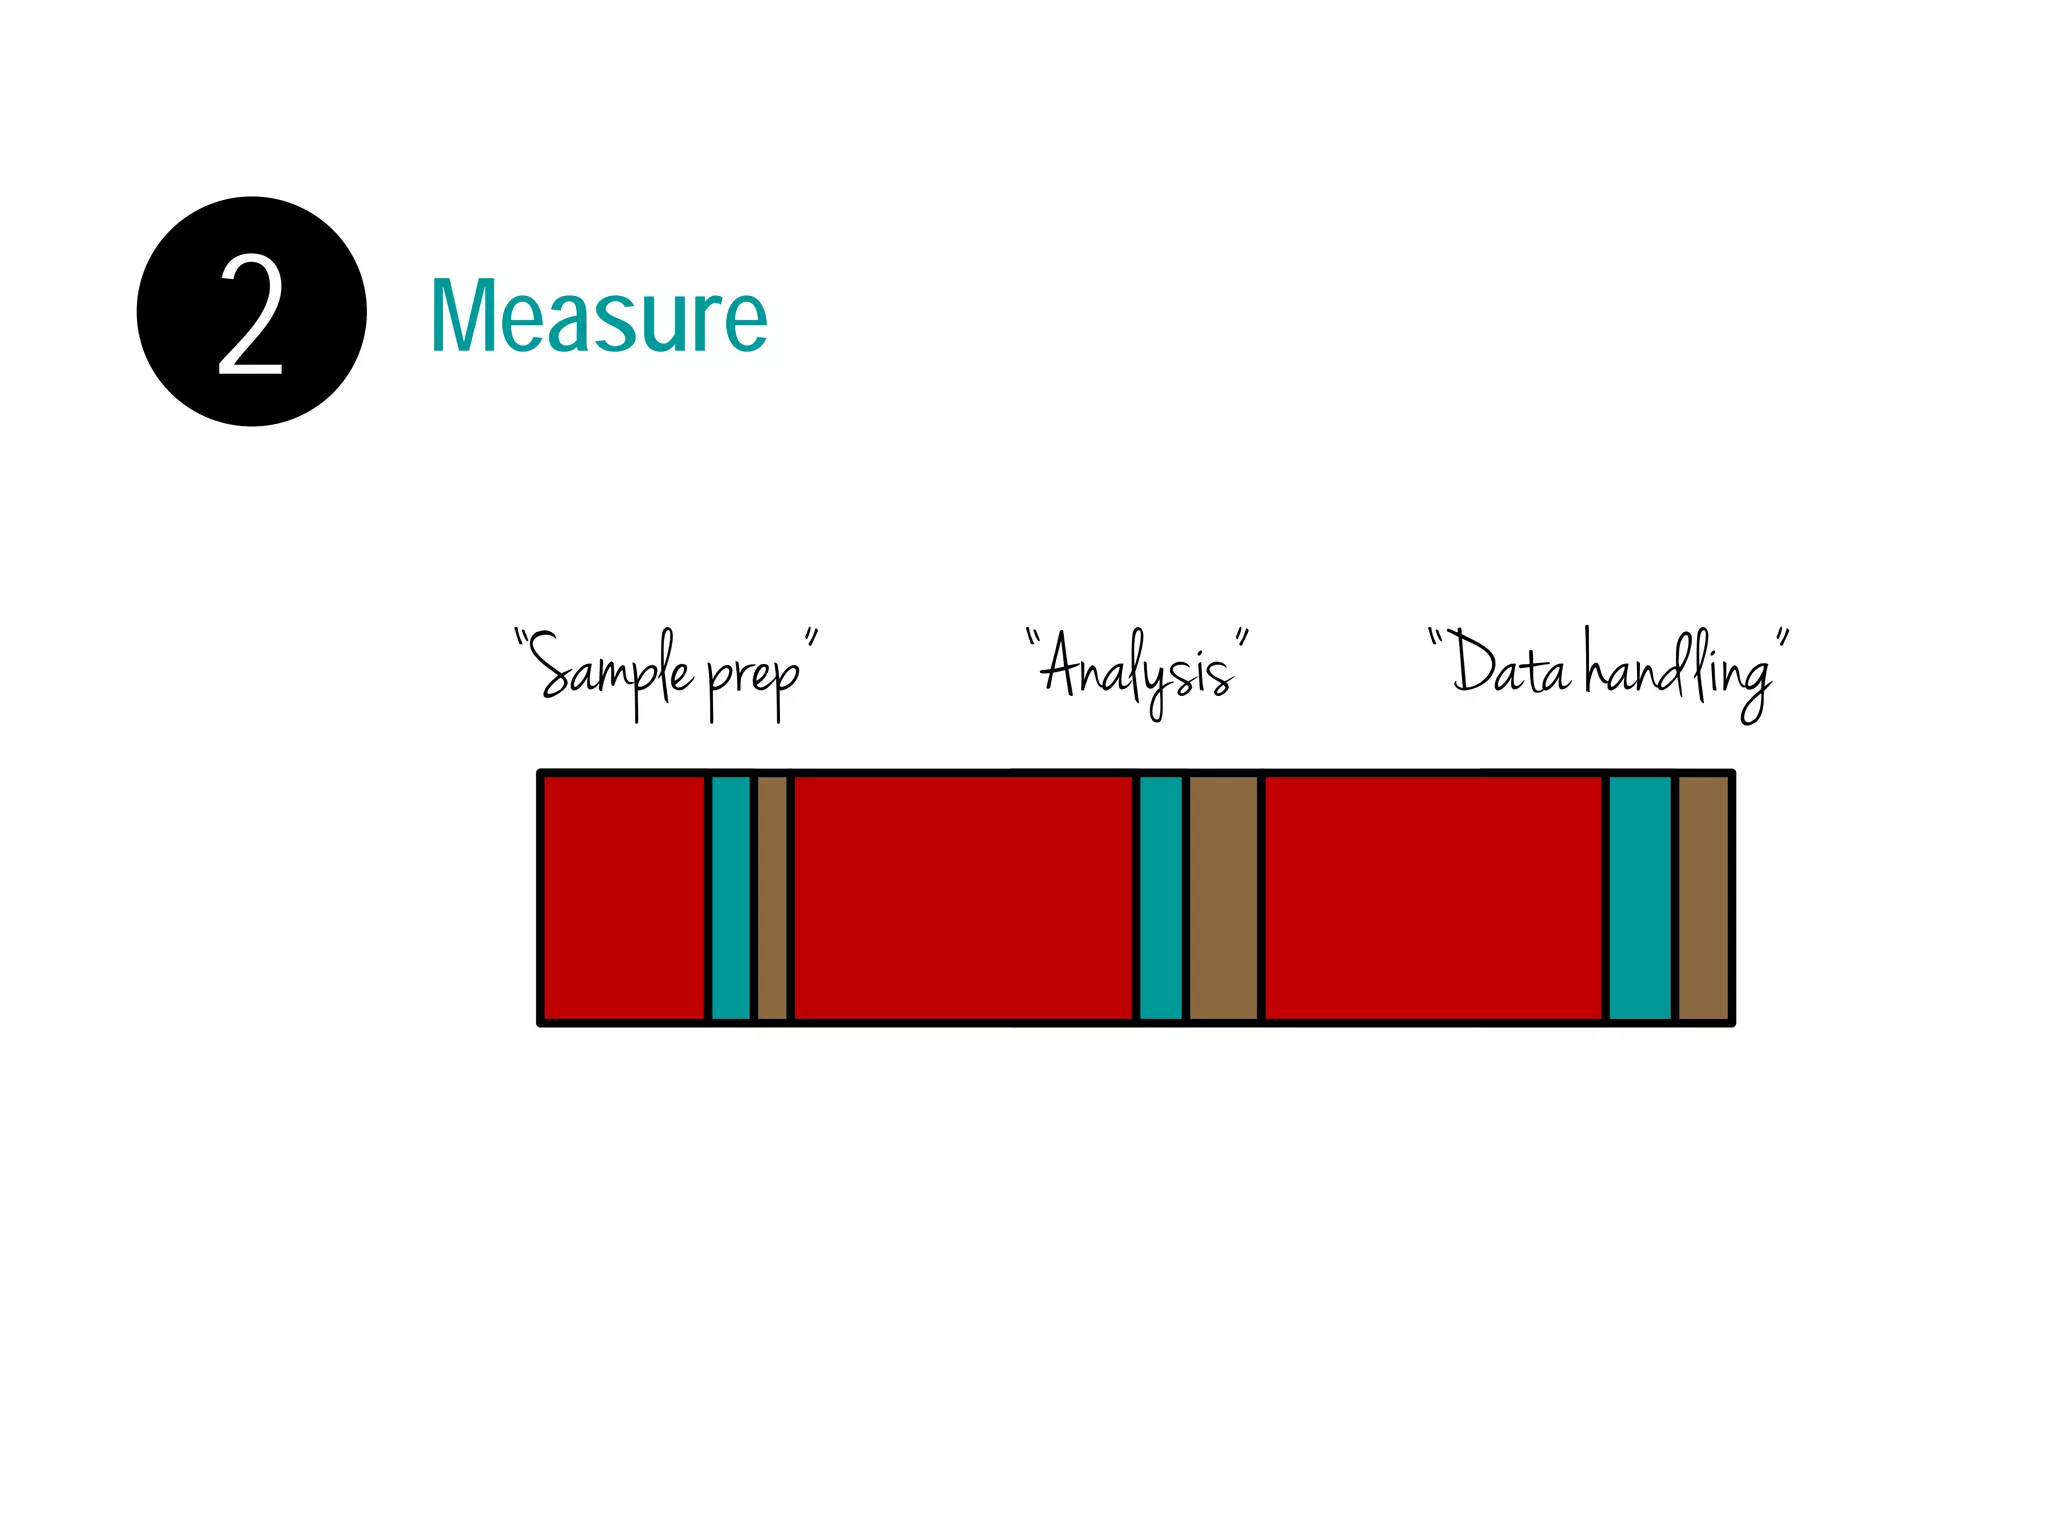
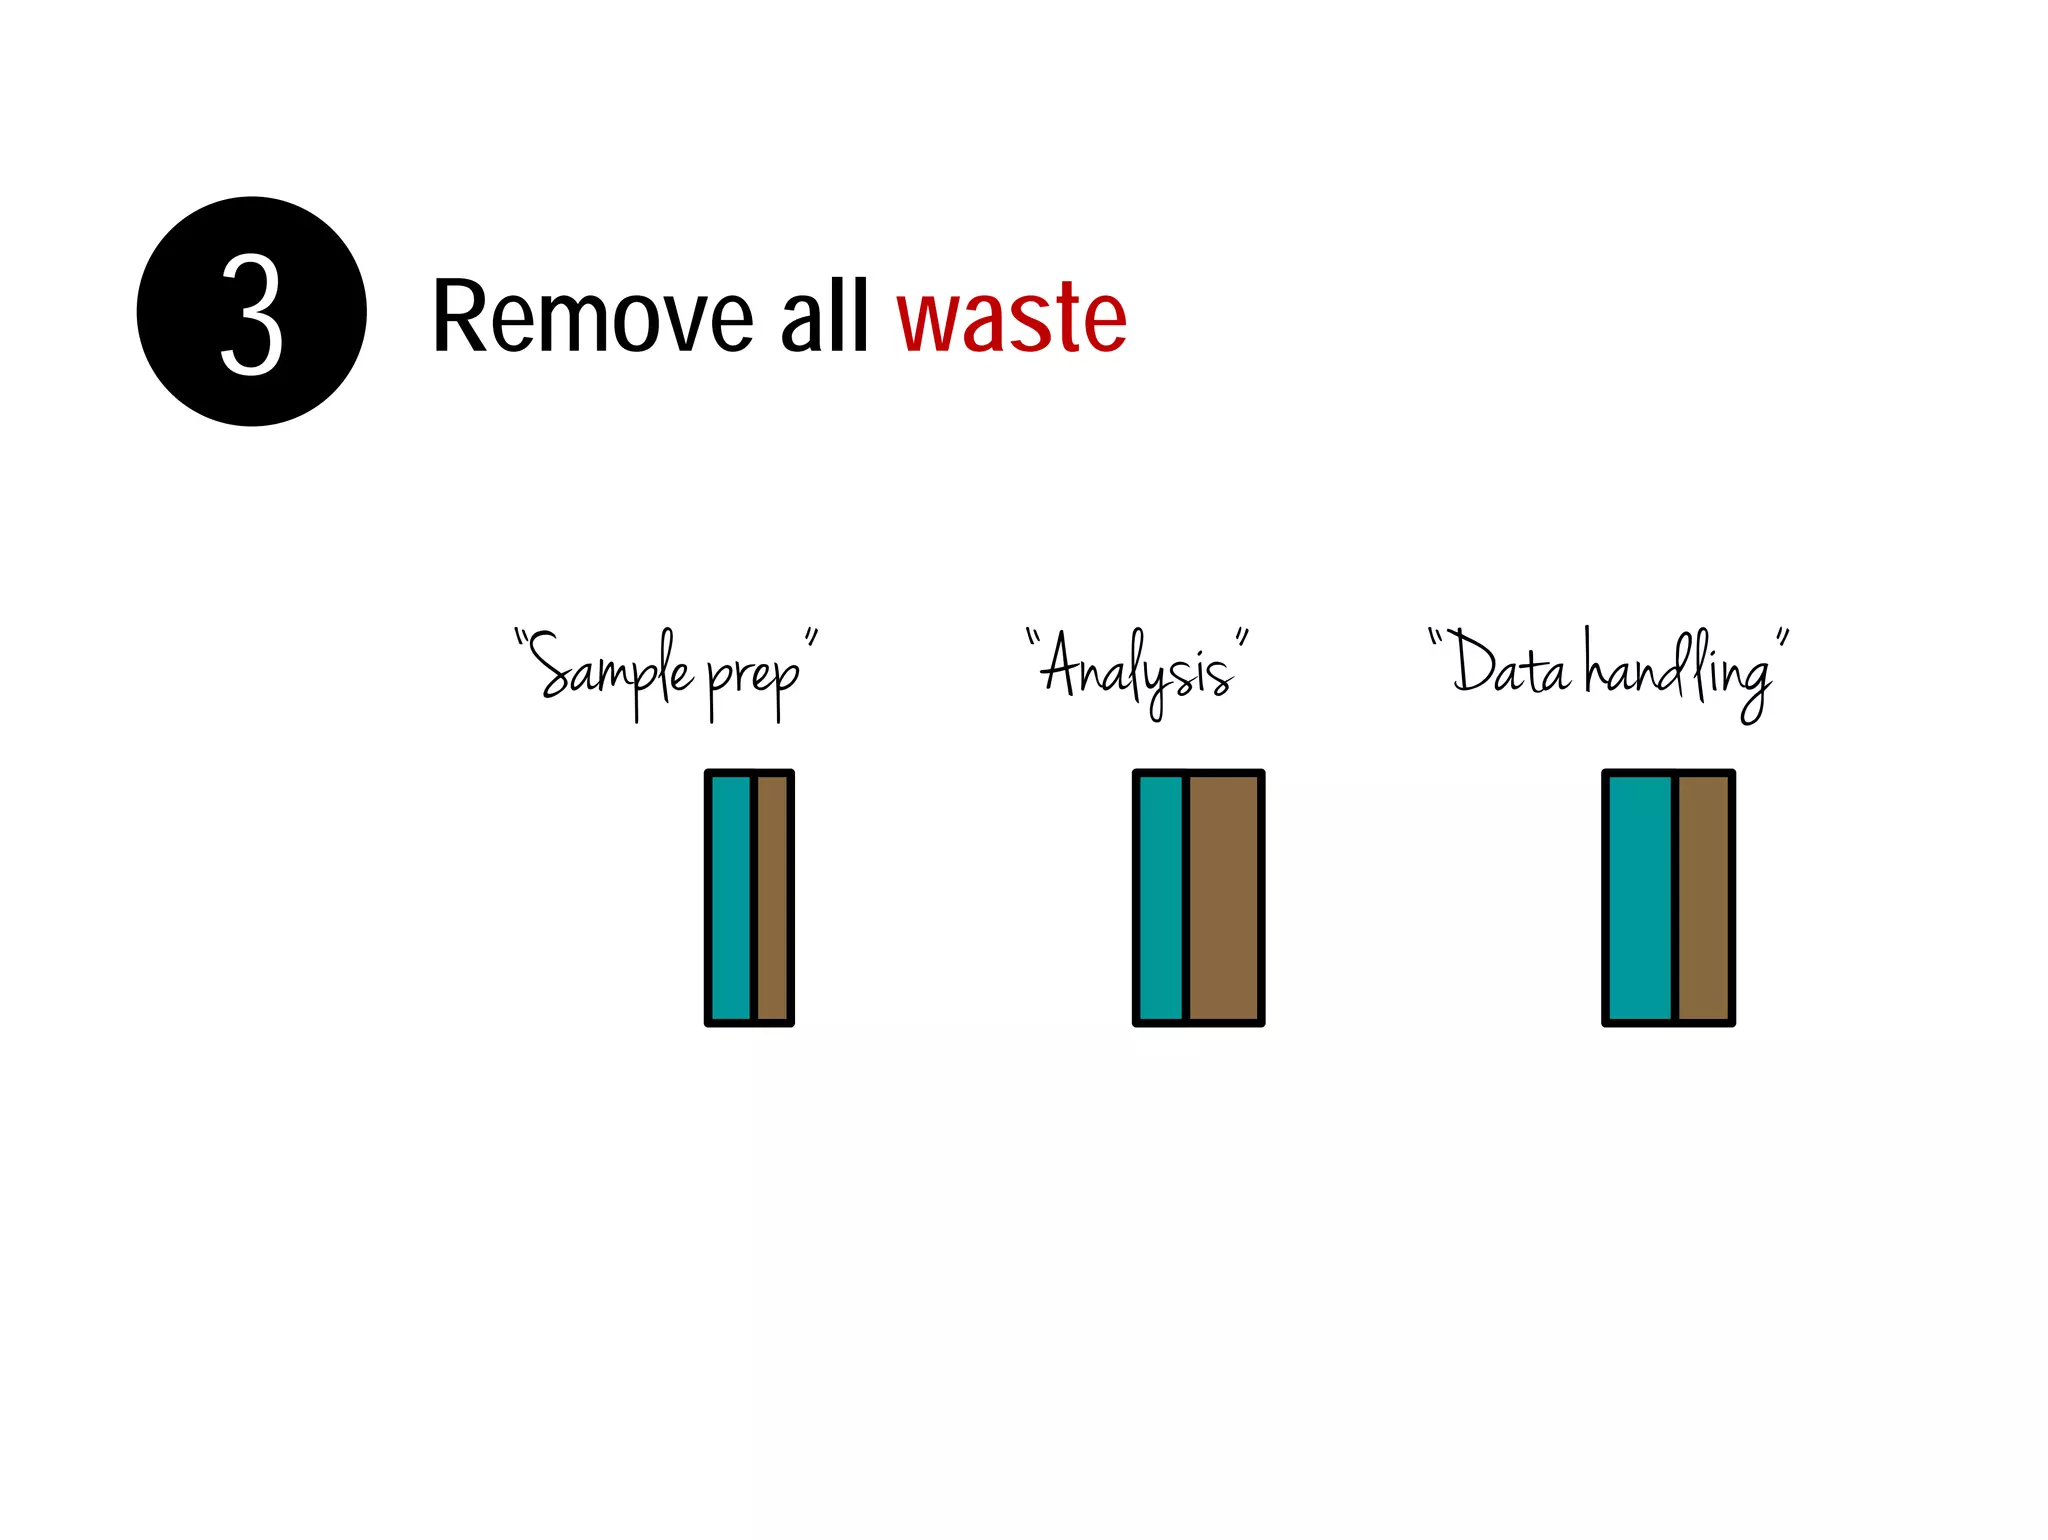
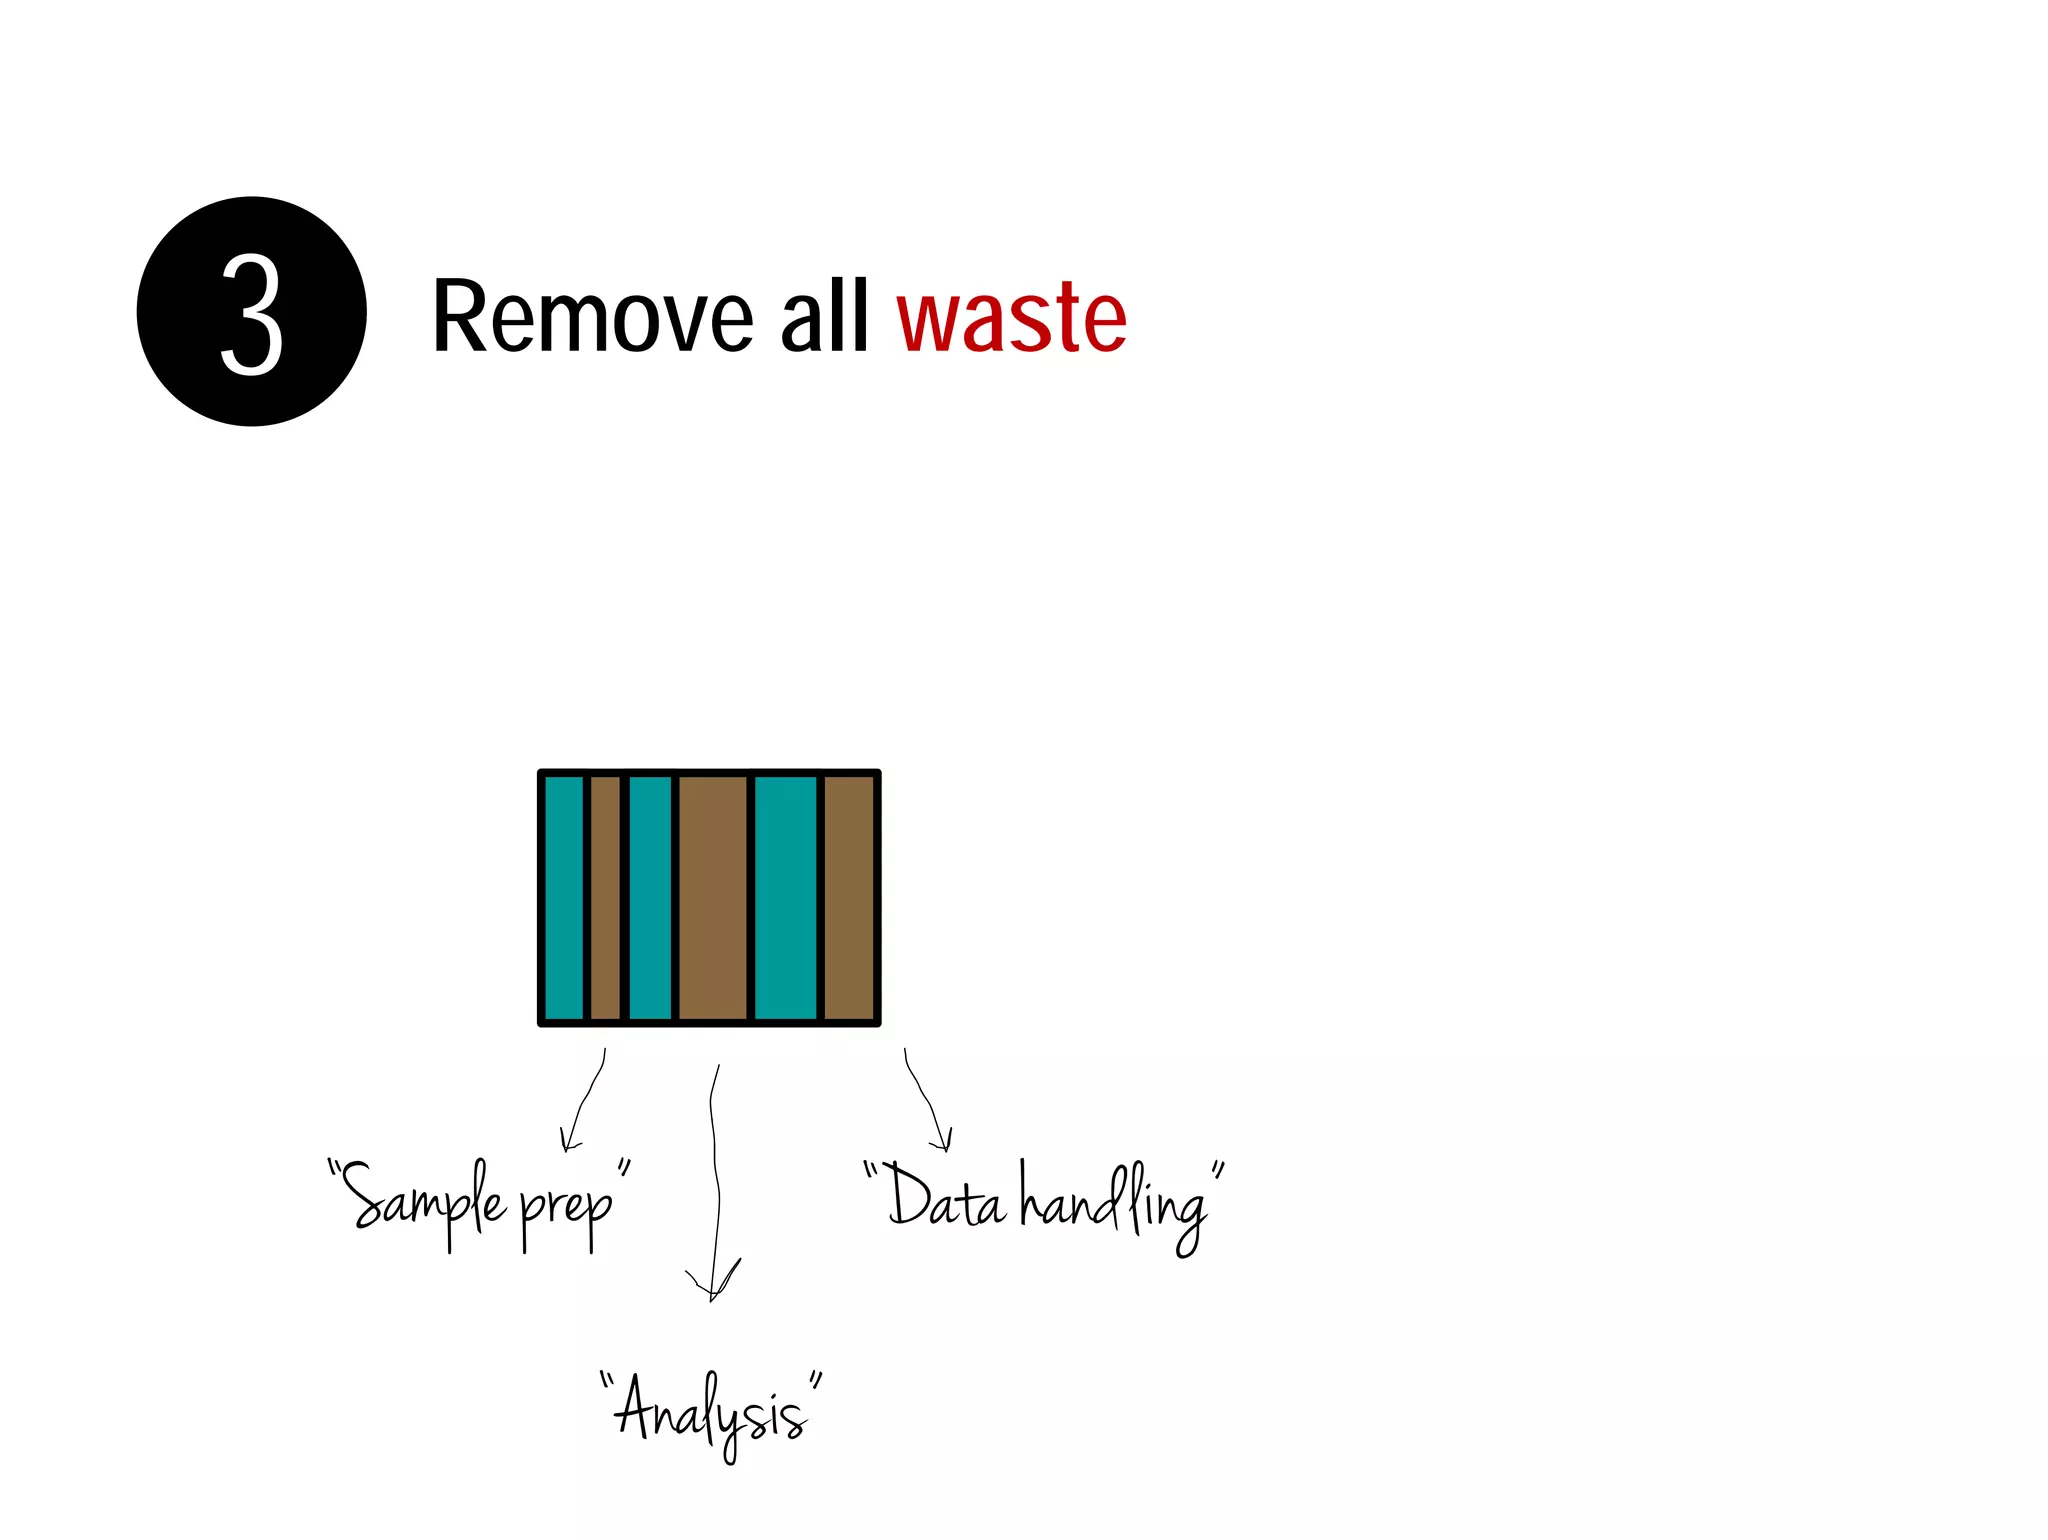
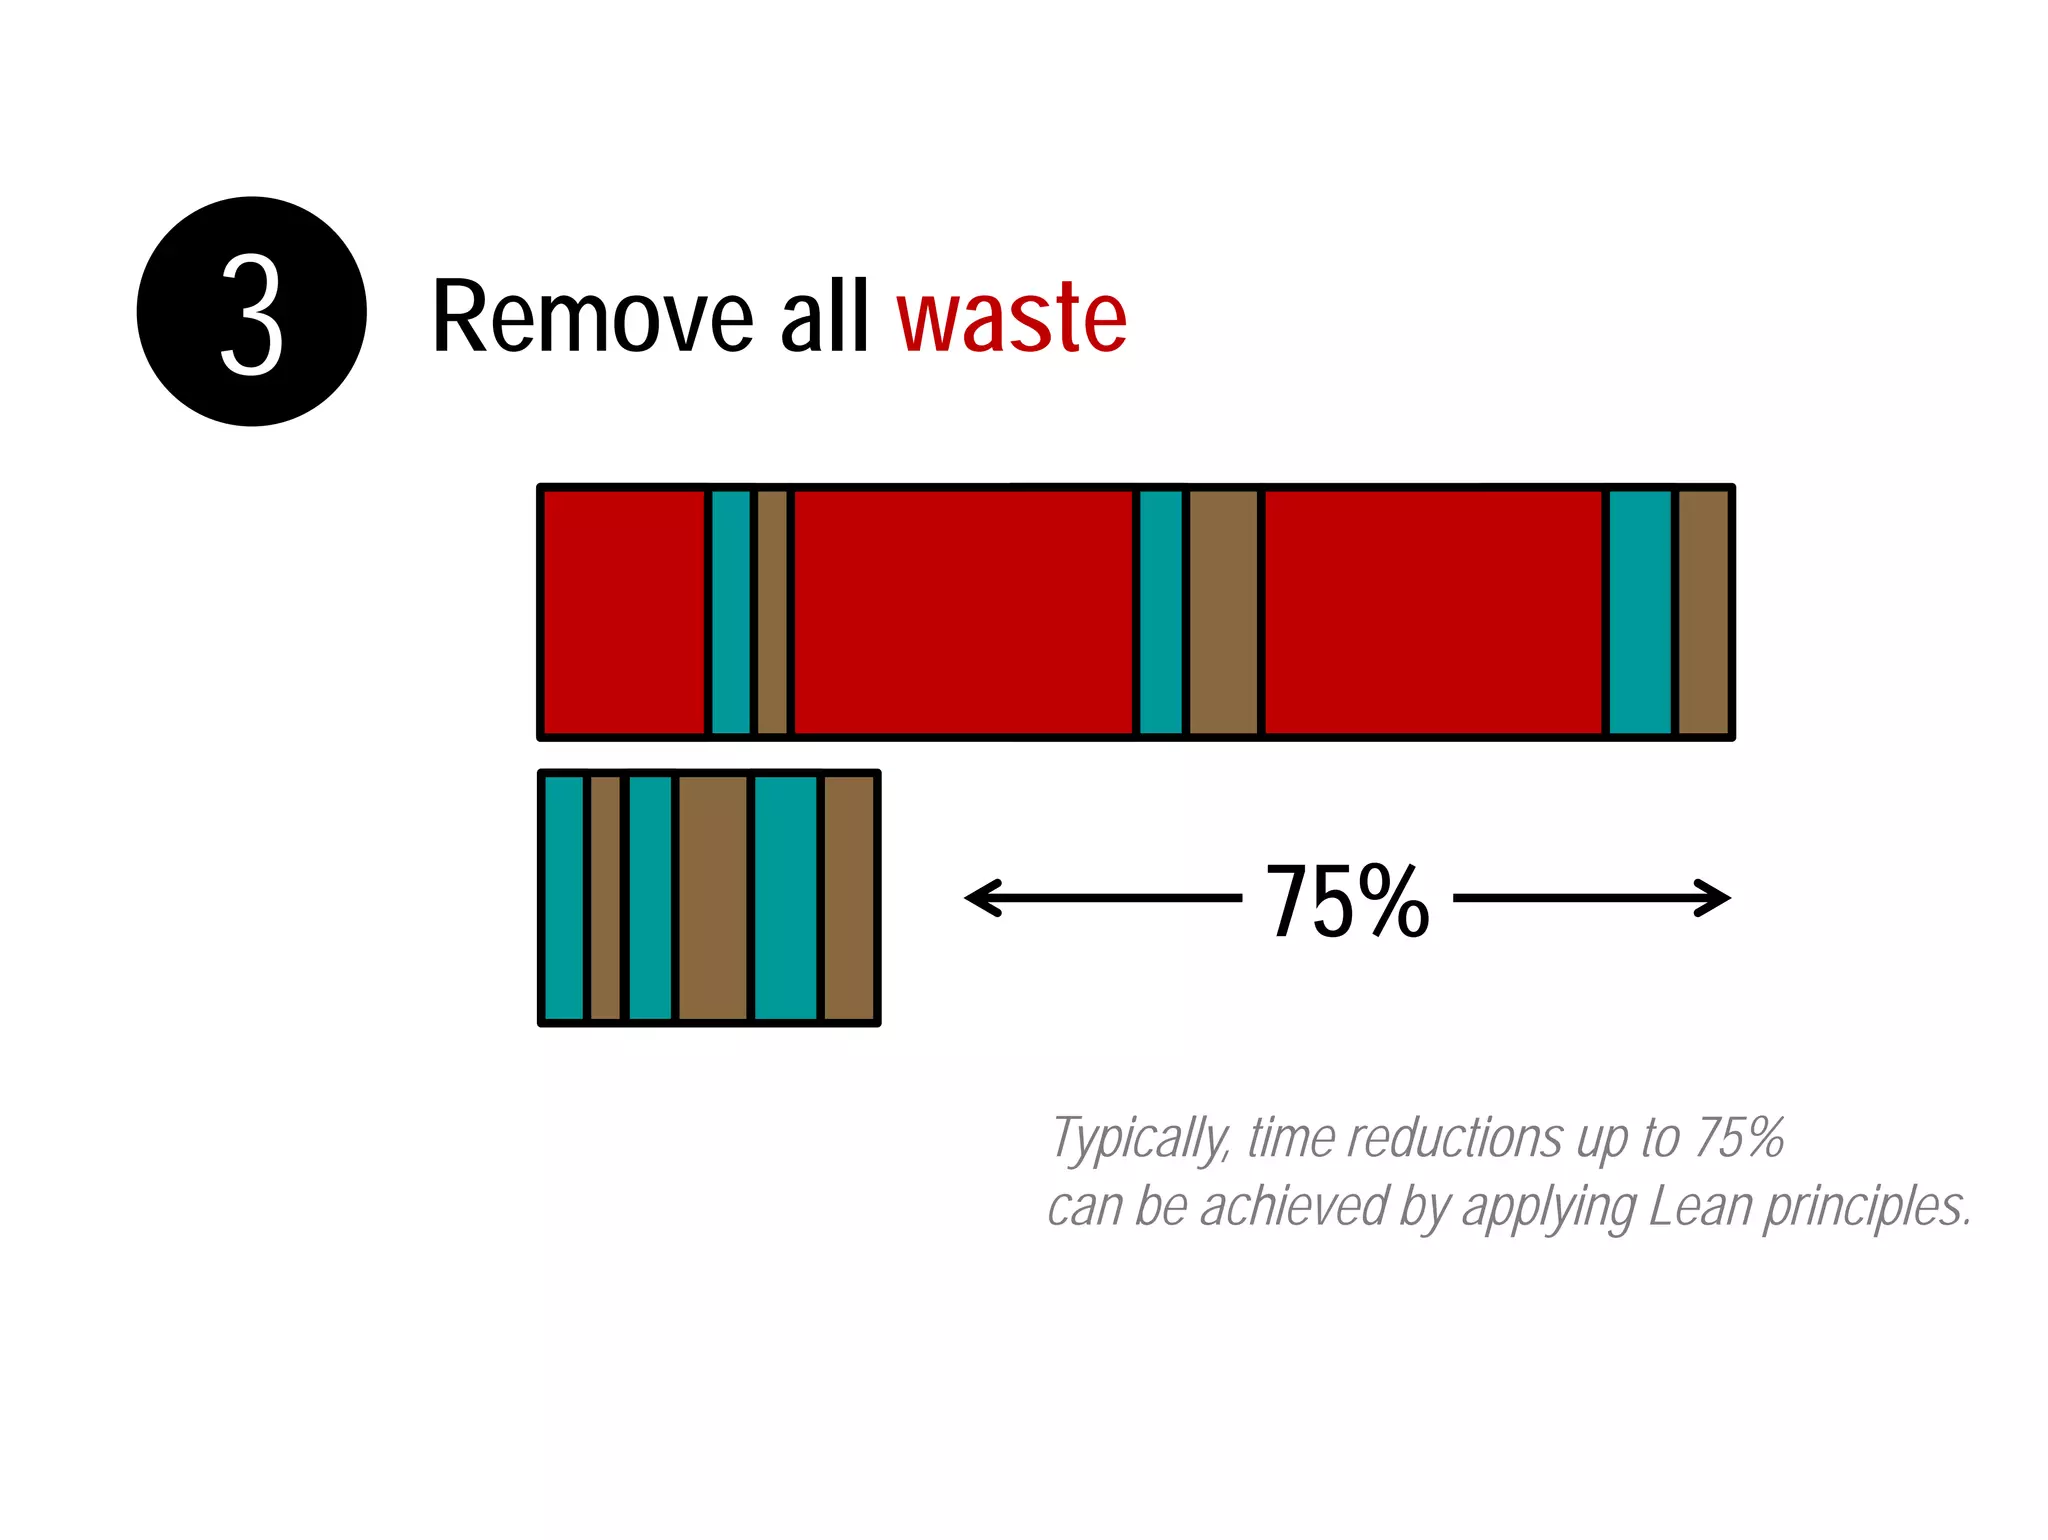
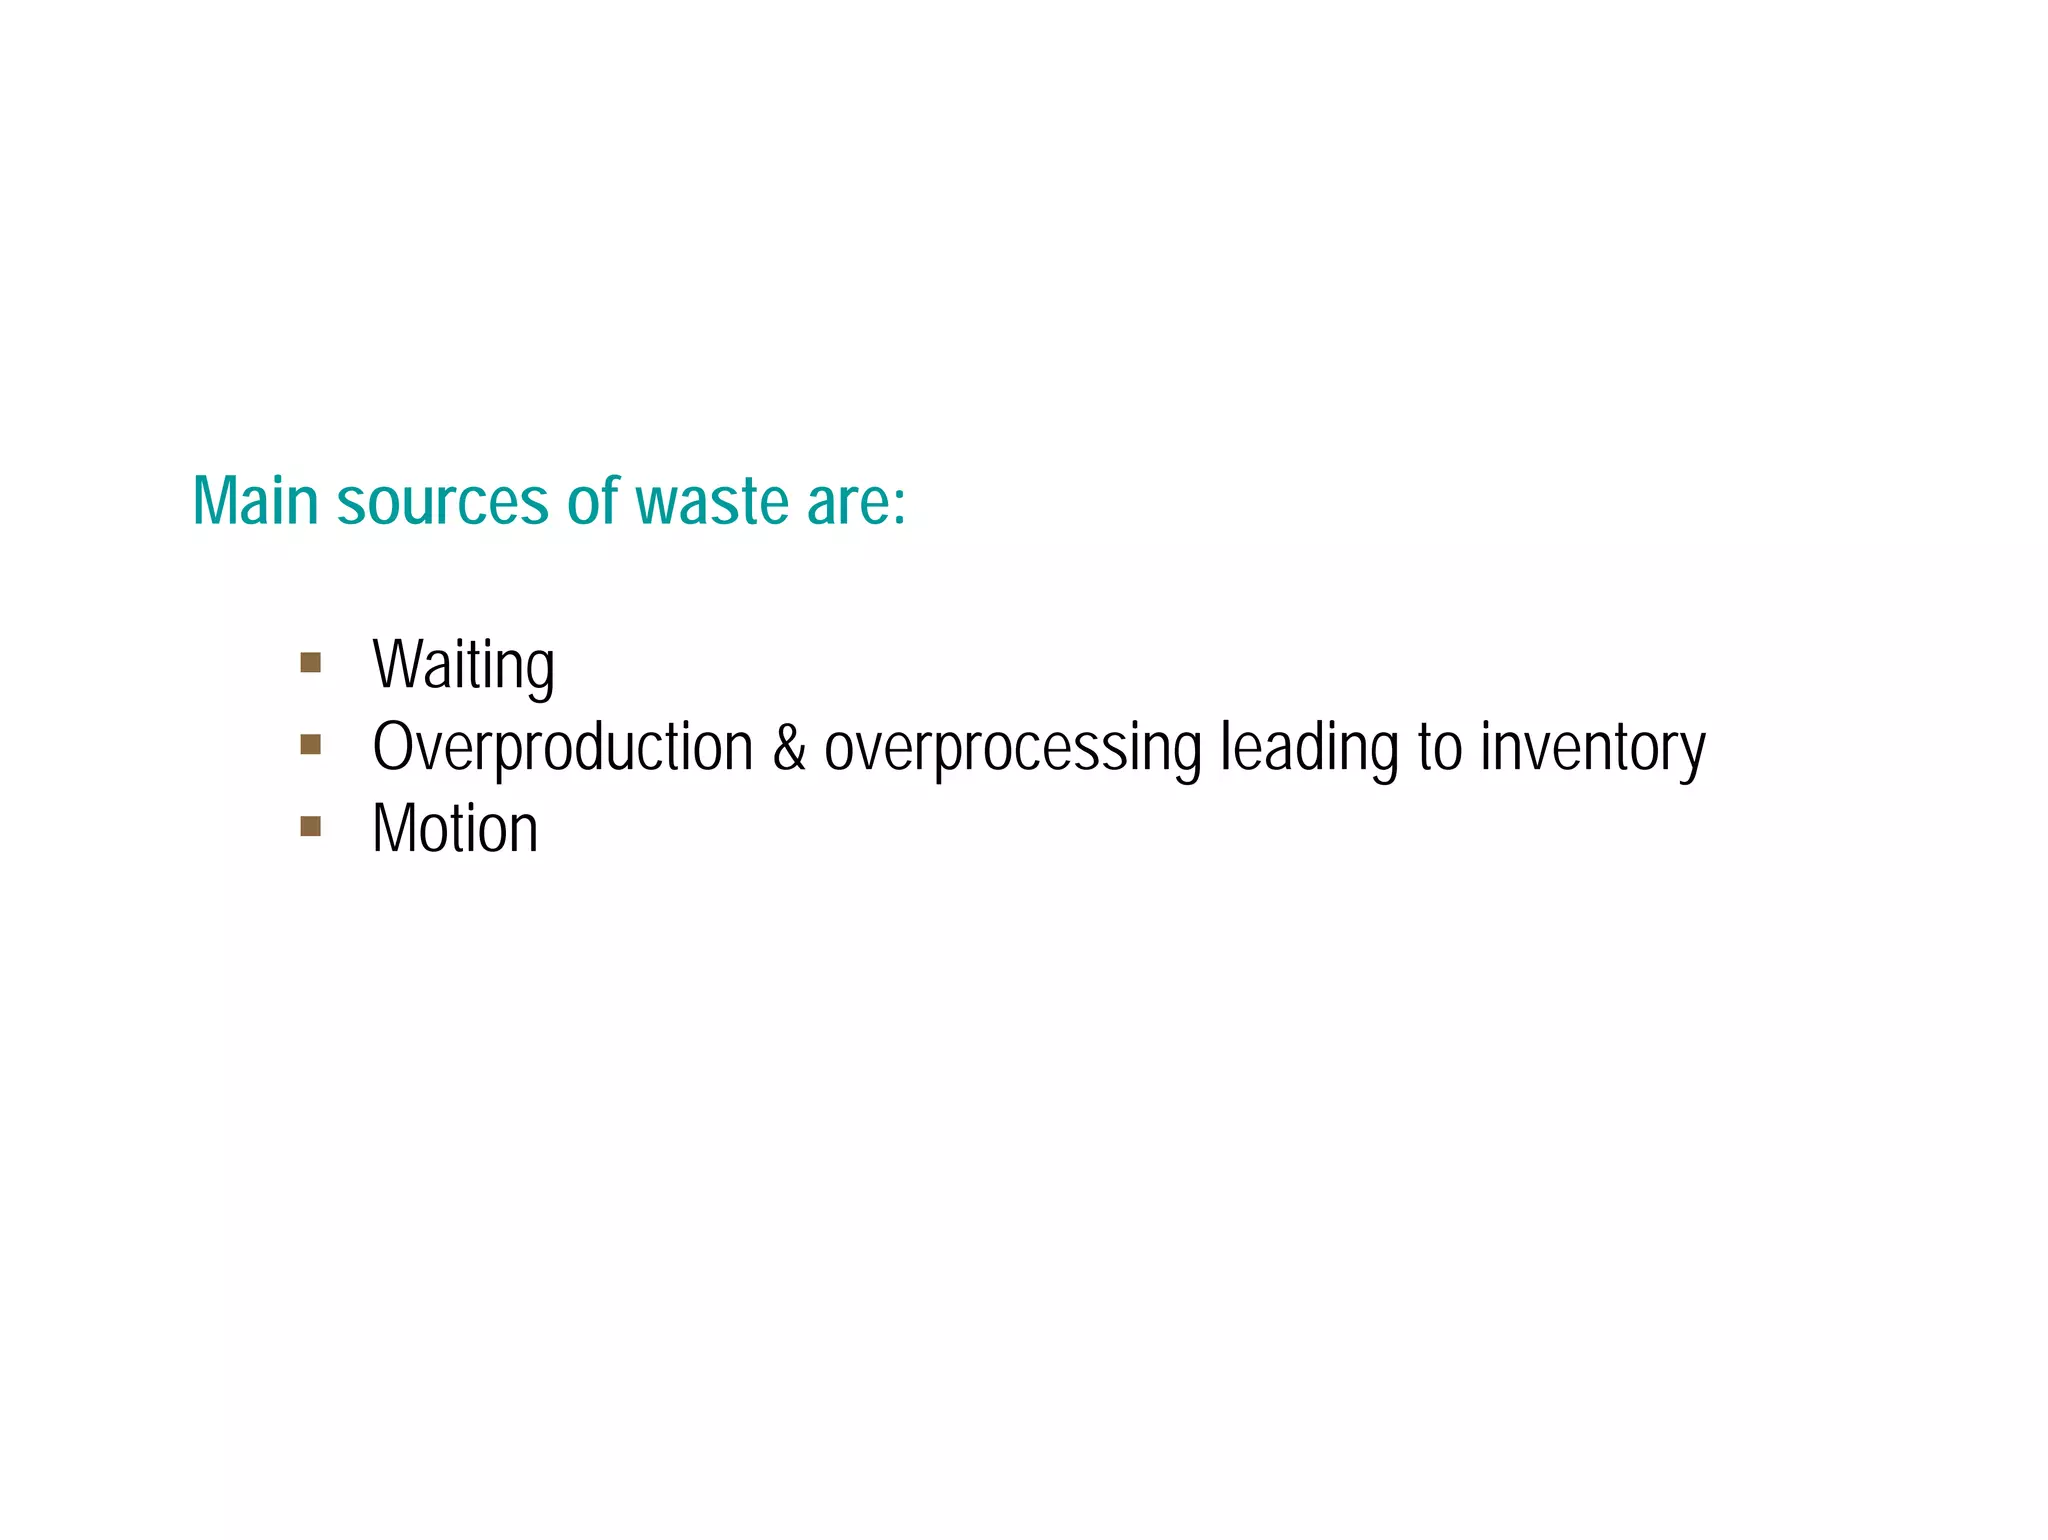
The document discusses lean innovation principles aimed at unlocking creativity for economic sustainability across various sectors by reducing waste and improving productivity. It outlines techniques such as value stream mapping, measurement of turnaround times, and the application of lean tools like PDCA, 5 Whys, and Kanban to eliminate inefficiencies. The overall goal is to systematically remove waste, ultimately enhancing the process flow and promoting effective innovation.


