This document discusses exponential functions including:
- Exponential growth graphs move away from the x-axis quickly when b > 1, while decay graphs move towards it when 0 < b < 1. Both have a y-intercept of (0, a).
- Functions of the form y = a(b)x have a horizontal asymptote at y = 0.
- The domain is the set of all input values x, while the range is the set of all output values y.
- Examples are provided of identifying growth/decay, domain, range, asymptotes and y-intercepts of exponential functions. Graphing techniques including making tables and connecting points with smooth curves are also outlined.
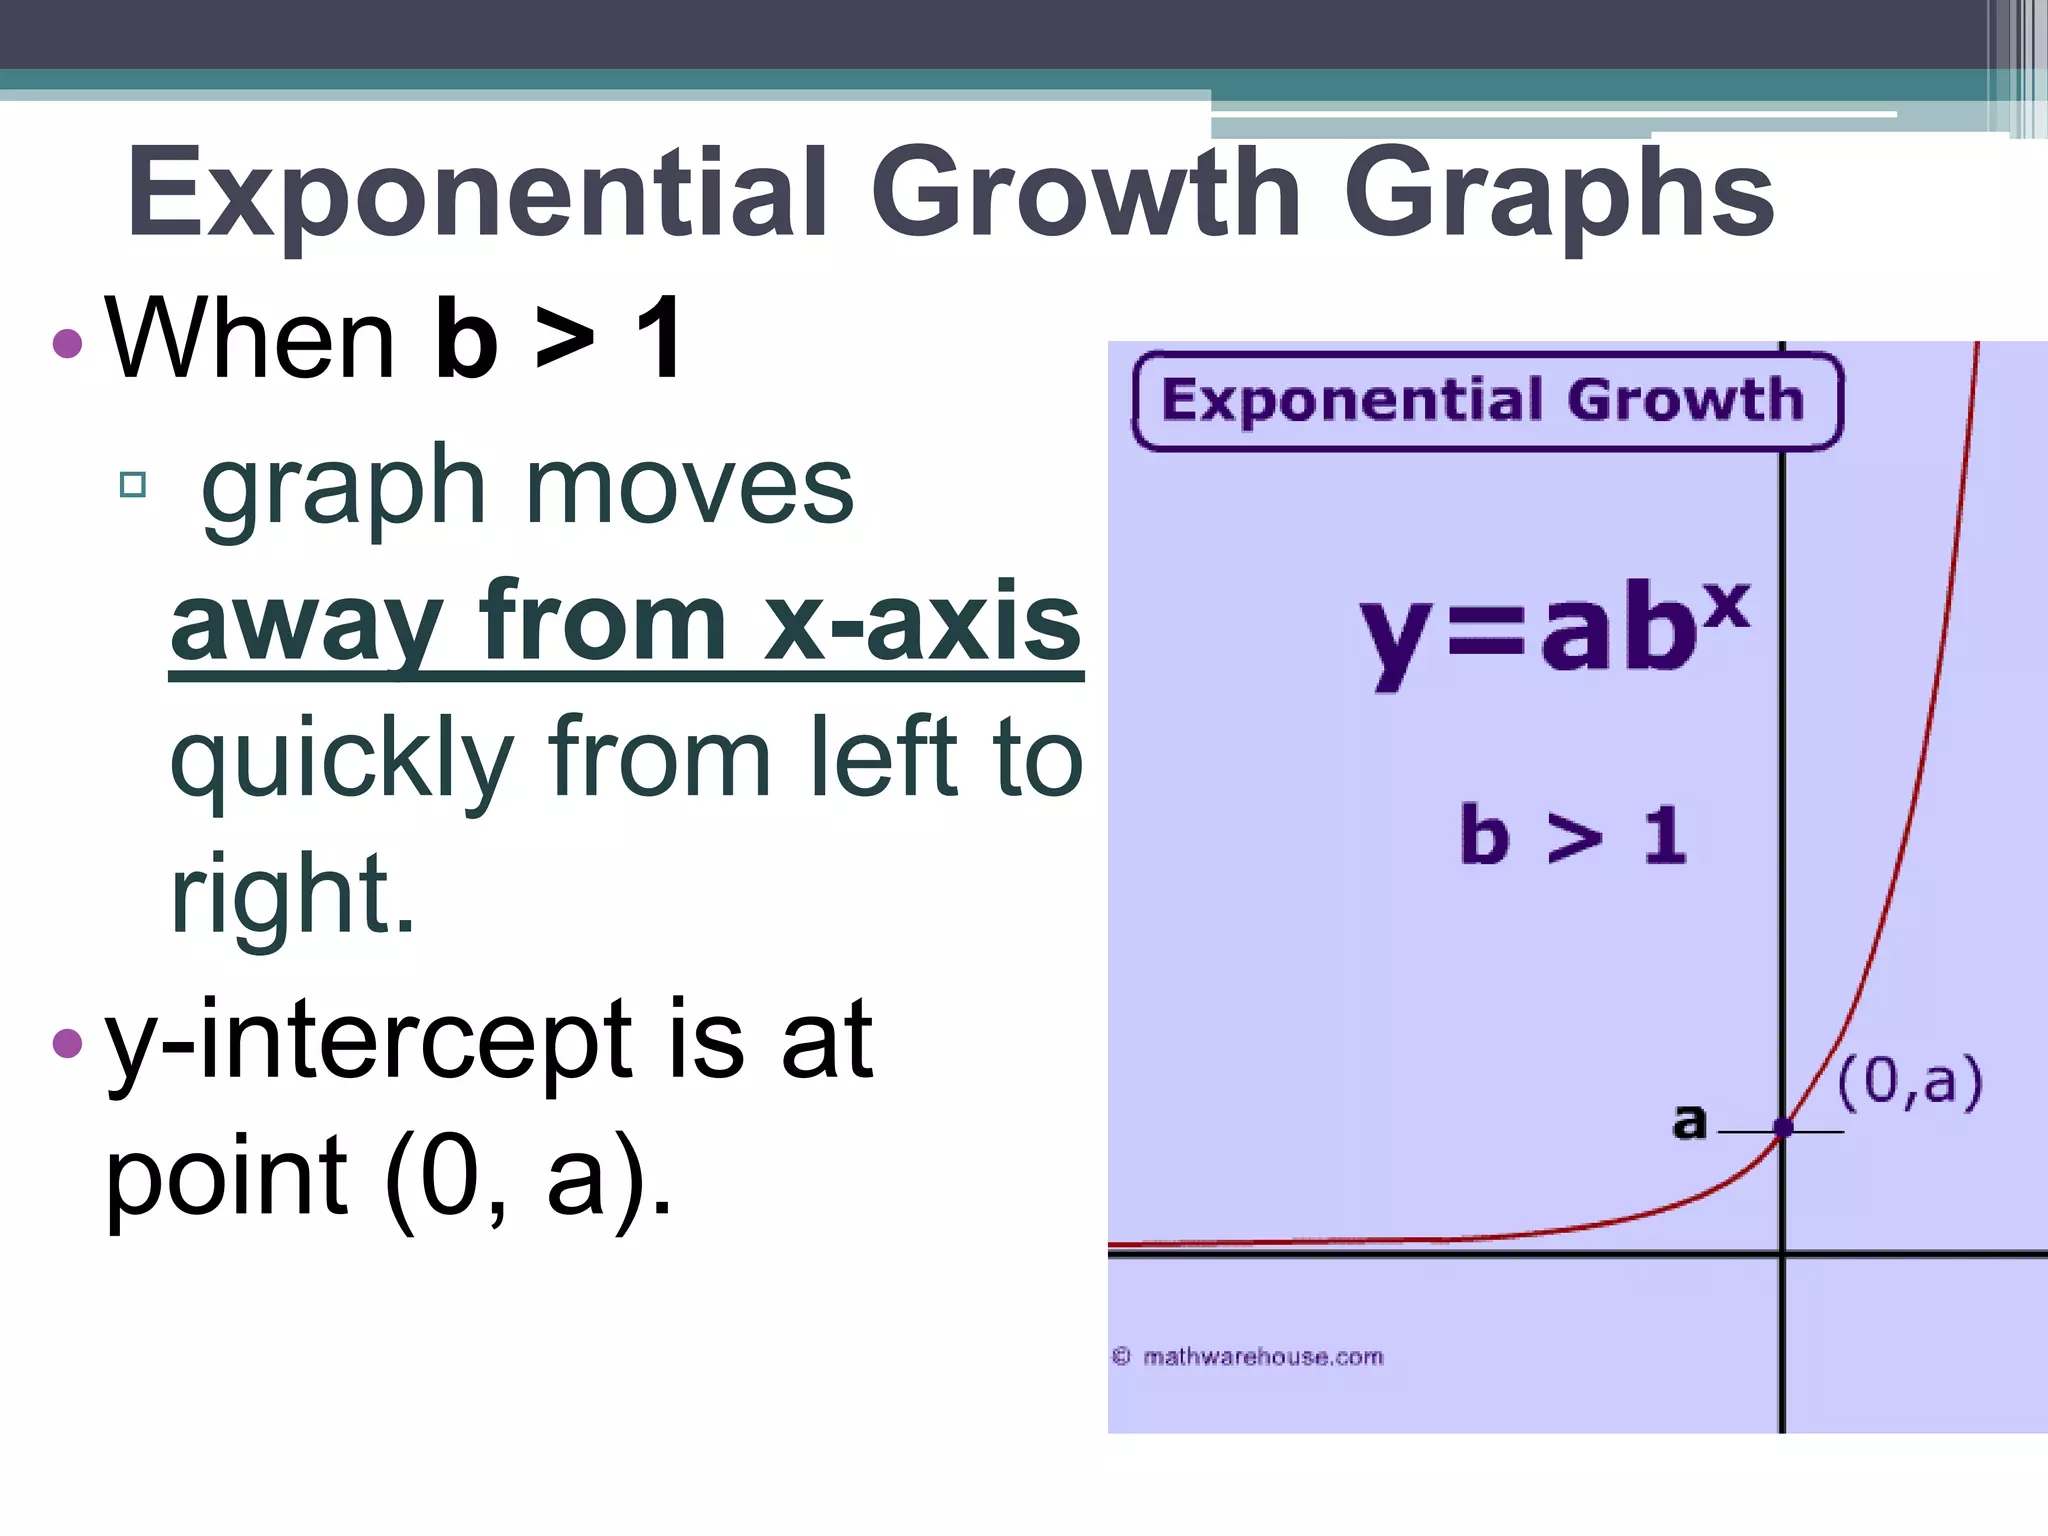
Exponential Growth Graphs
•When b > 1
▫ graph moves
away from x-axis
quickly from left to
right.
•y-intercept is at
point (0, a).
3.
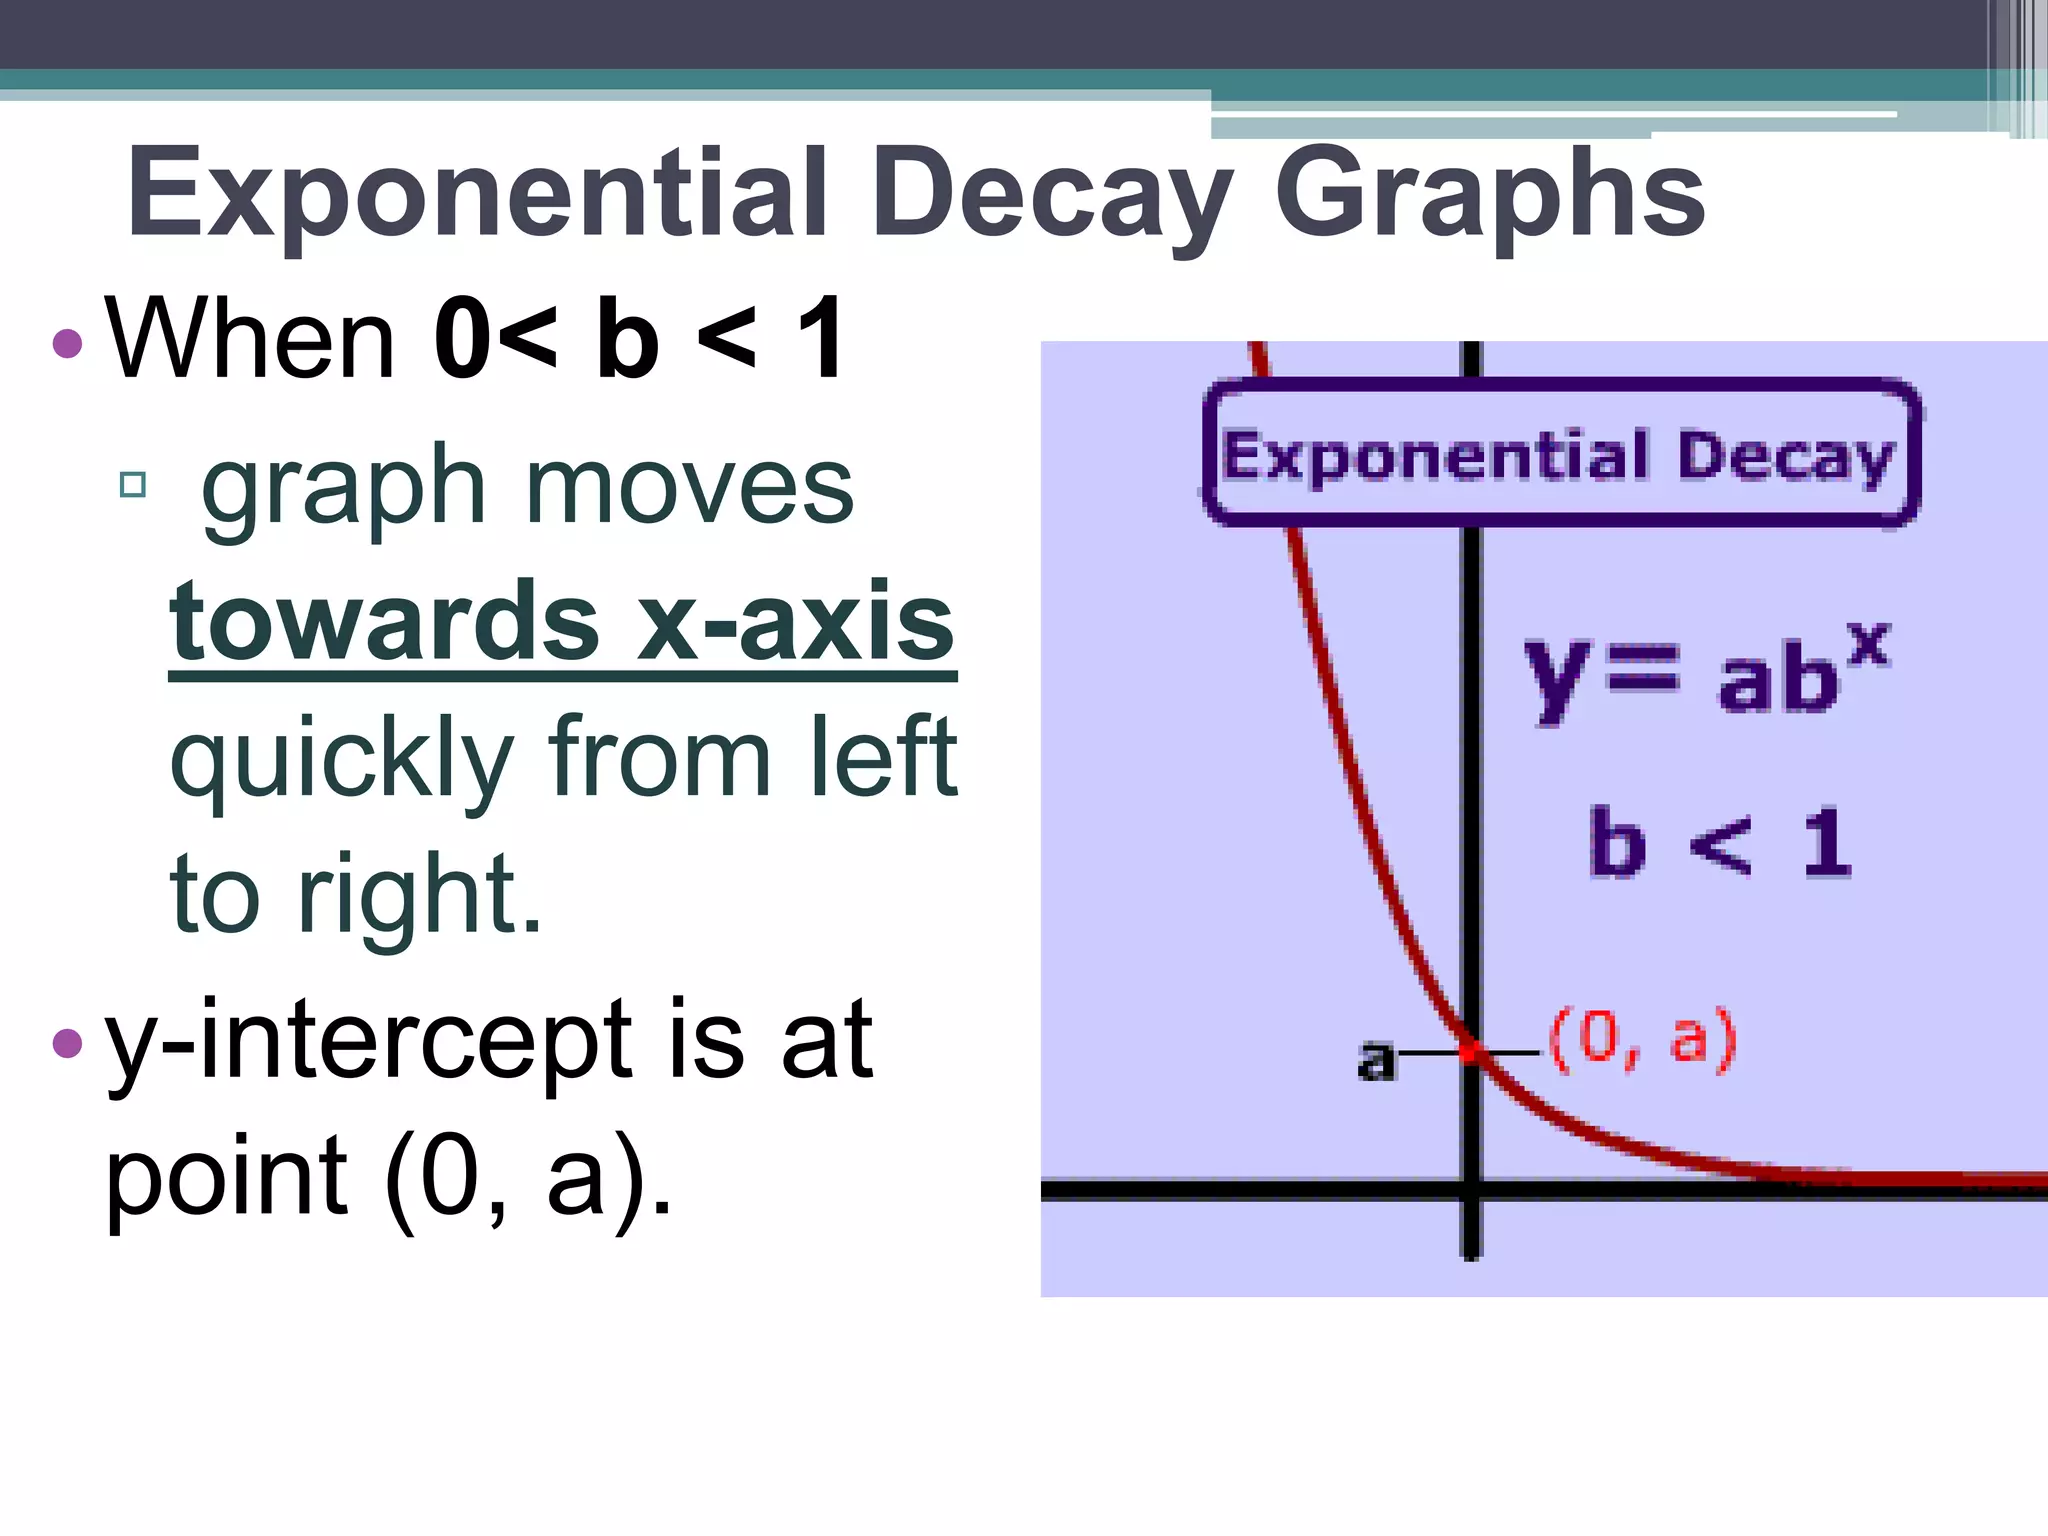
Exponential Decay Graphs
•When 0< b < 1
▫ graph moves
towards x-axis
quickly from left
to right.
•y-intercept is at
point (0, a).
4.
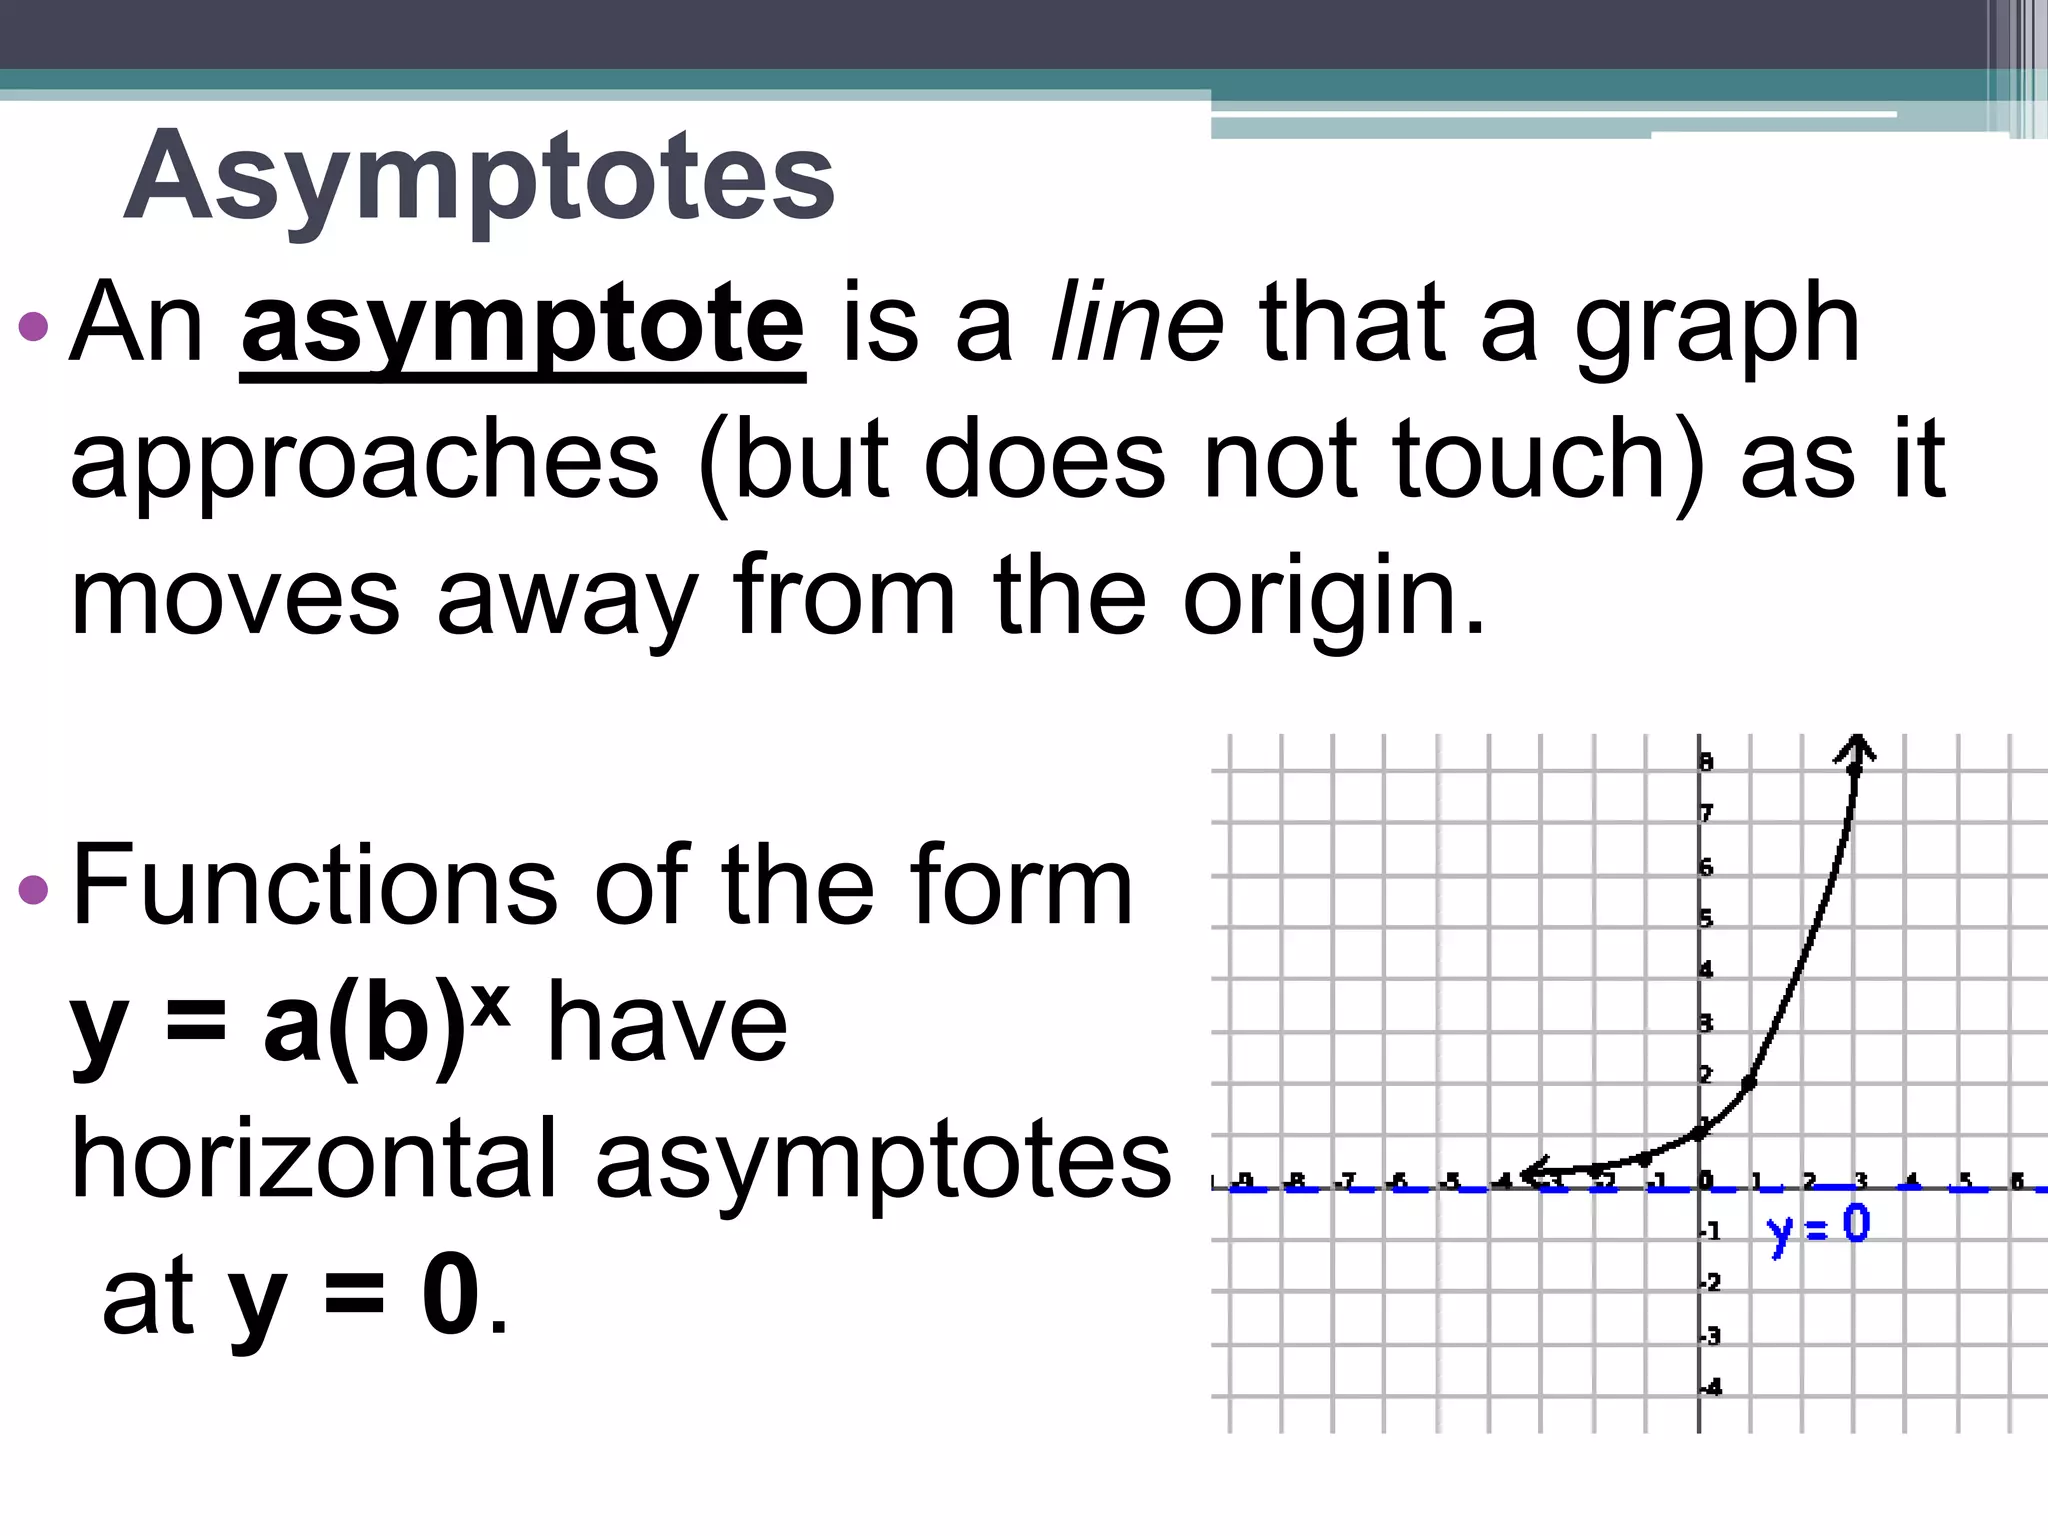
Asymptotes
•An asymptoteis a line that a graph
approaches (but does not touch) as it
moves away from the origin.
•Functions of the form
y = a(b)x have
horizontal asymptotes
at y = 0.
5.
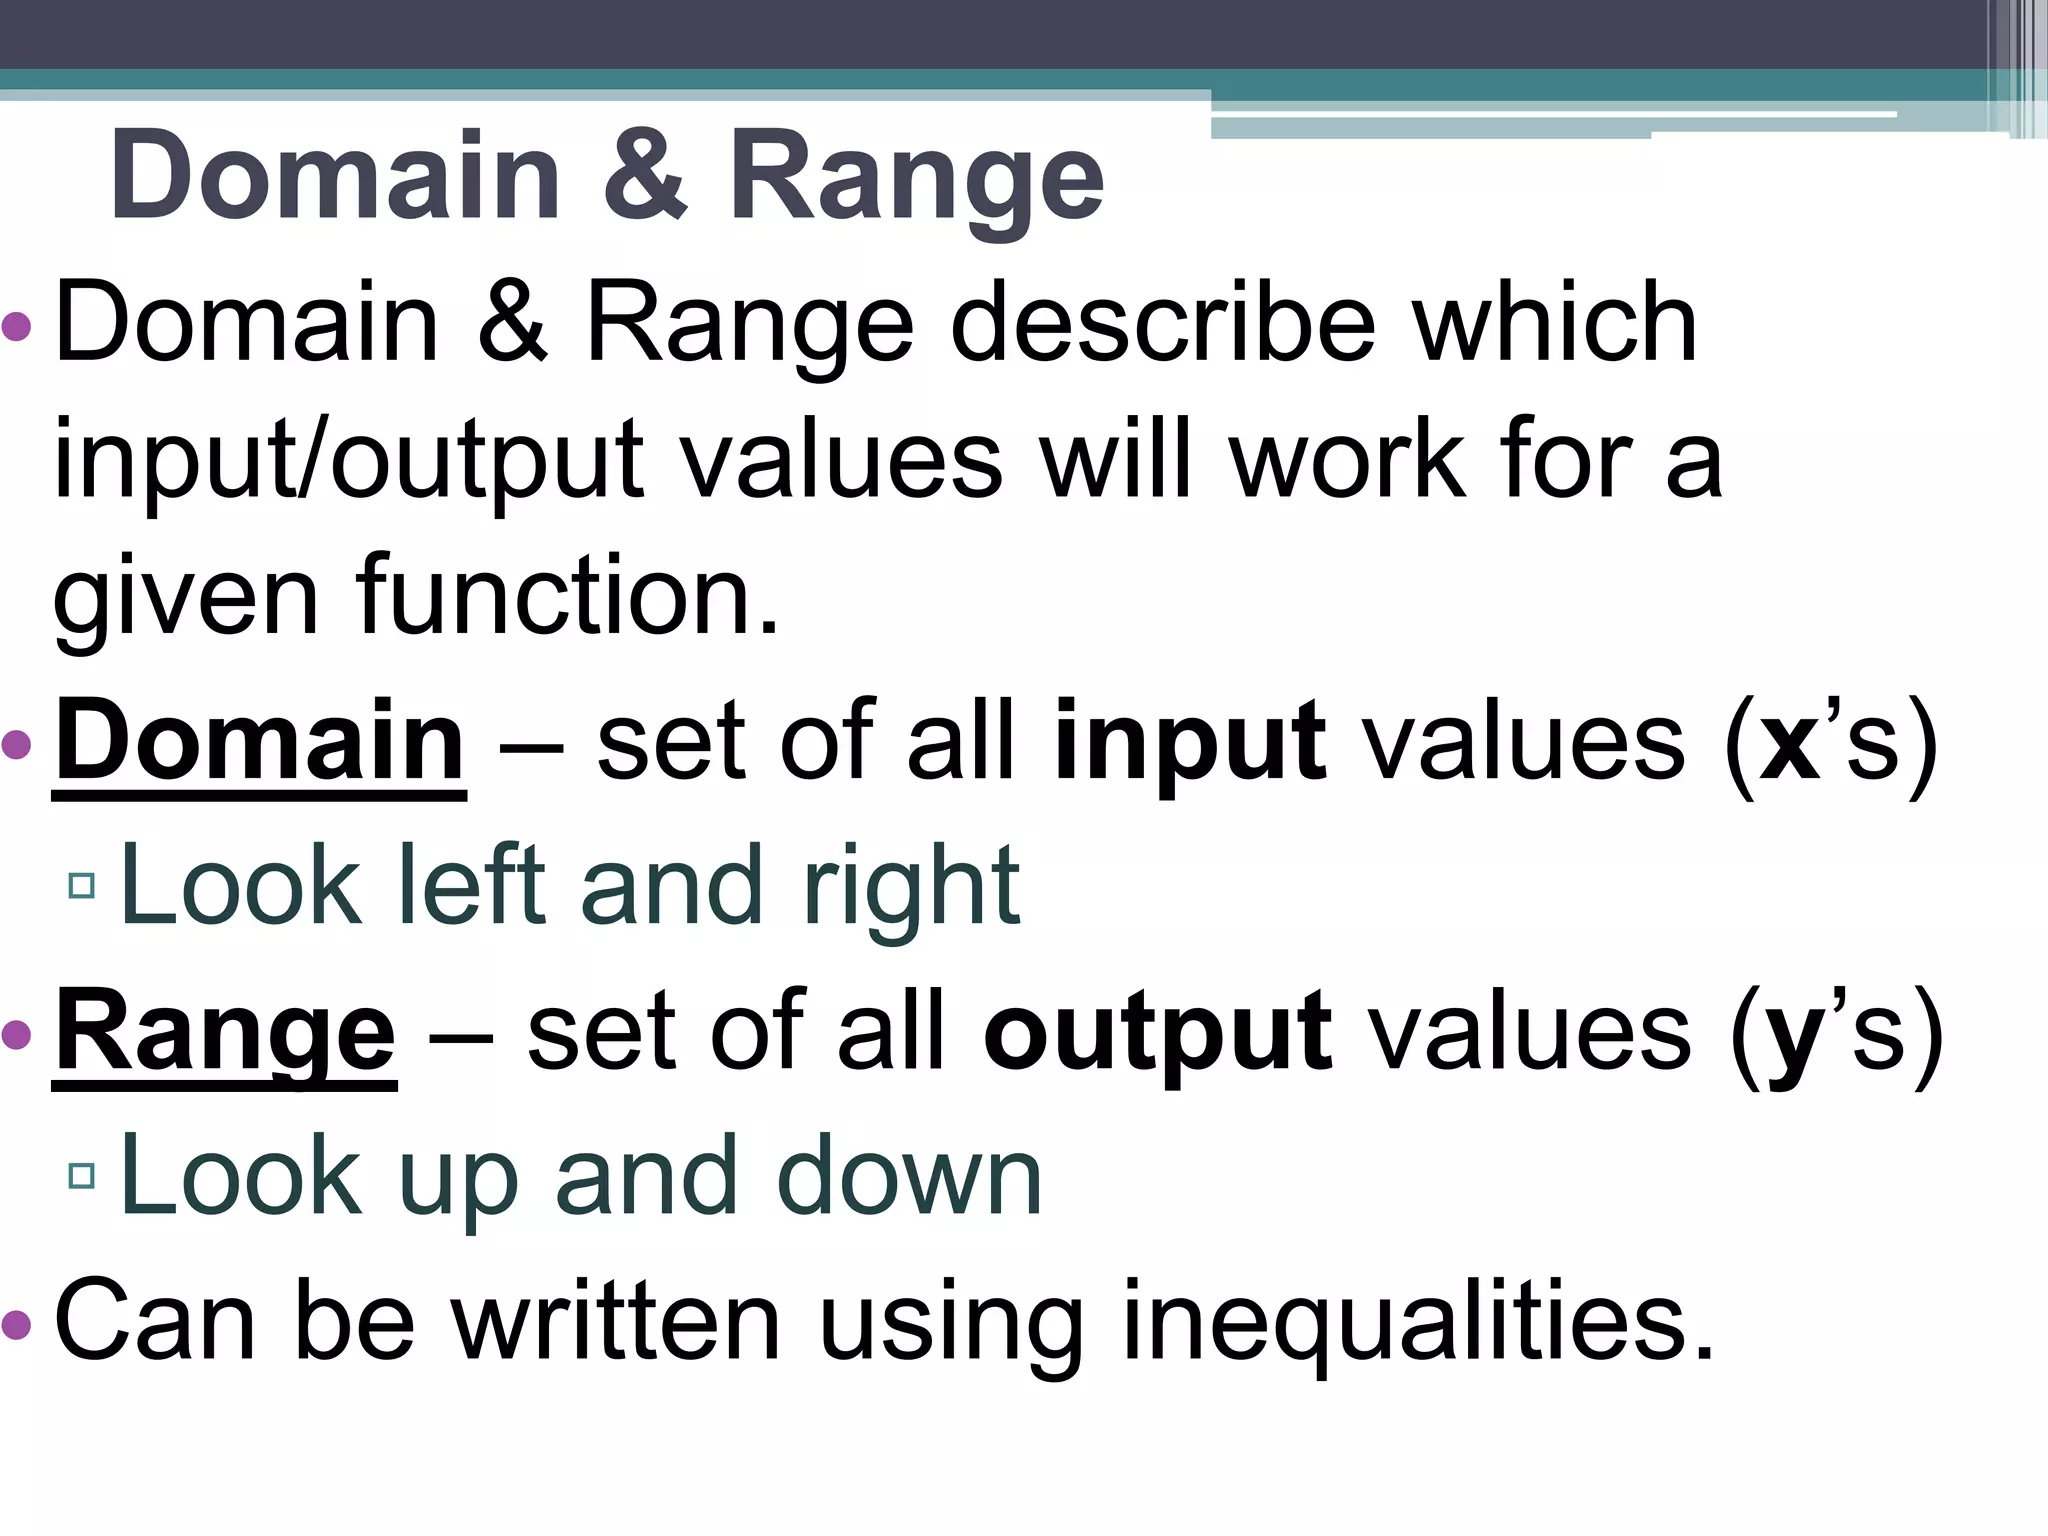
Domain & Range
•Domain & Range describe which
input/output values will work for a
given function.
•Domain – set of all input values (x’s)
▫ Look left and right
•Range – set of all output values (y’s)
▫ Look up and down
•Can be written using inequalities.
6.
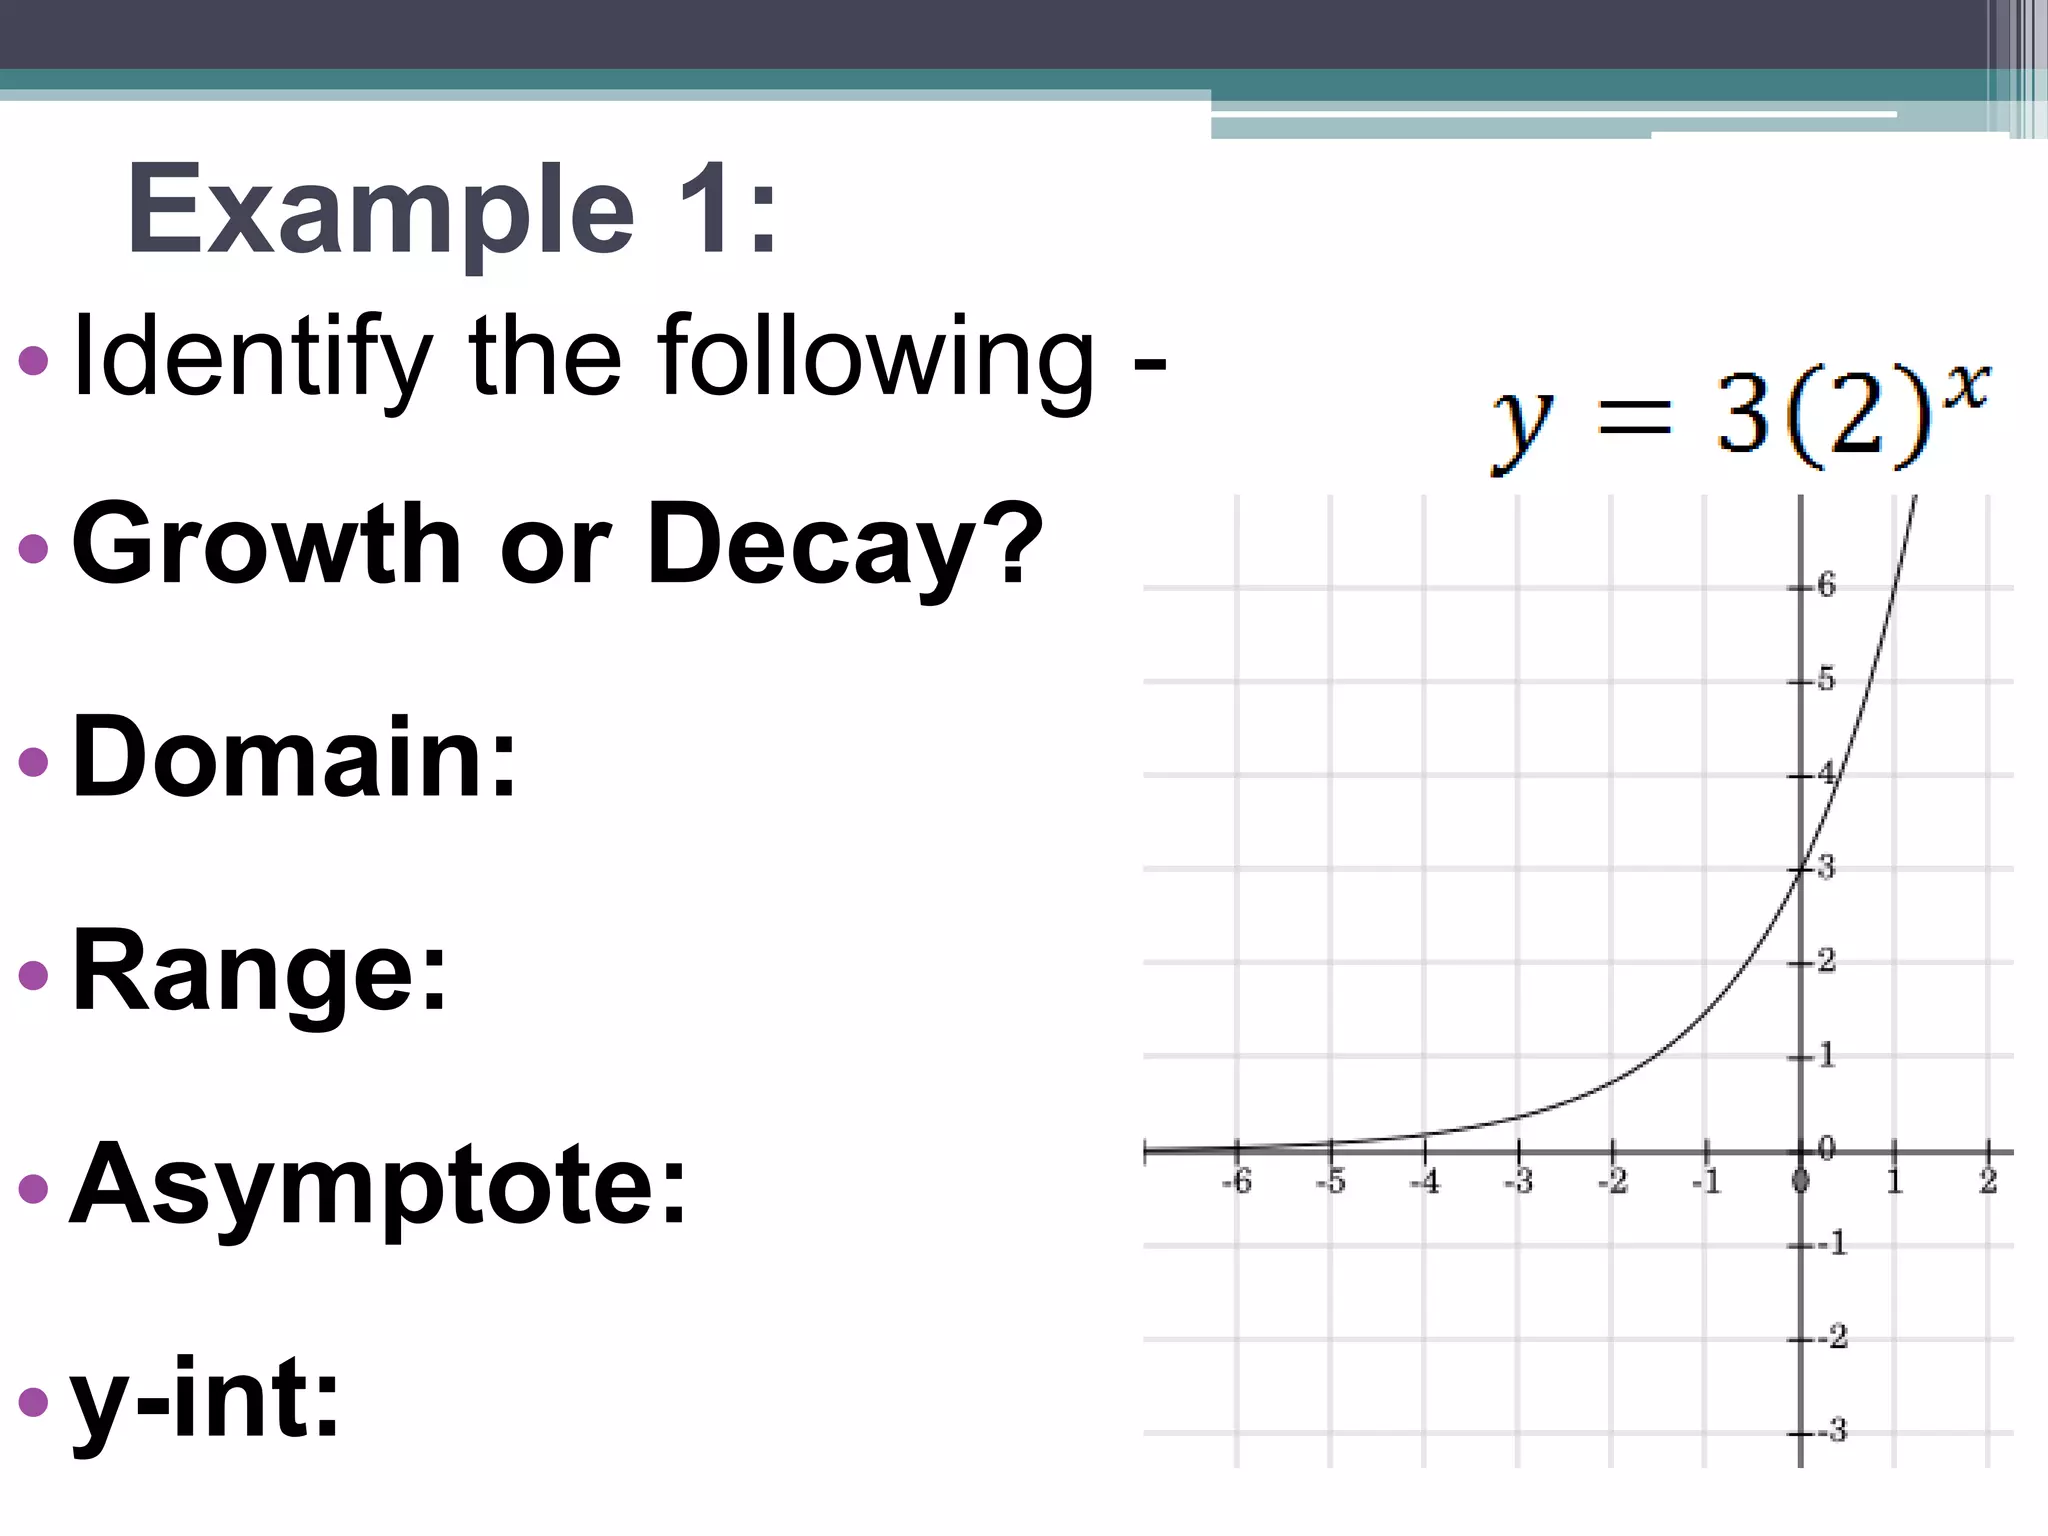
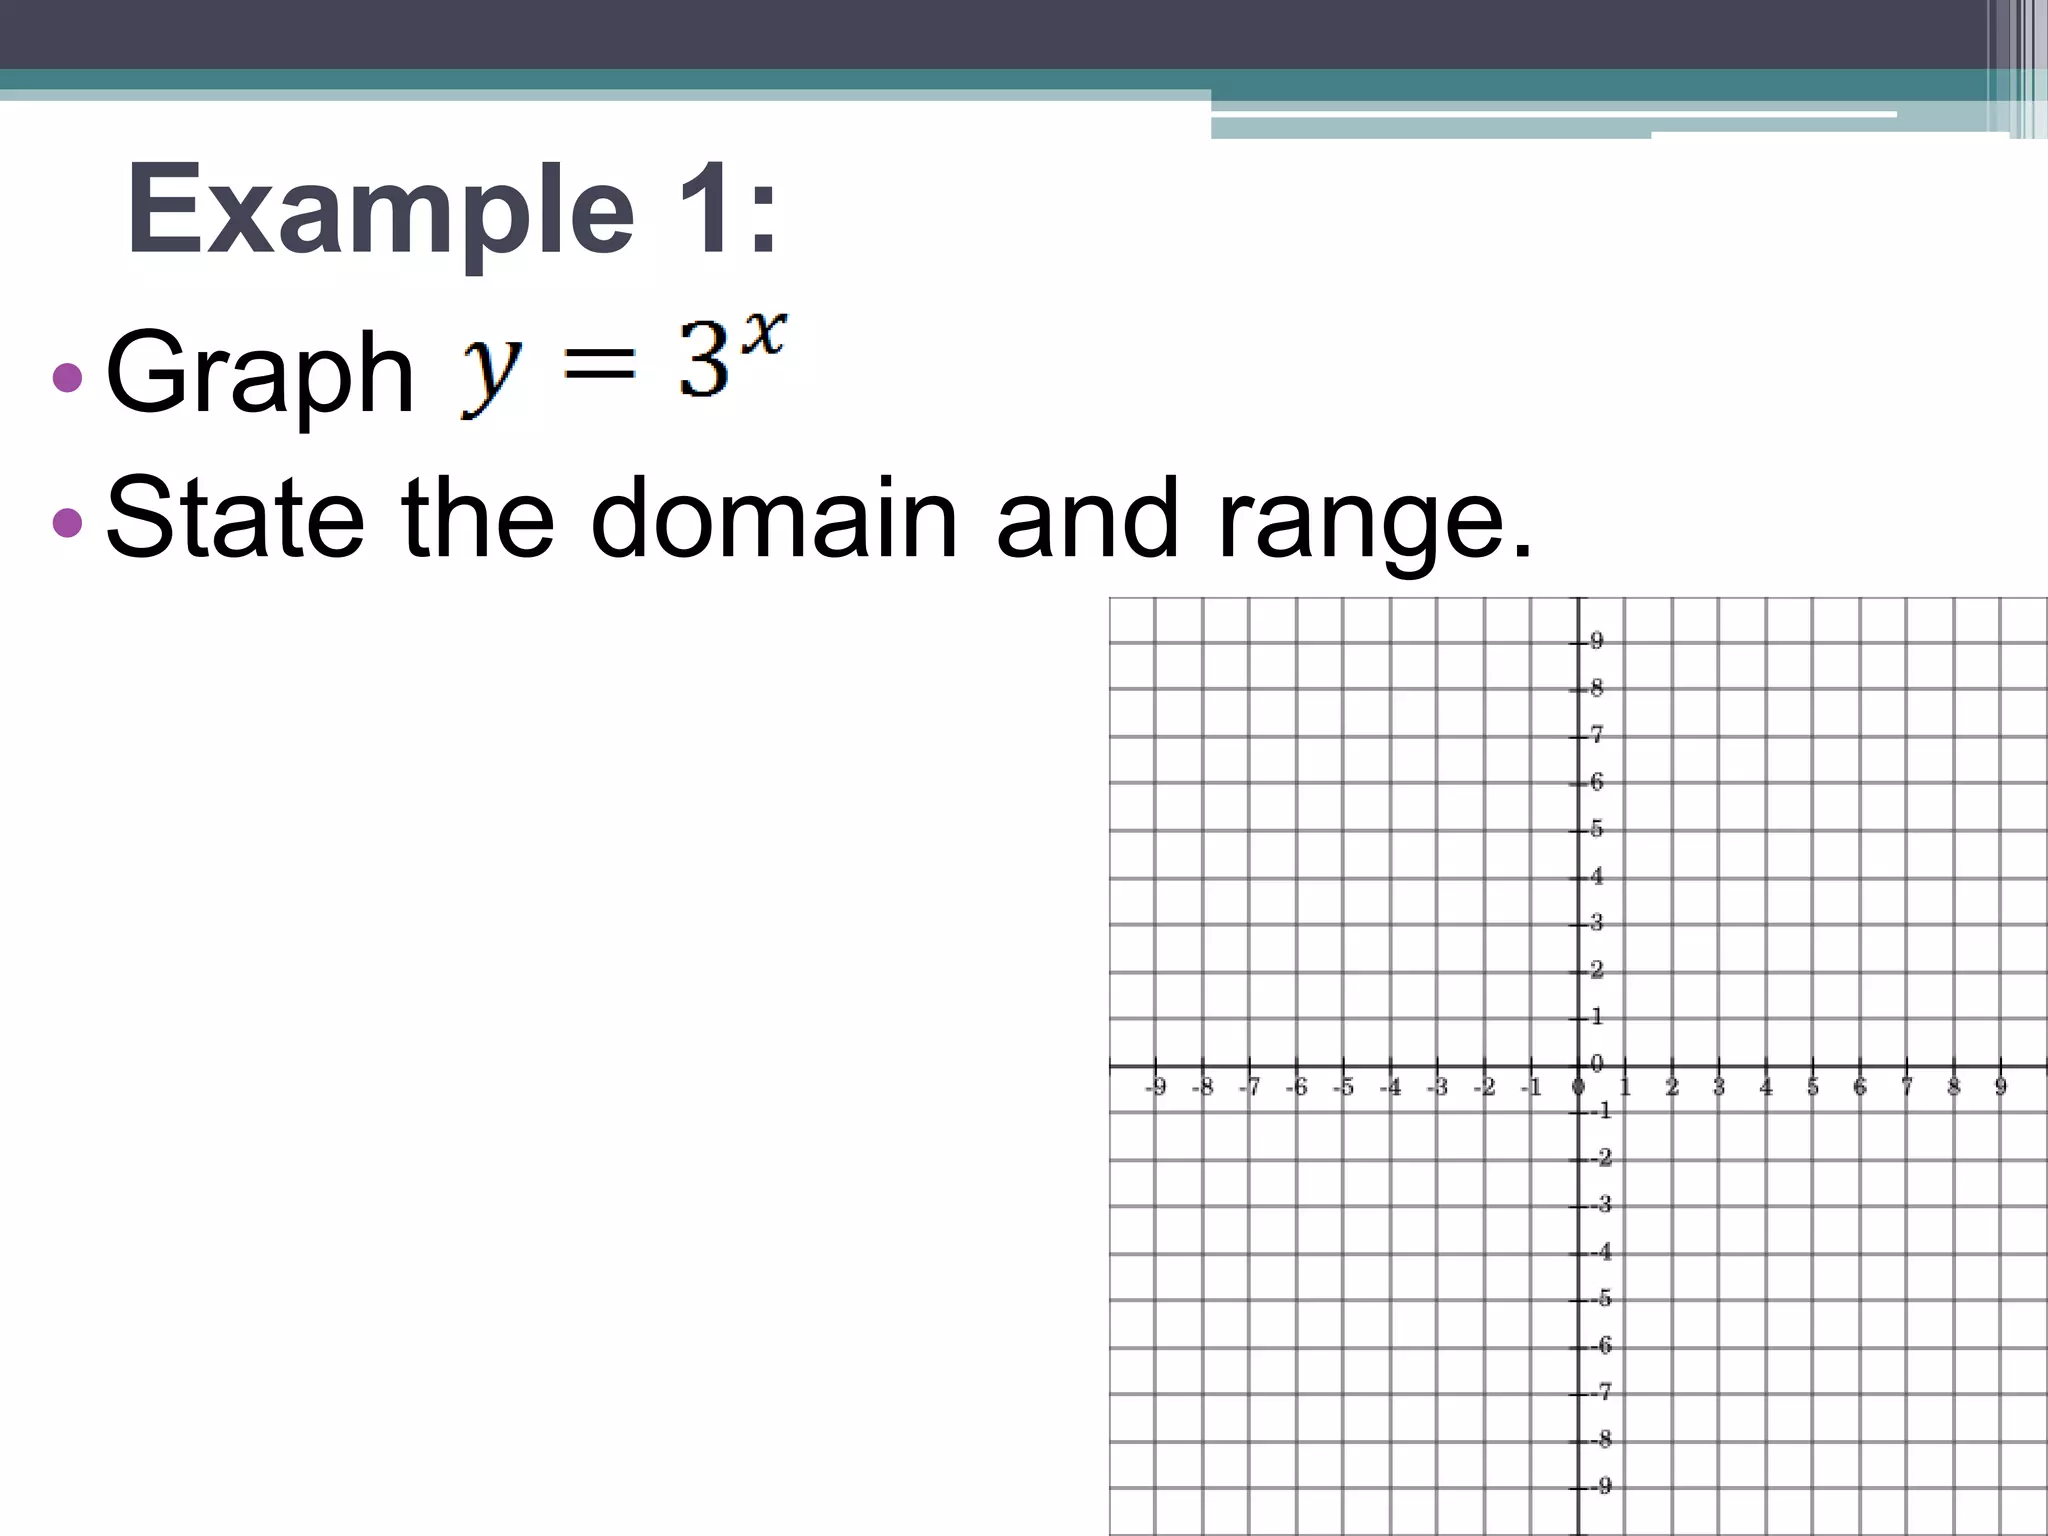
Example 1:
•Identify the following -
•Growth or Decay?
•Domain:
•Range:
•Asymptote:
•y-int:
7.
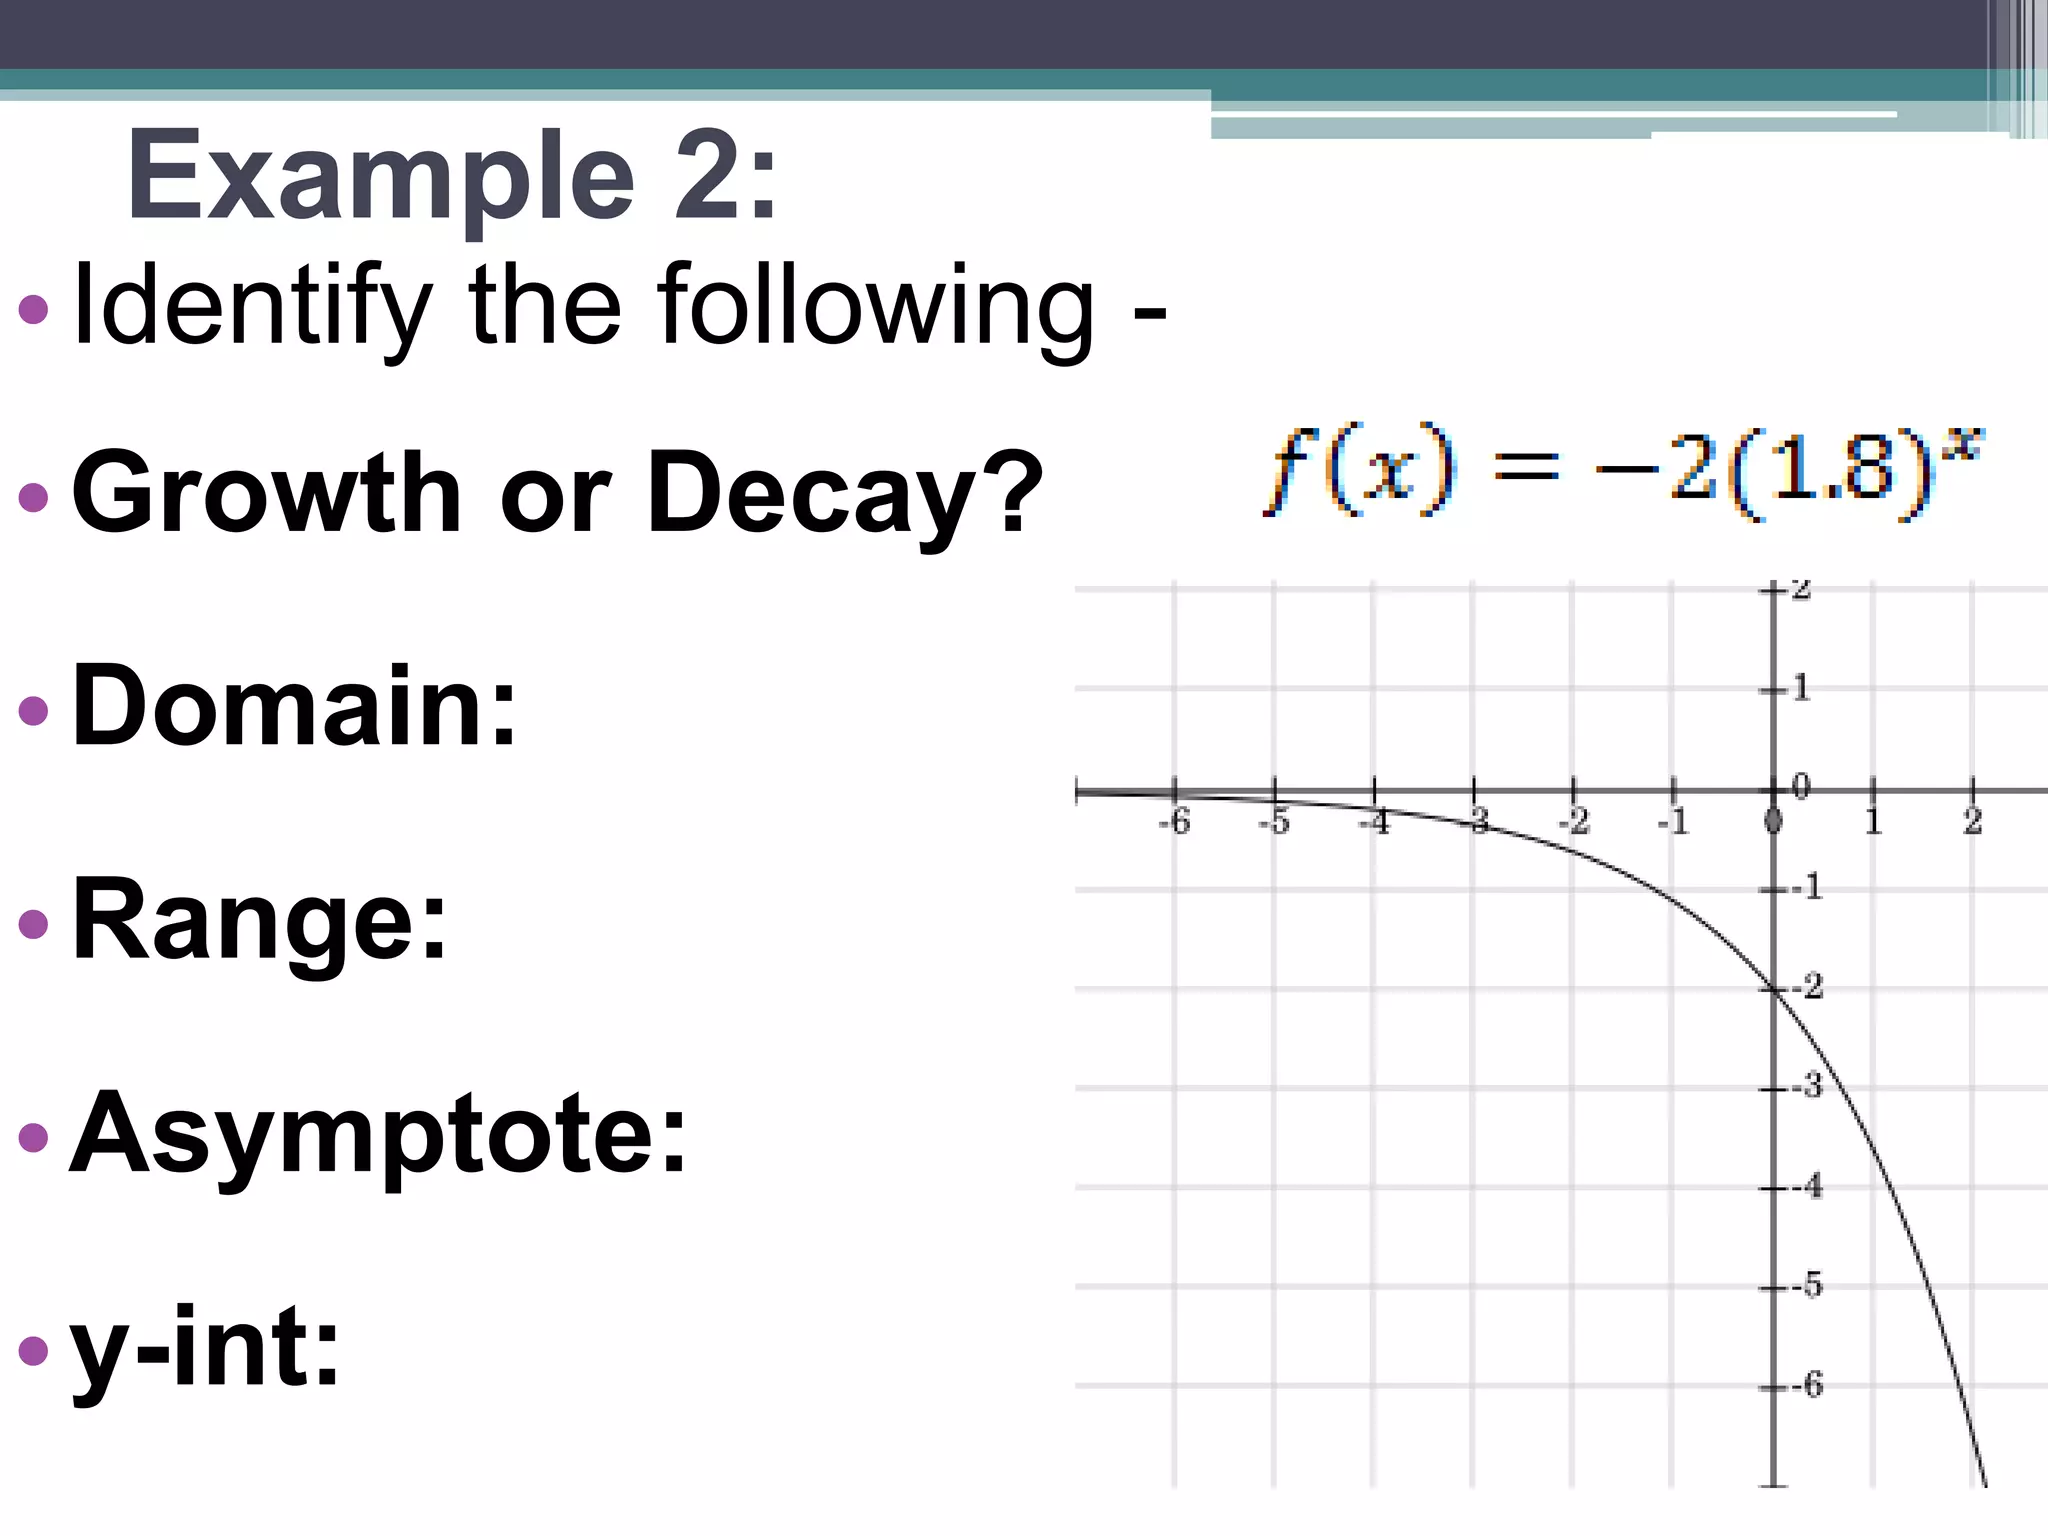
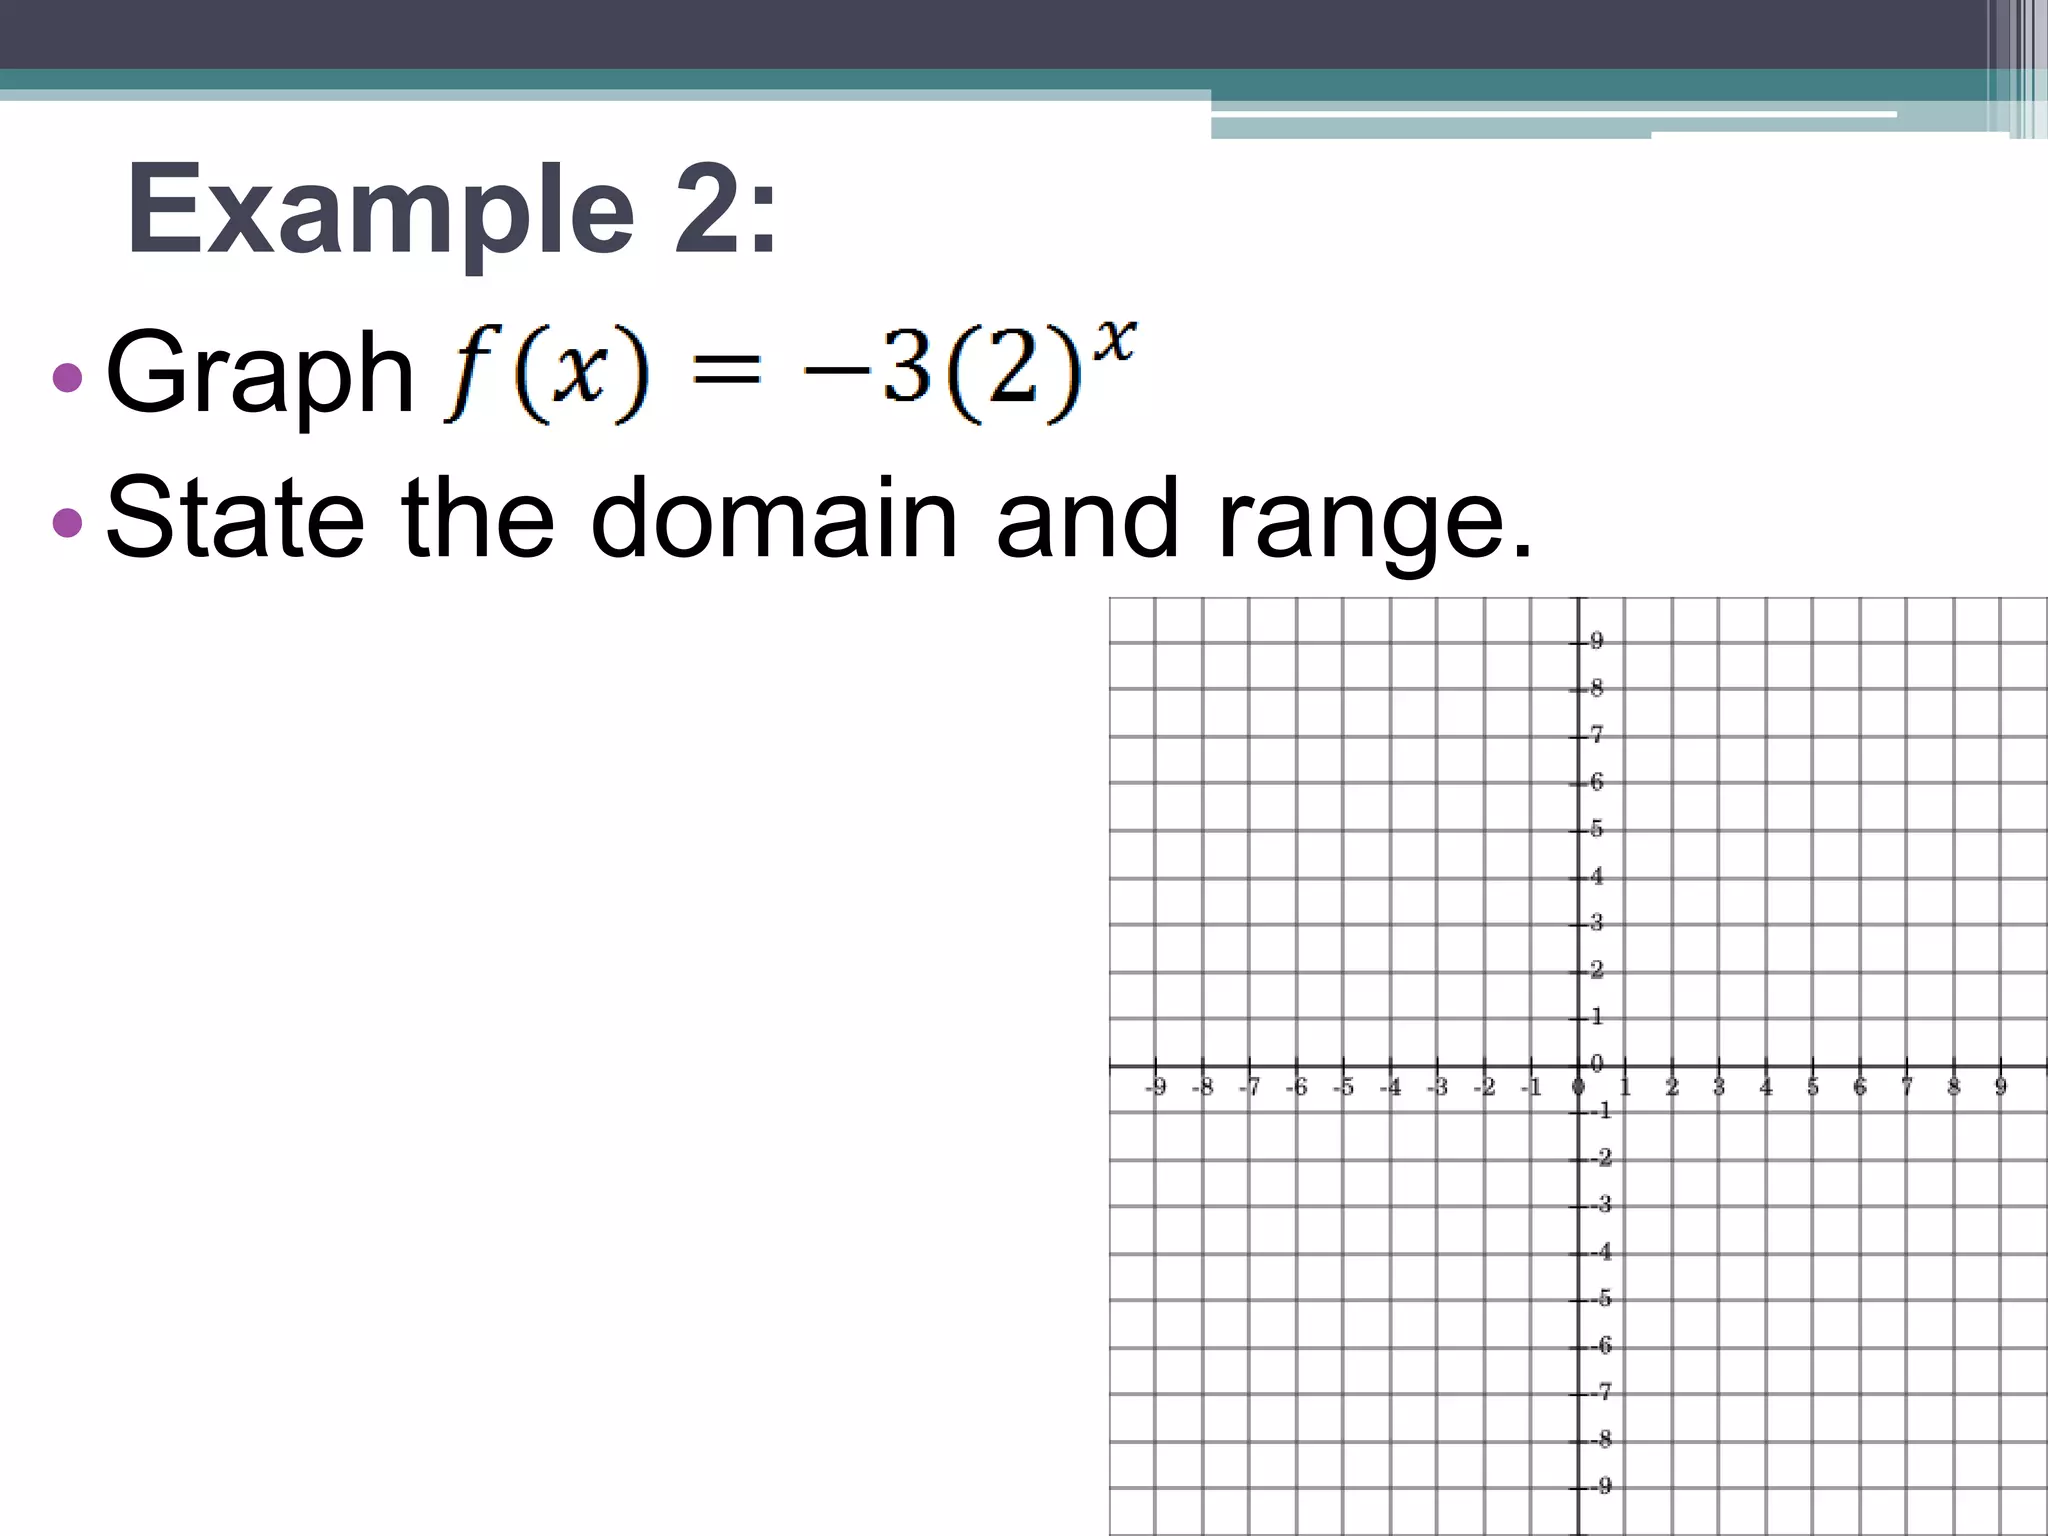
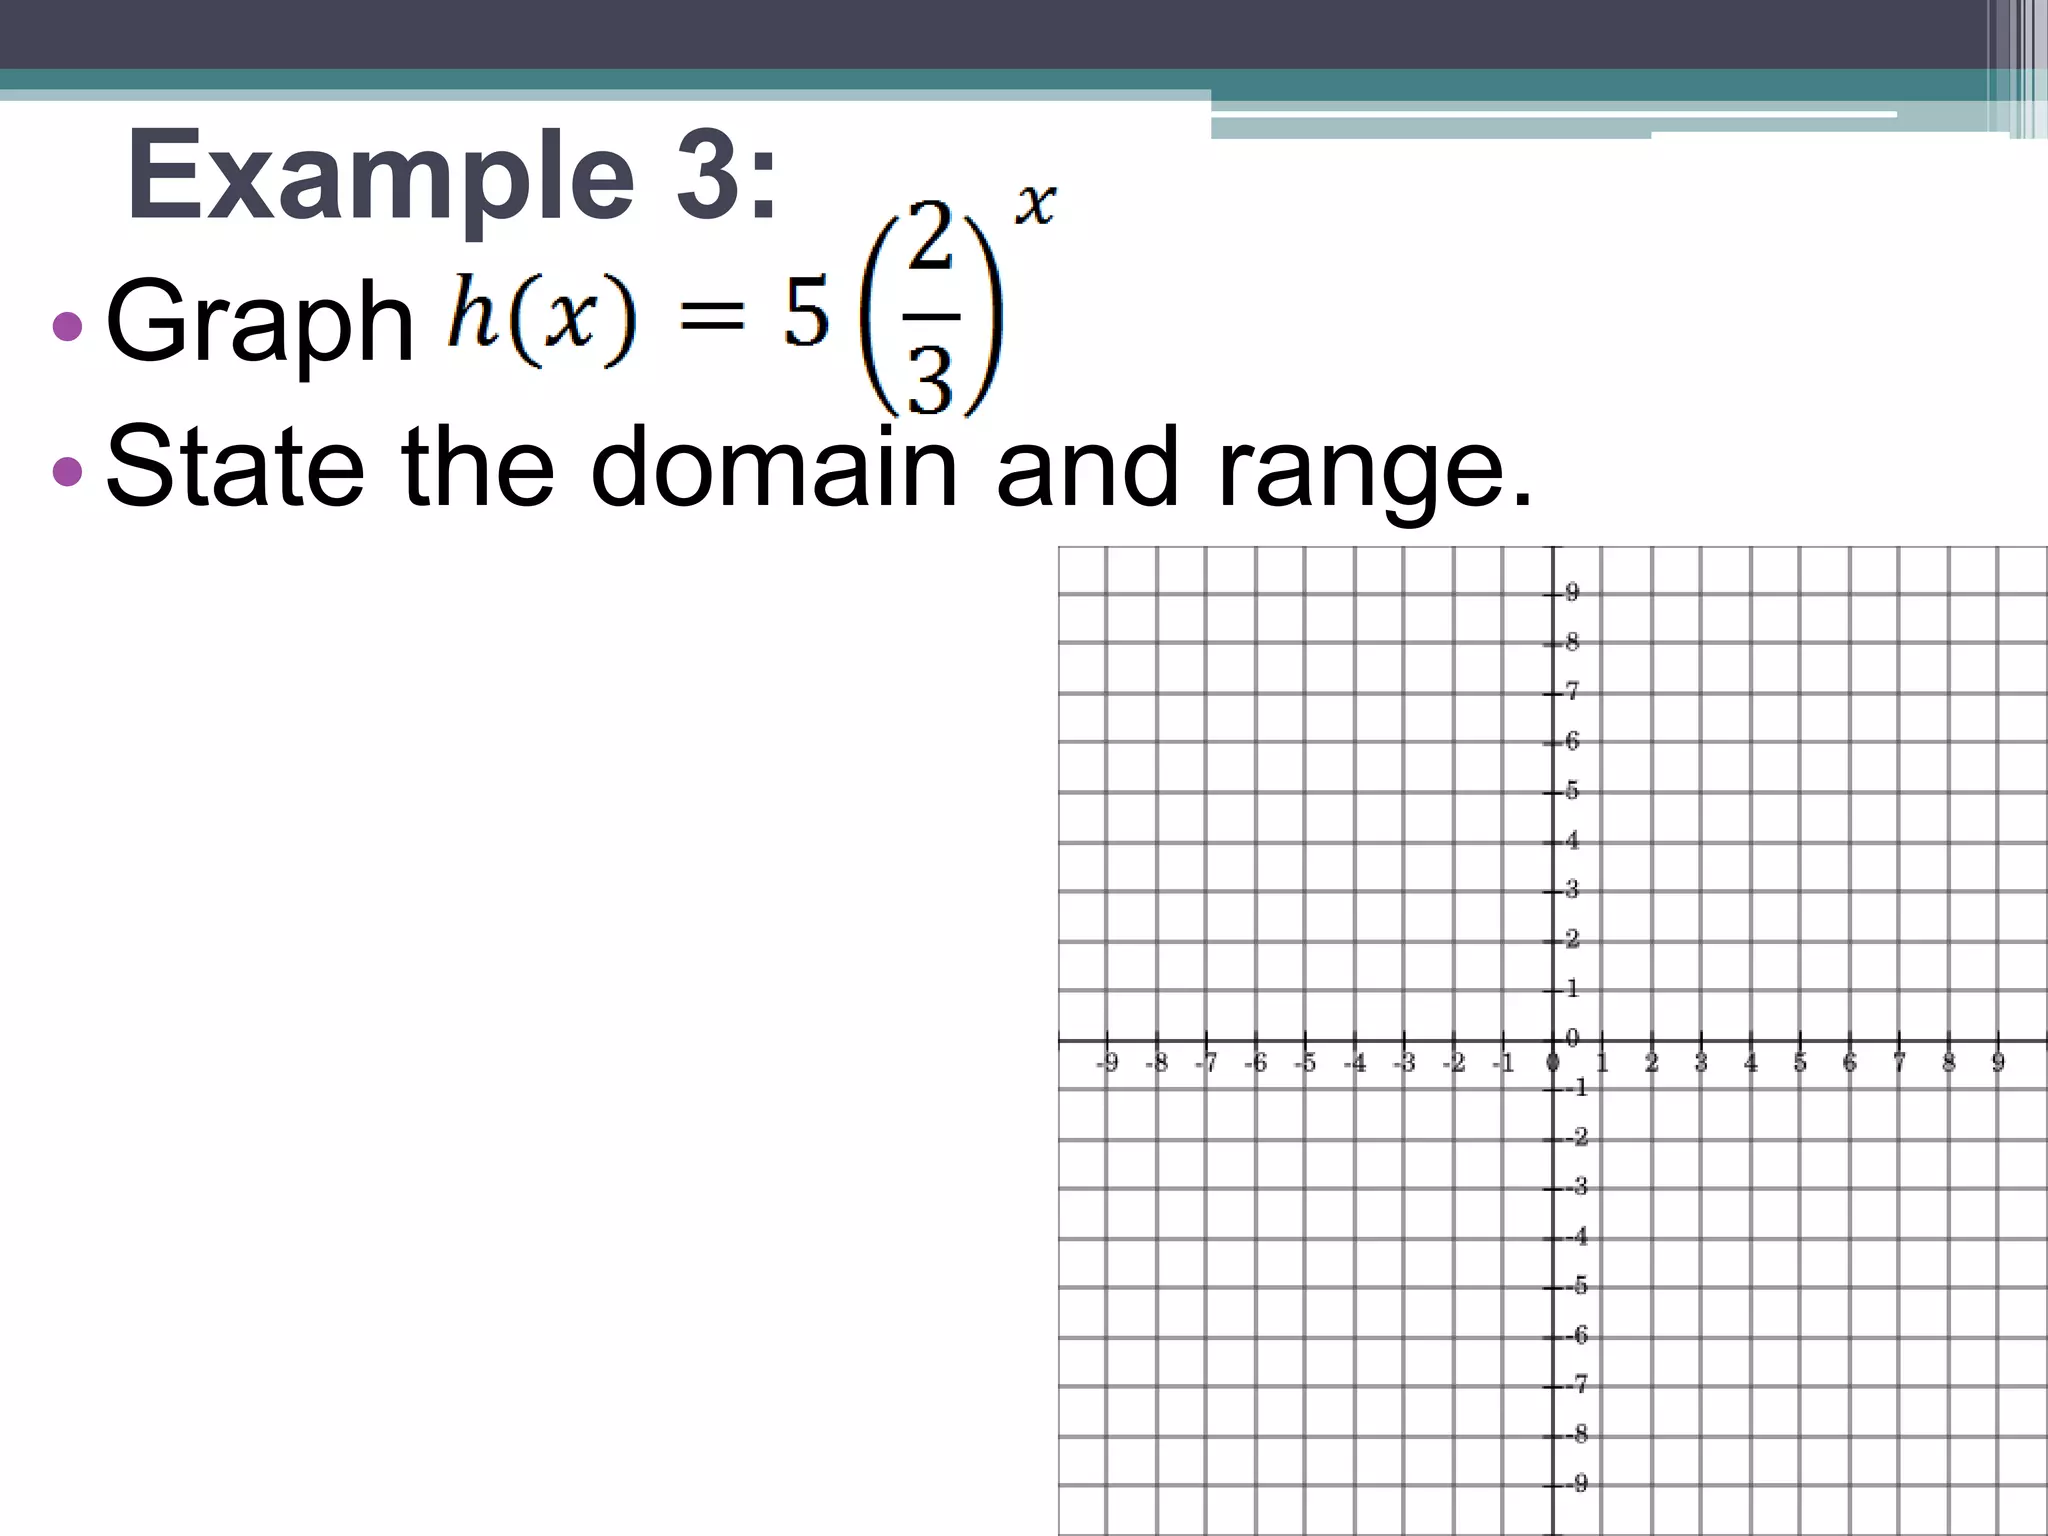
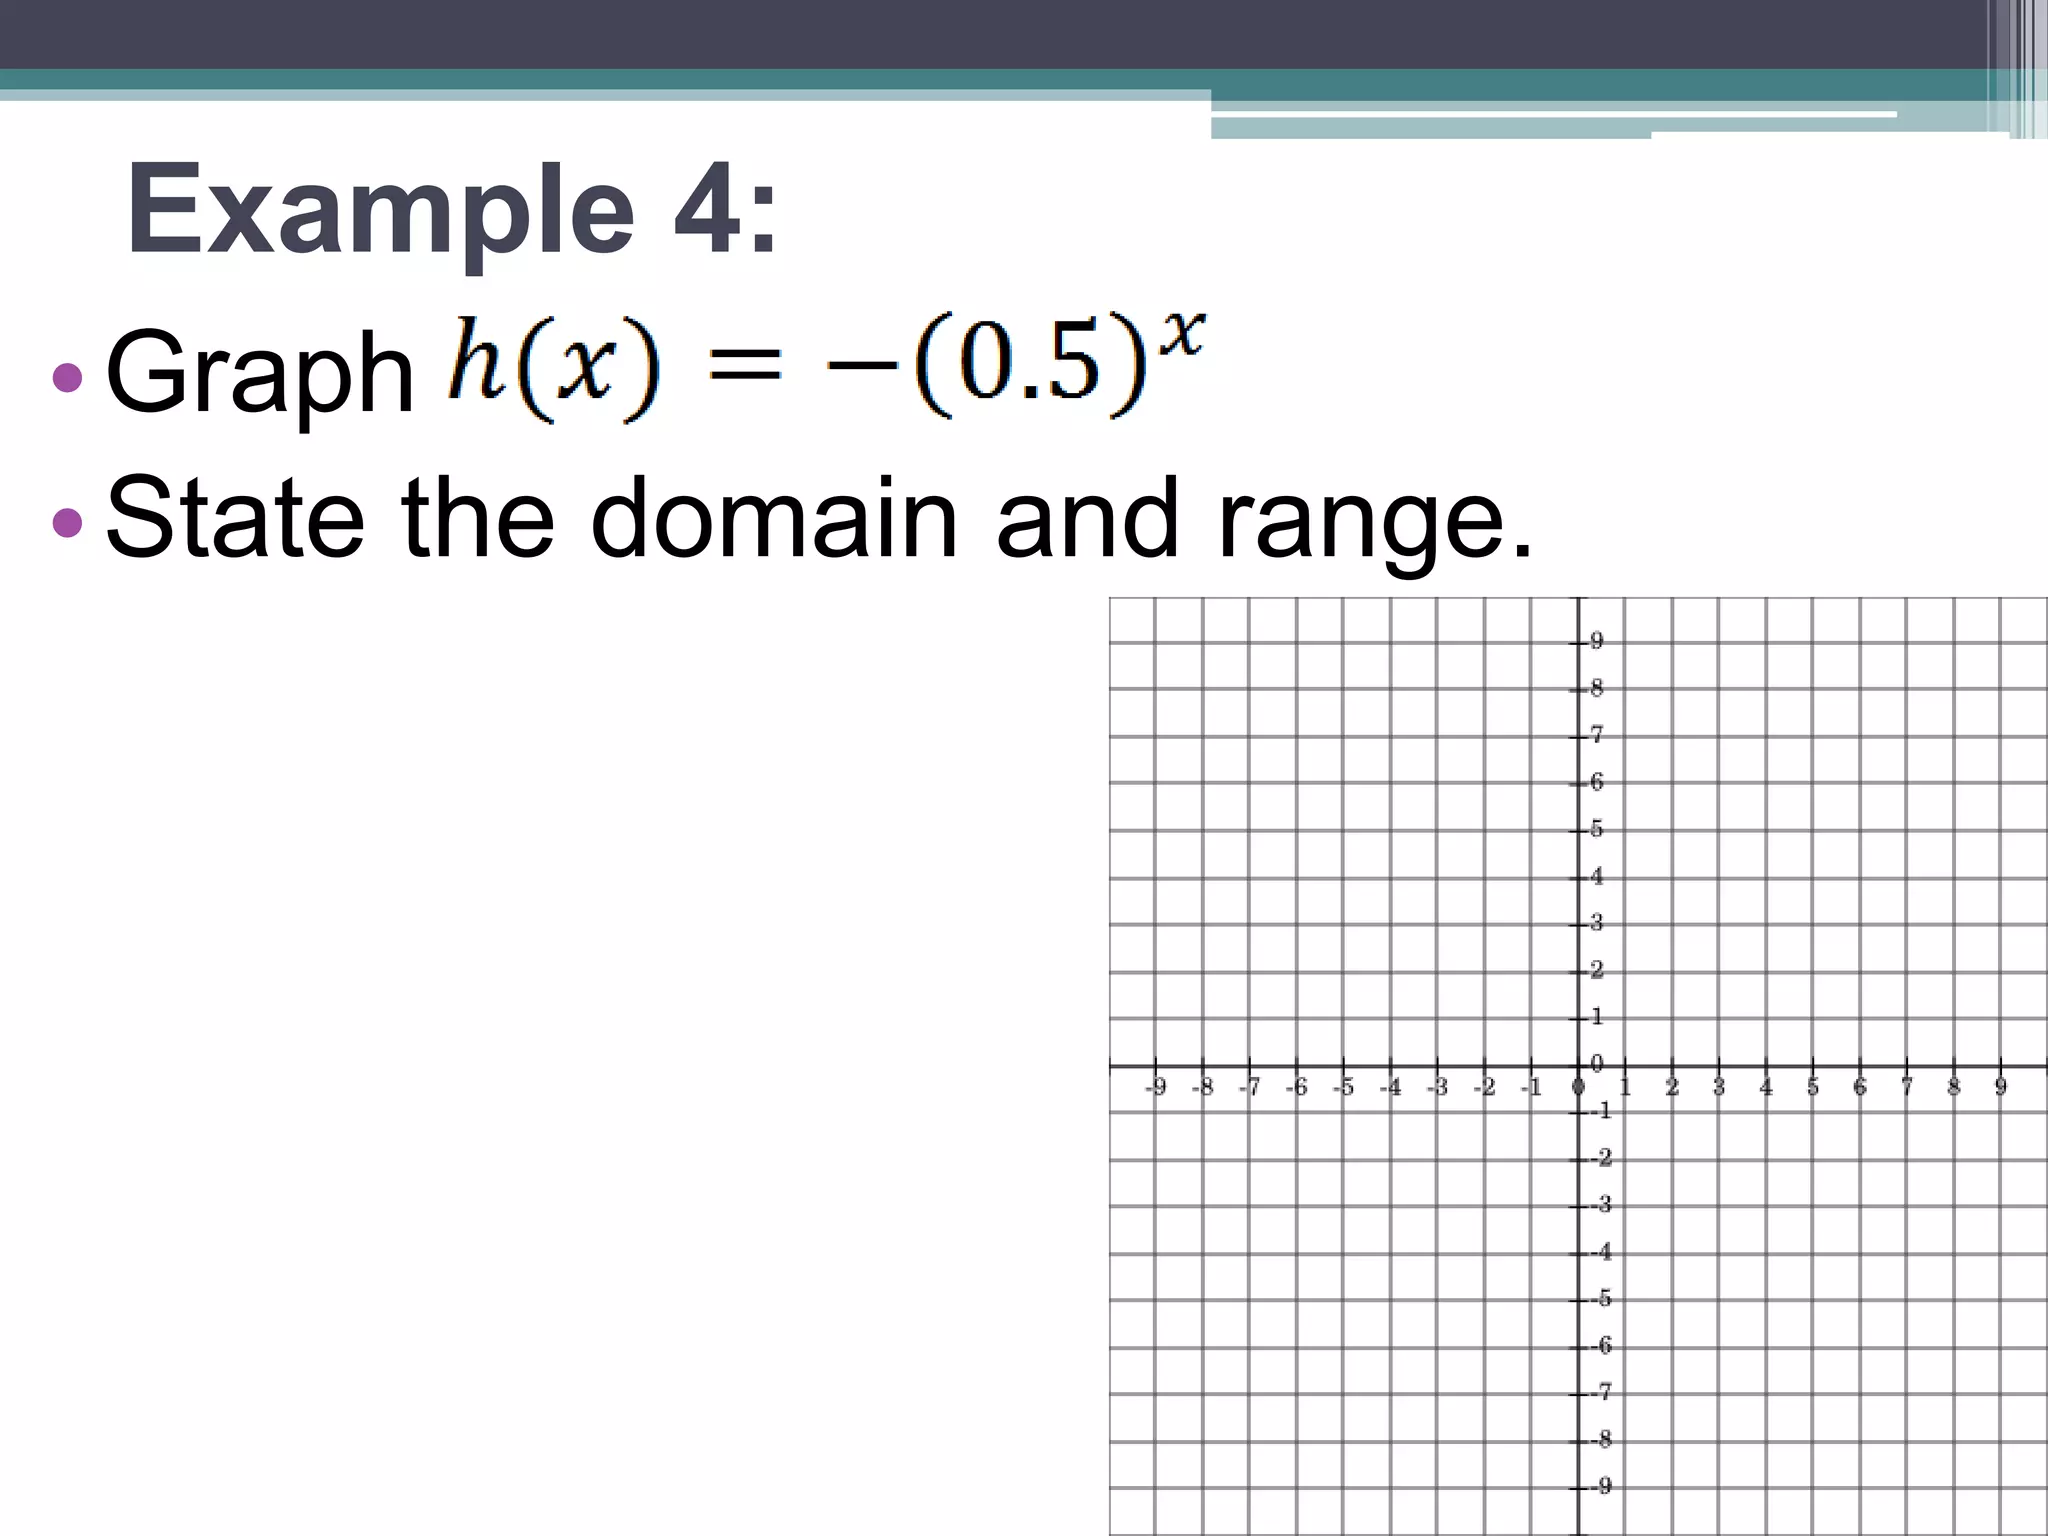
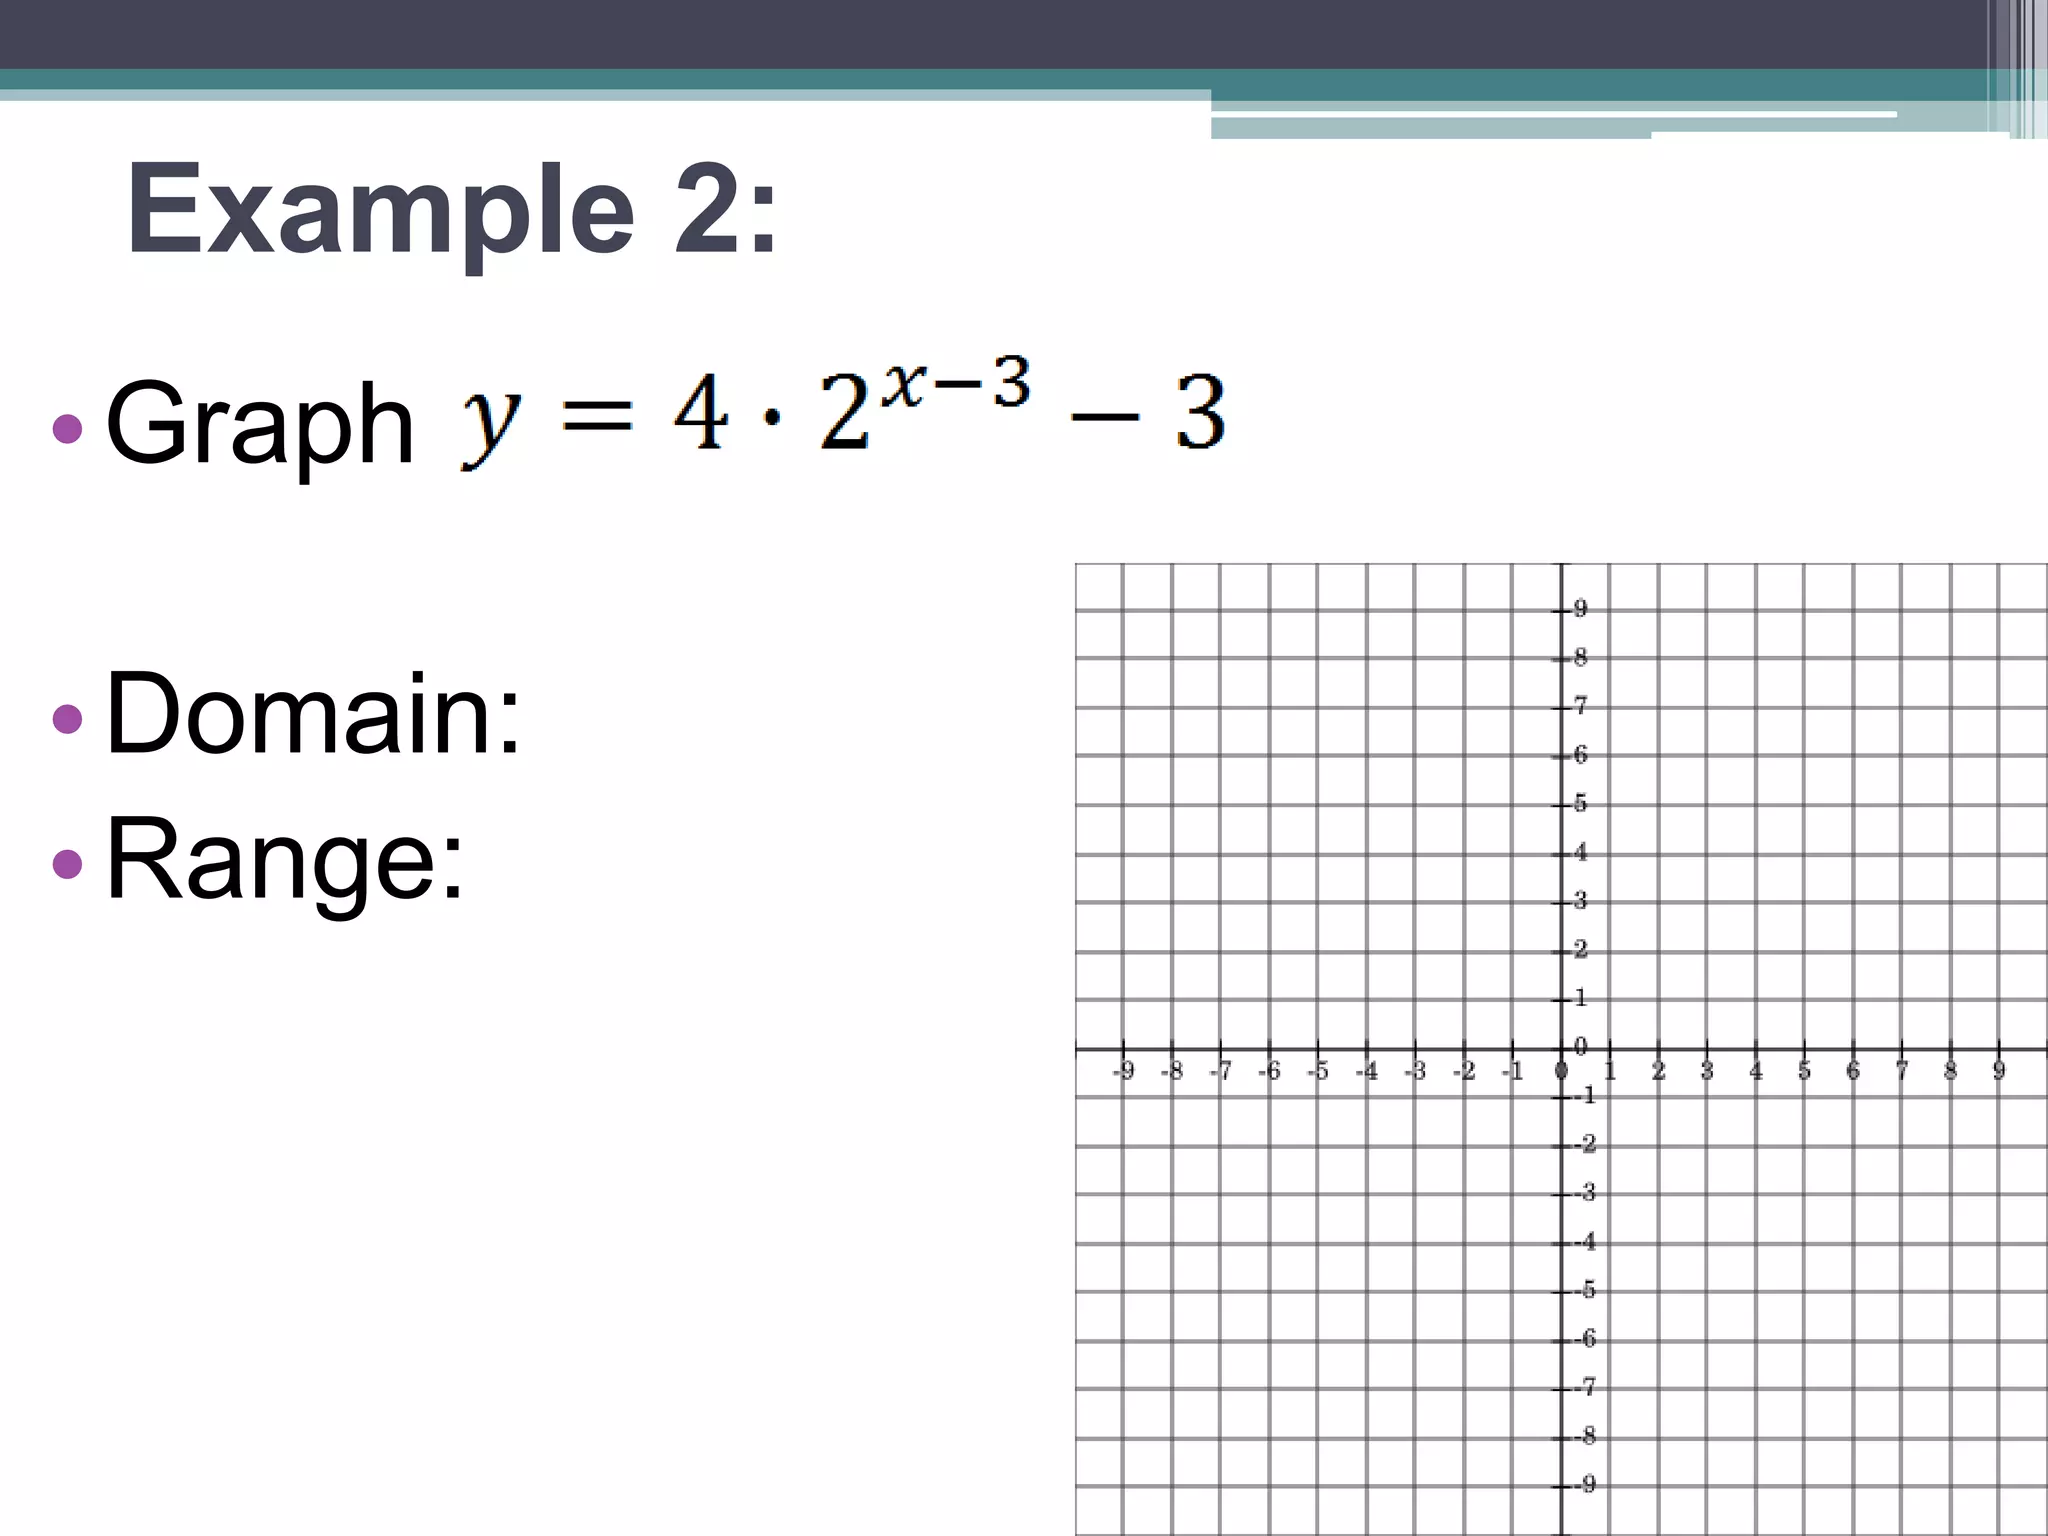
Example 2:
•Identify the following -
•Growth or Decay?
•Domain:
•Range:
•Asymptote:
•y-int:
8.
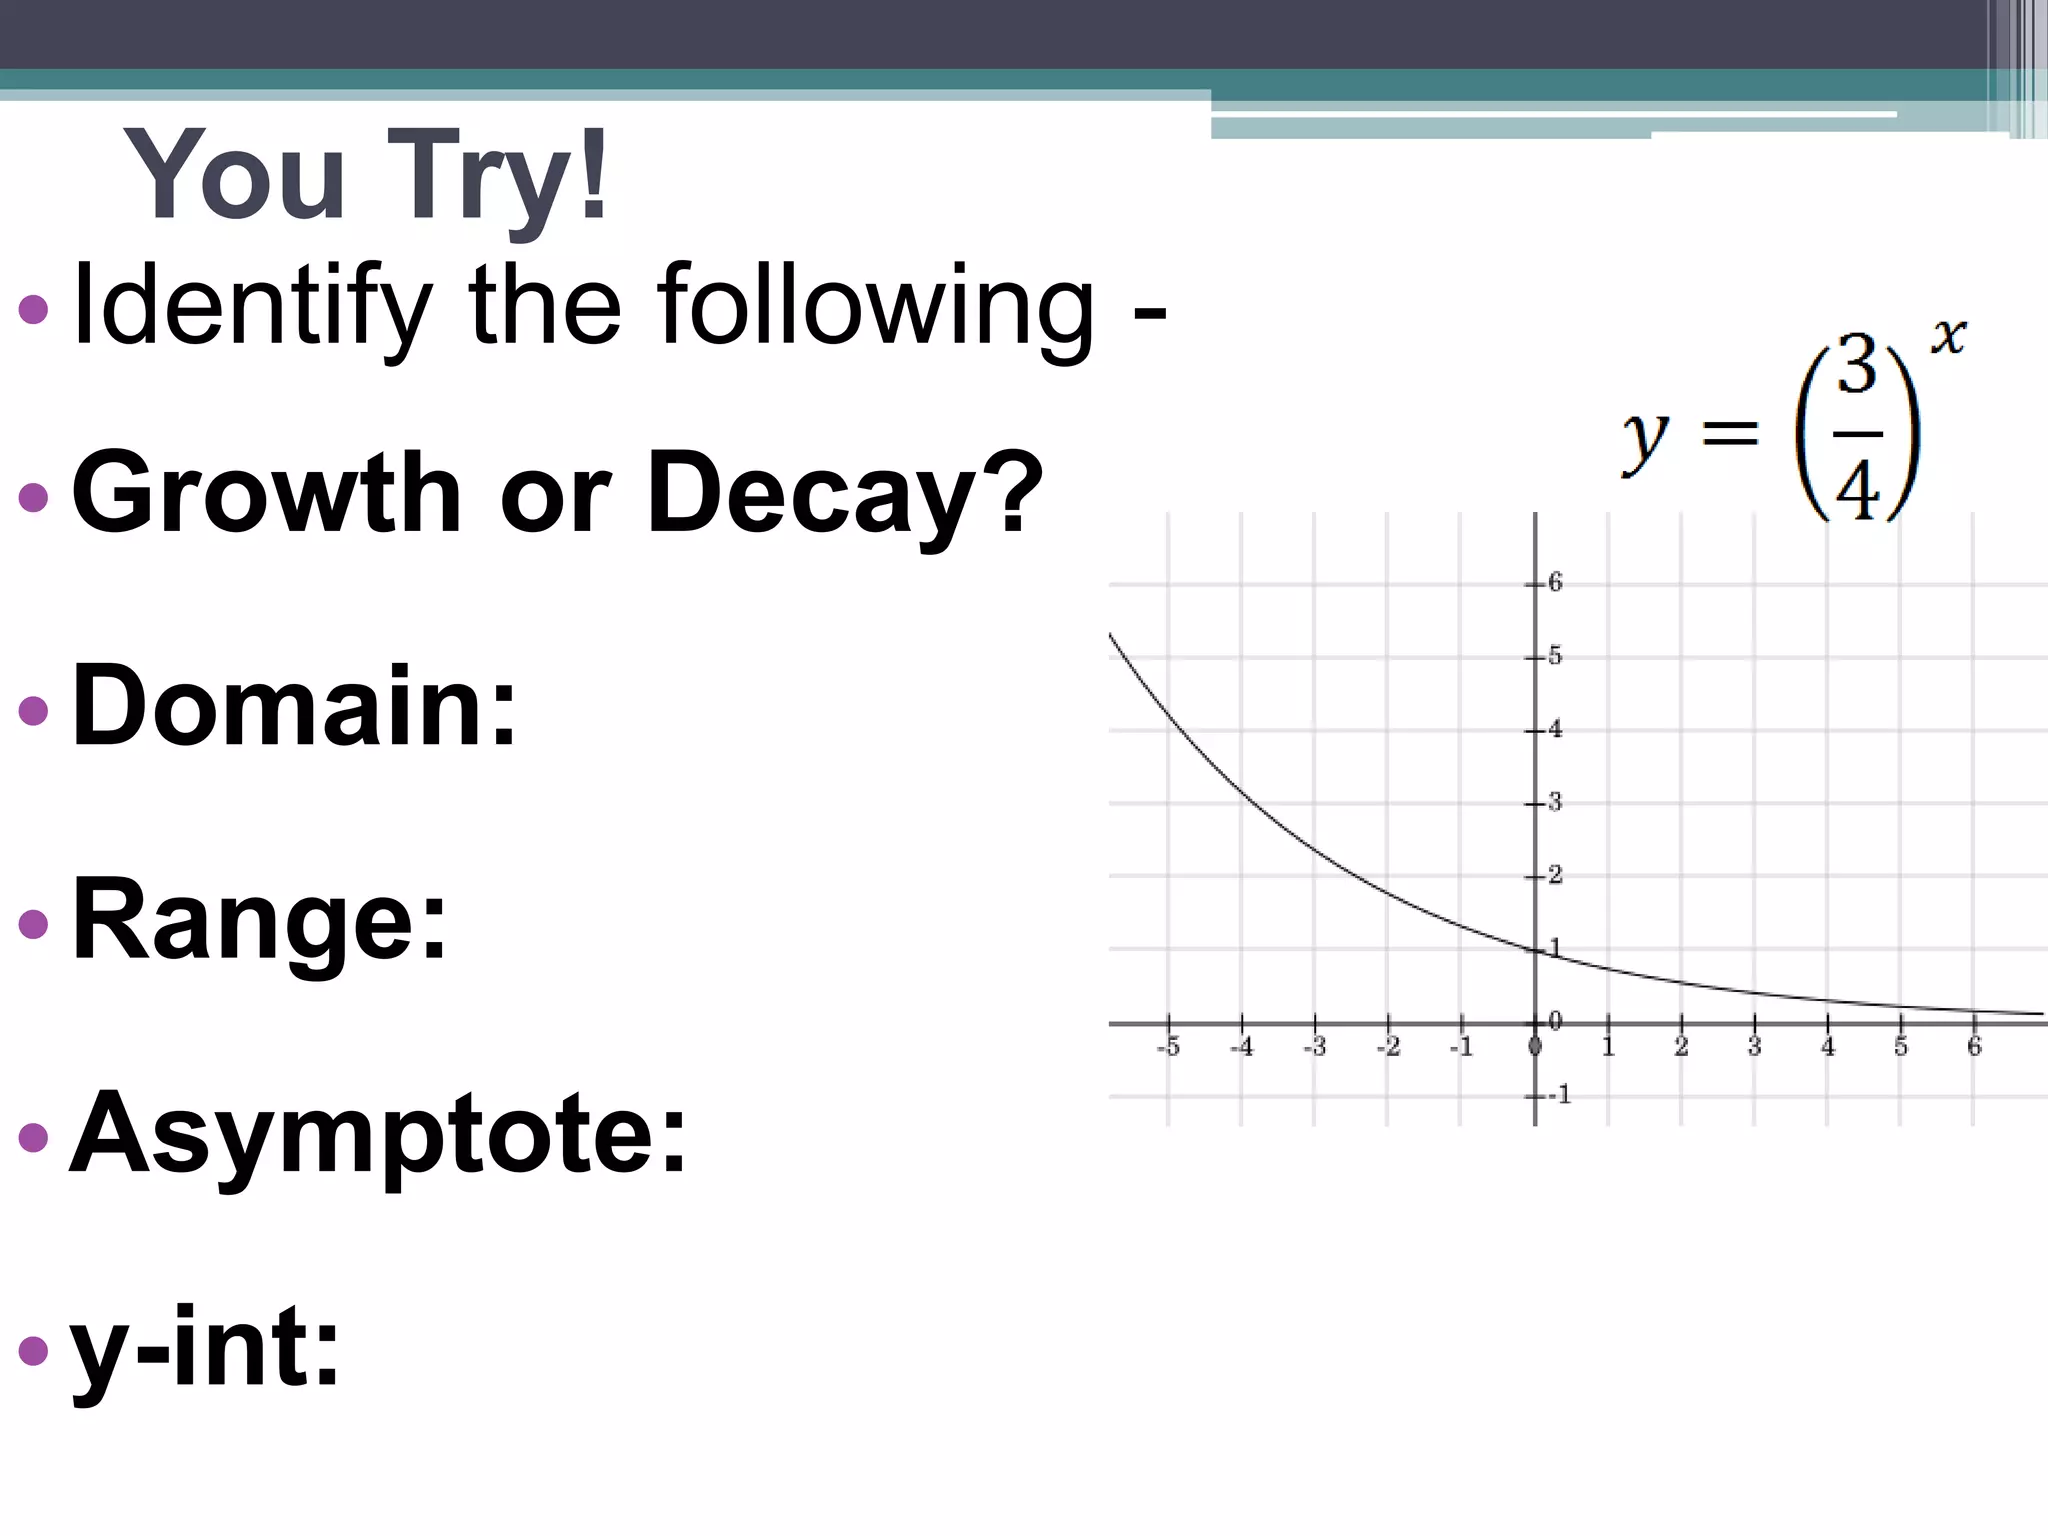
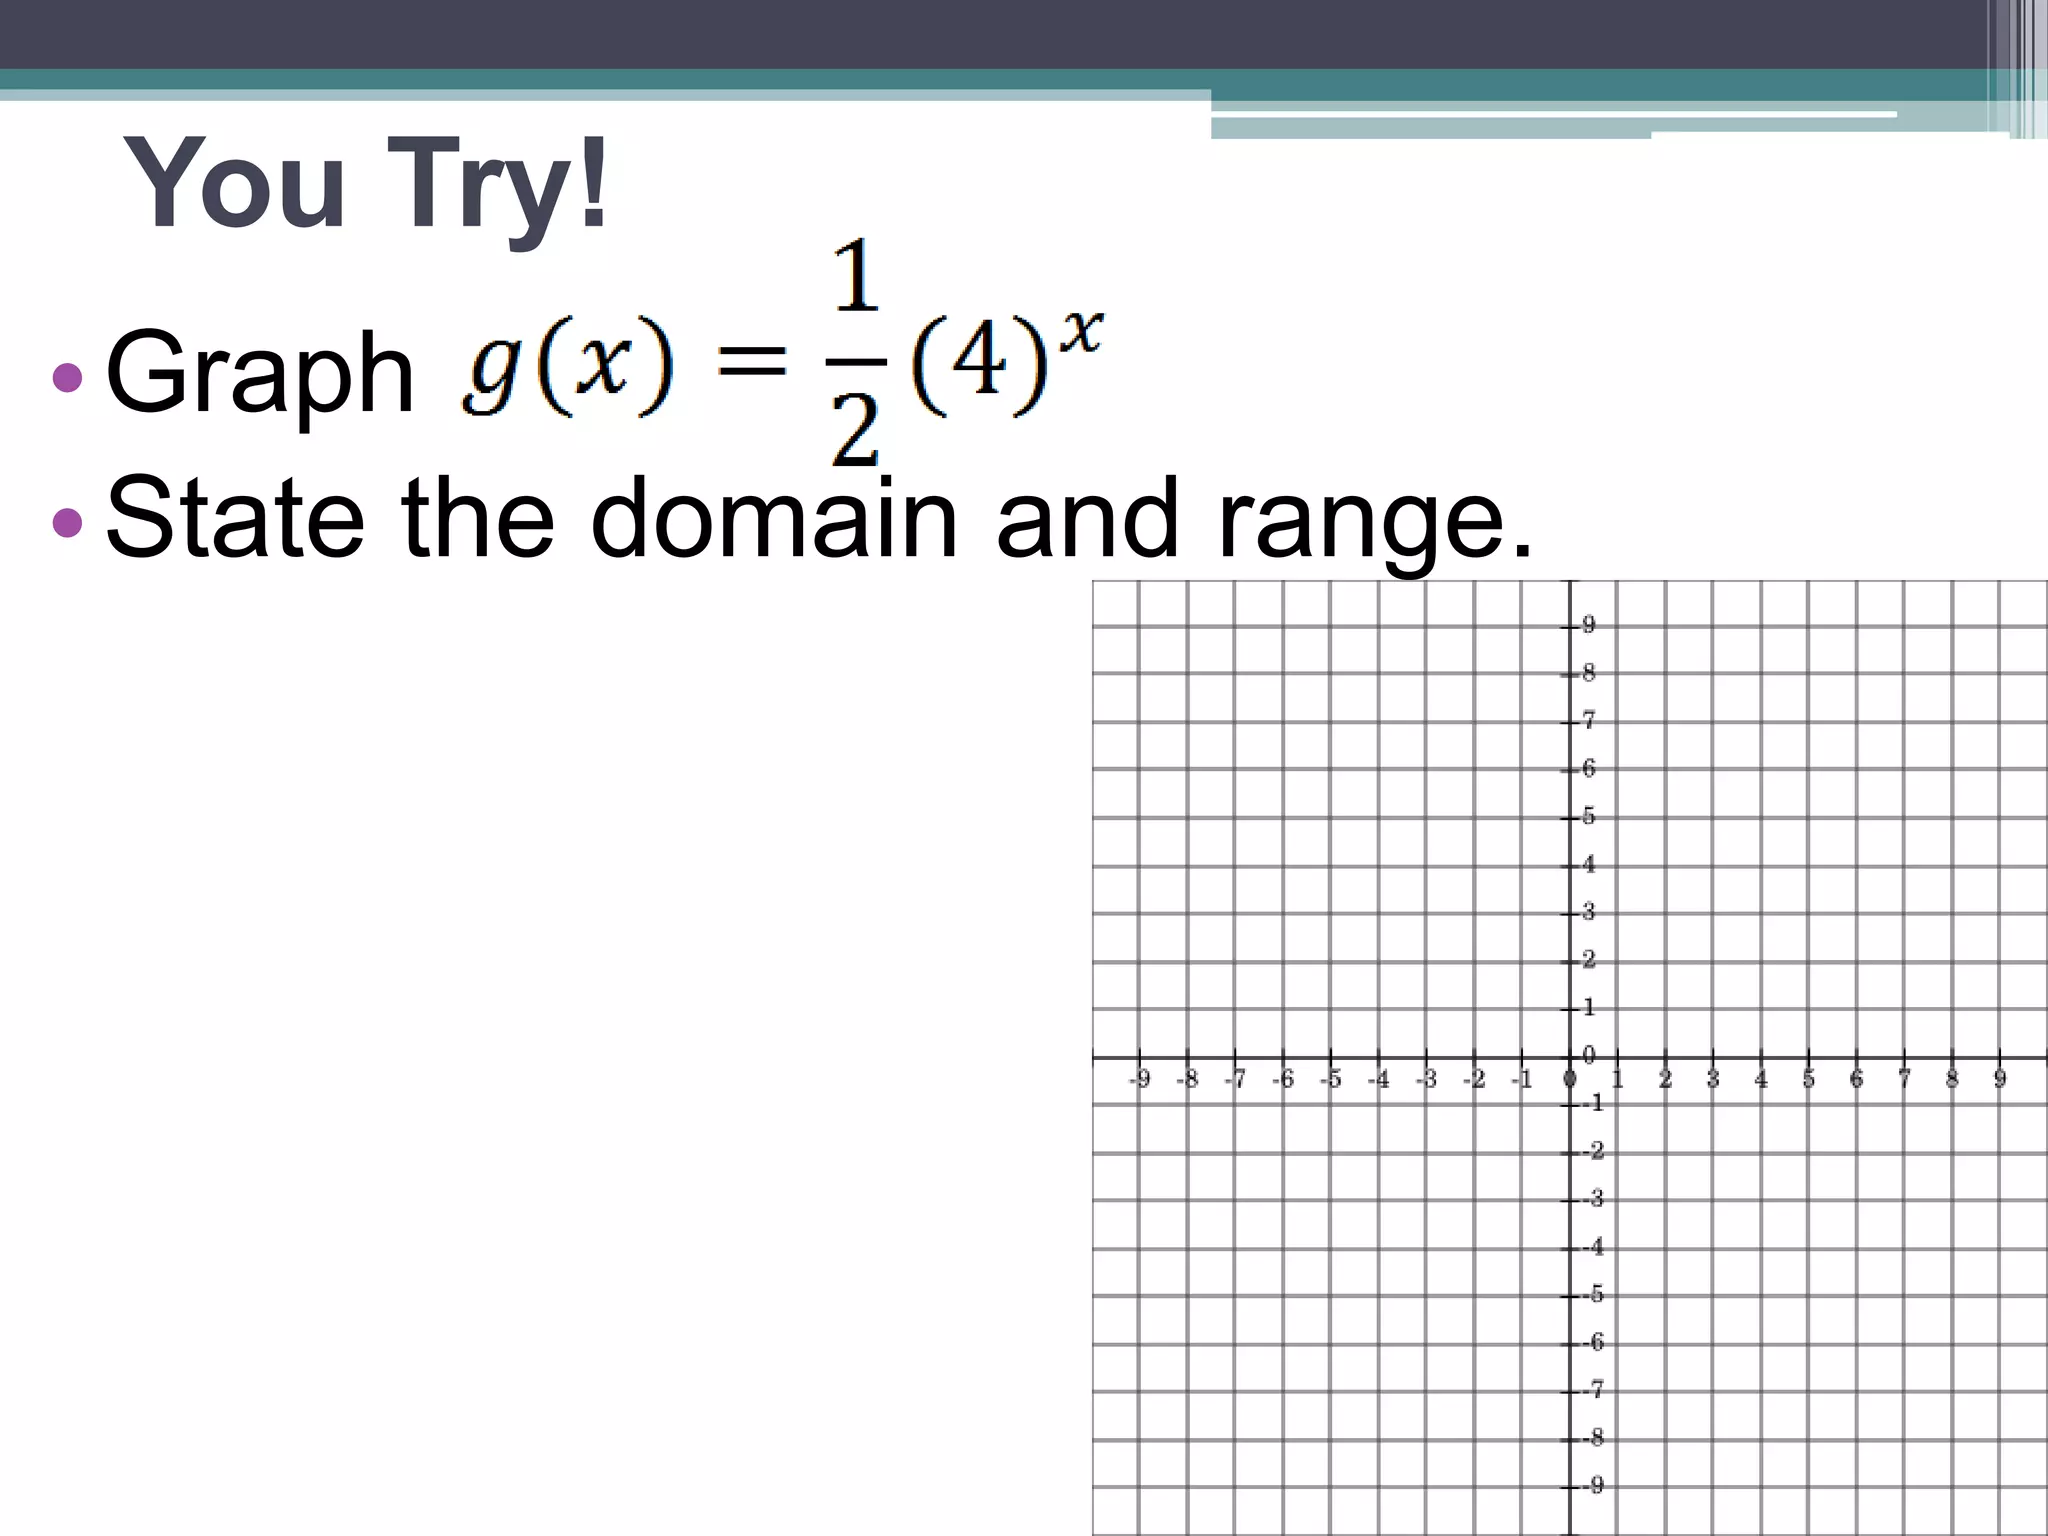
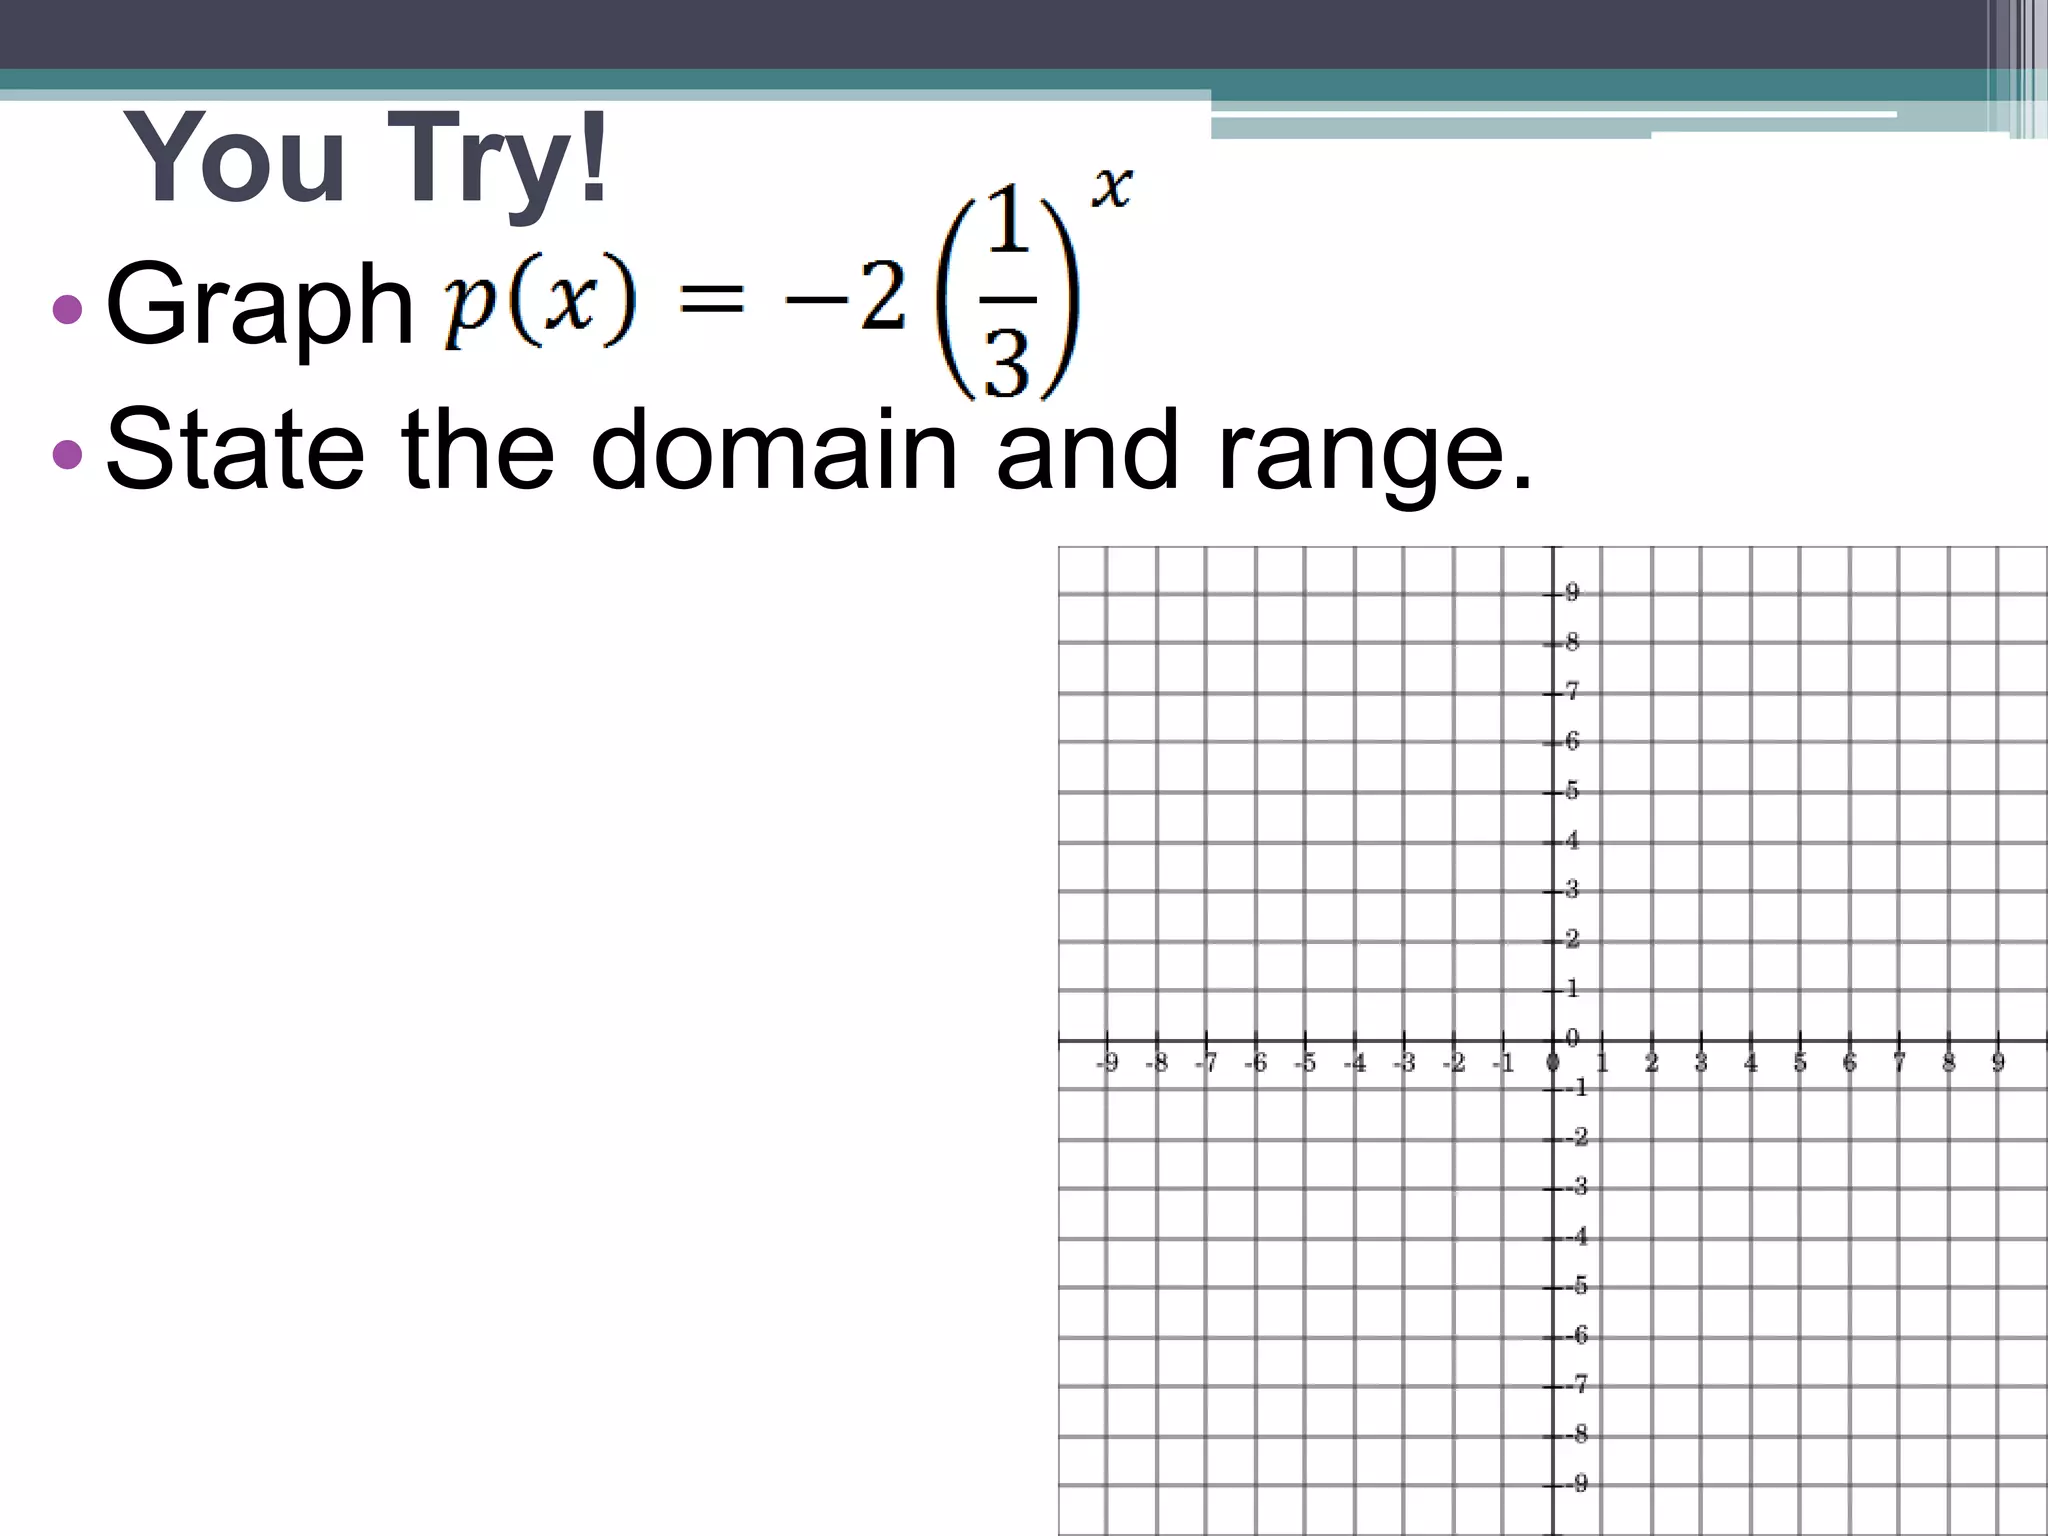
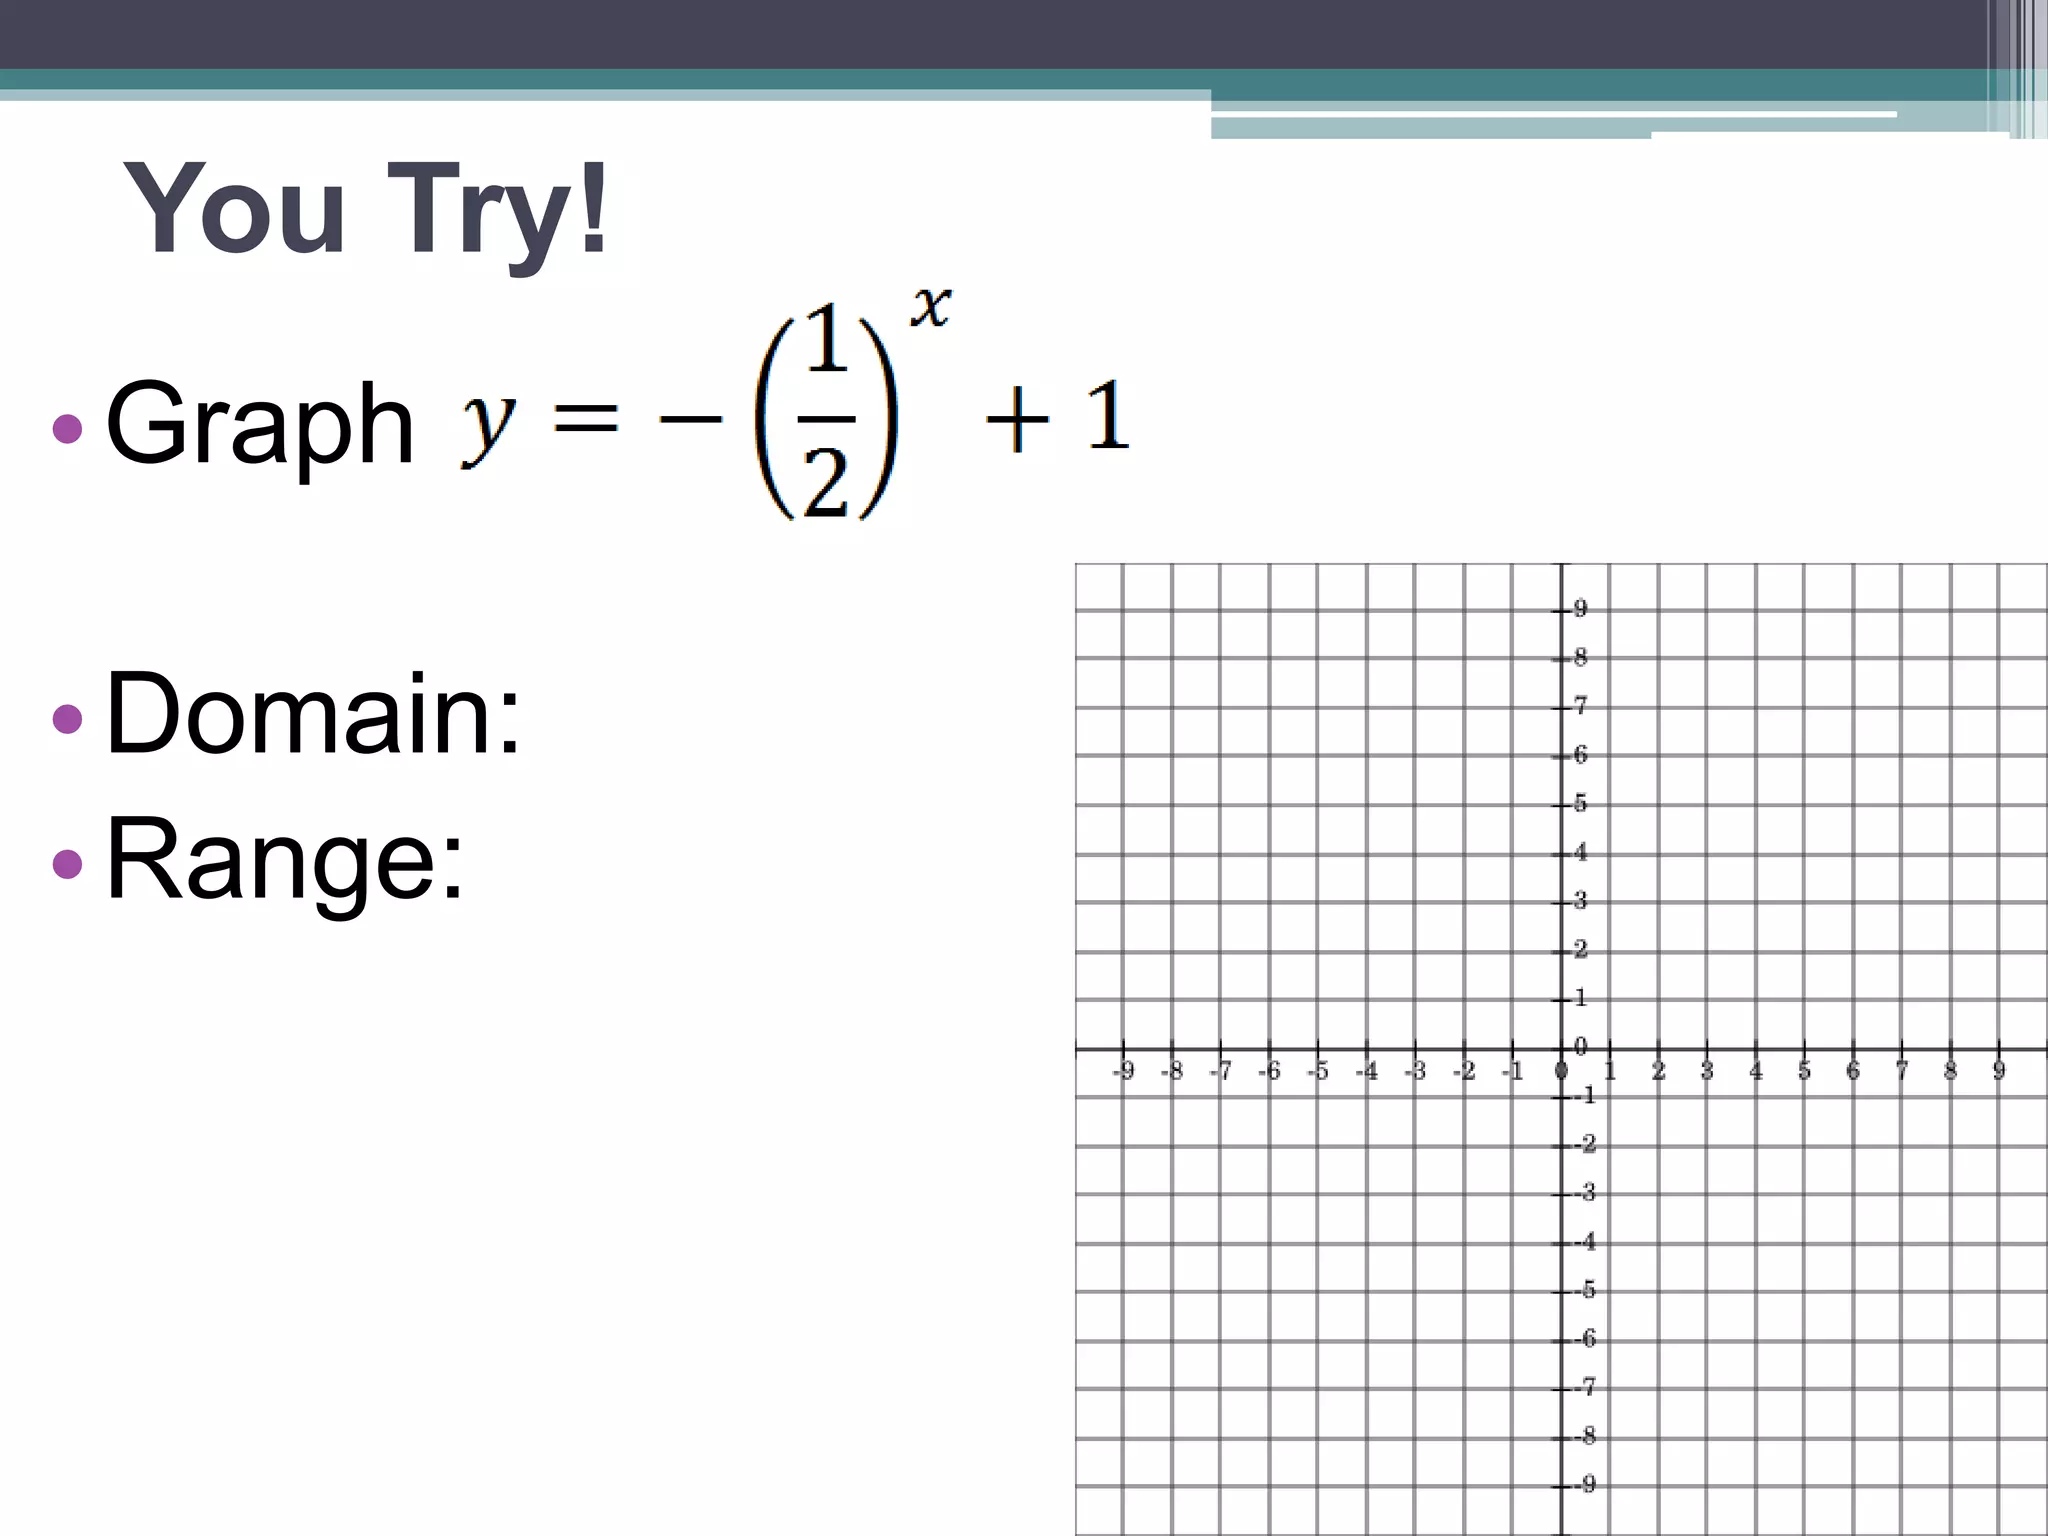
You Try!
•Identify the following -
•Growth or Decay?
•Domain:
•Range:
•Asymptote:
•y-int:
9.
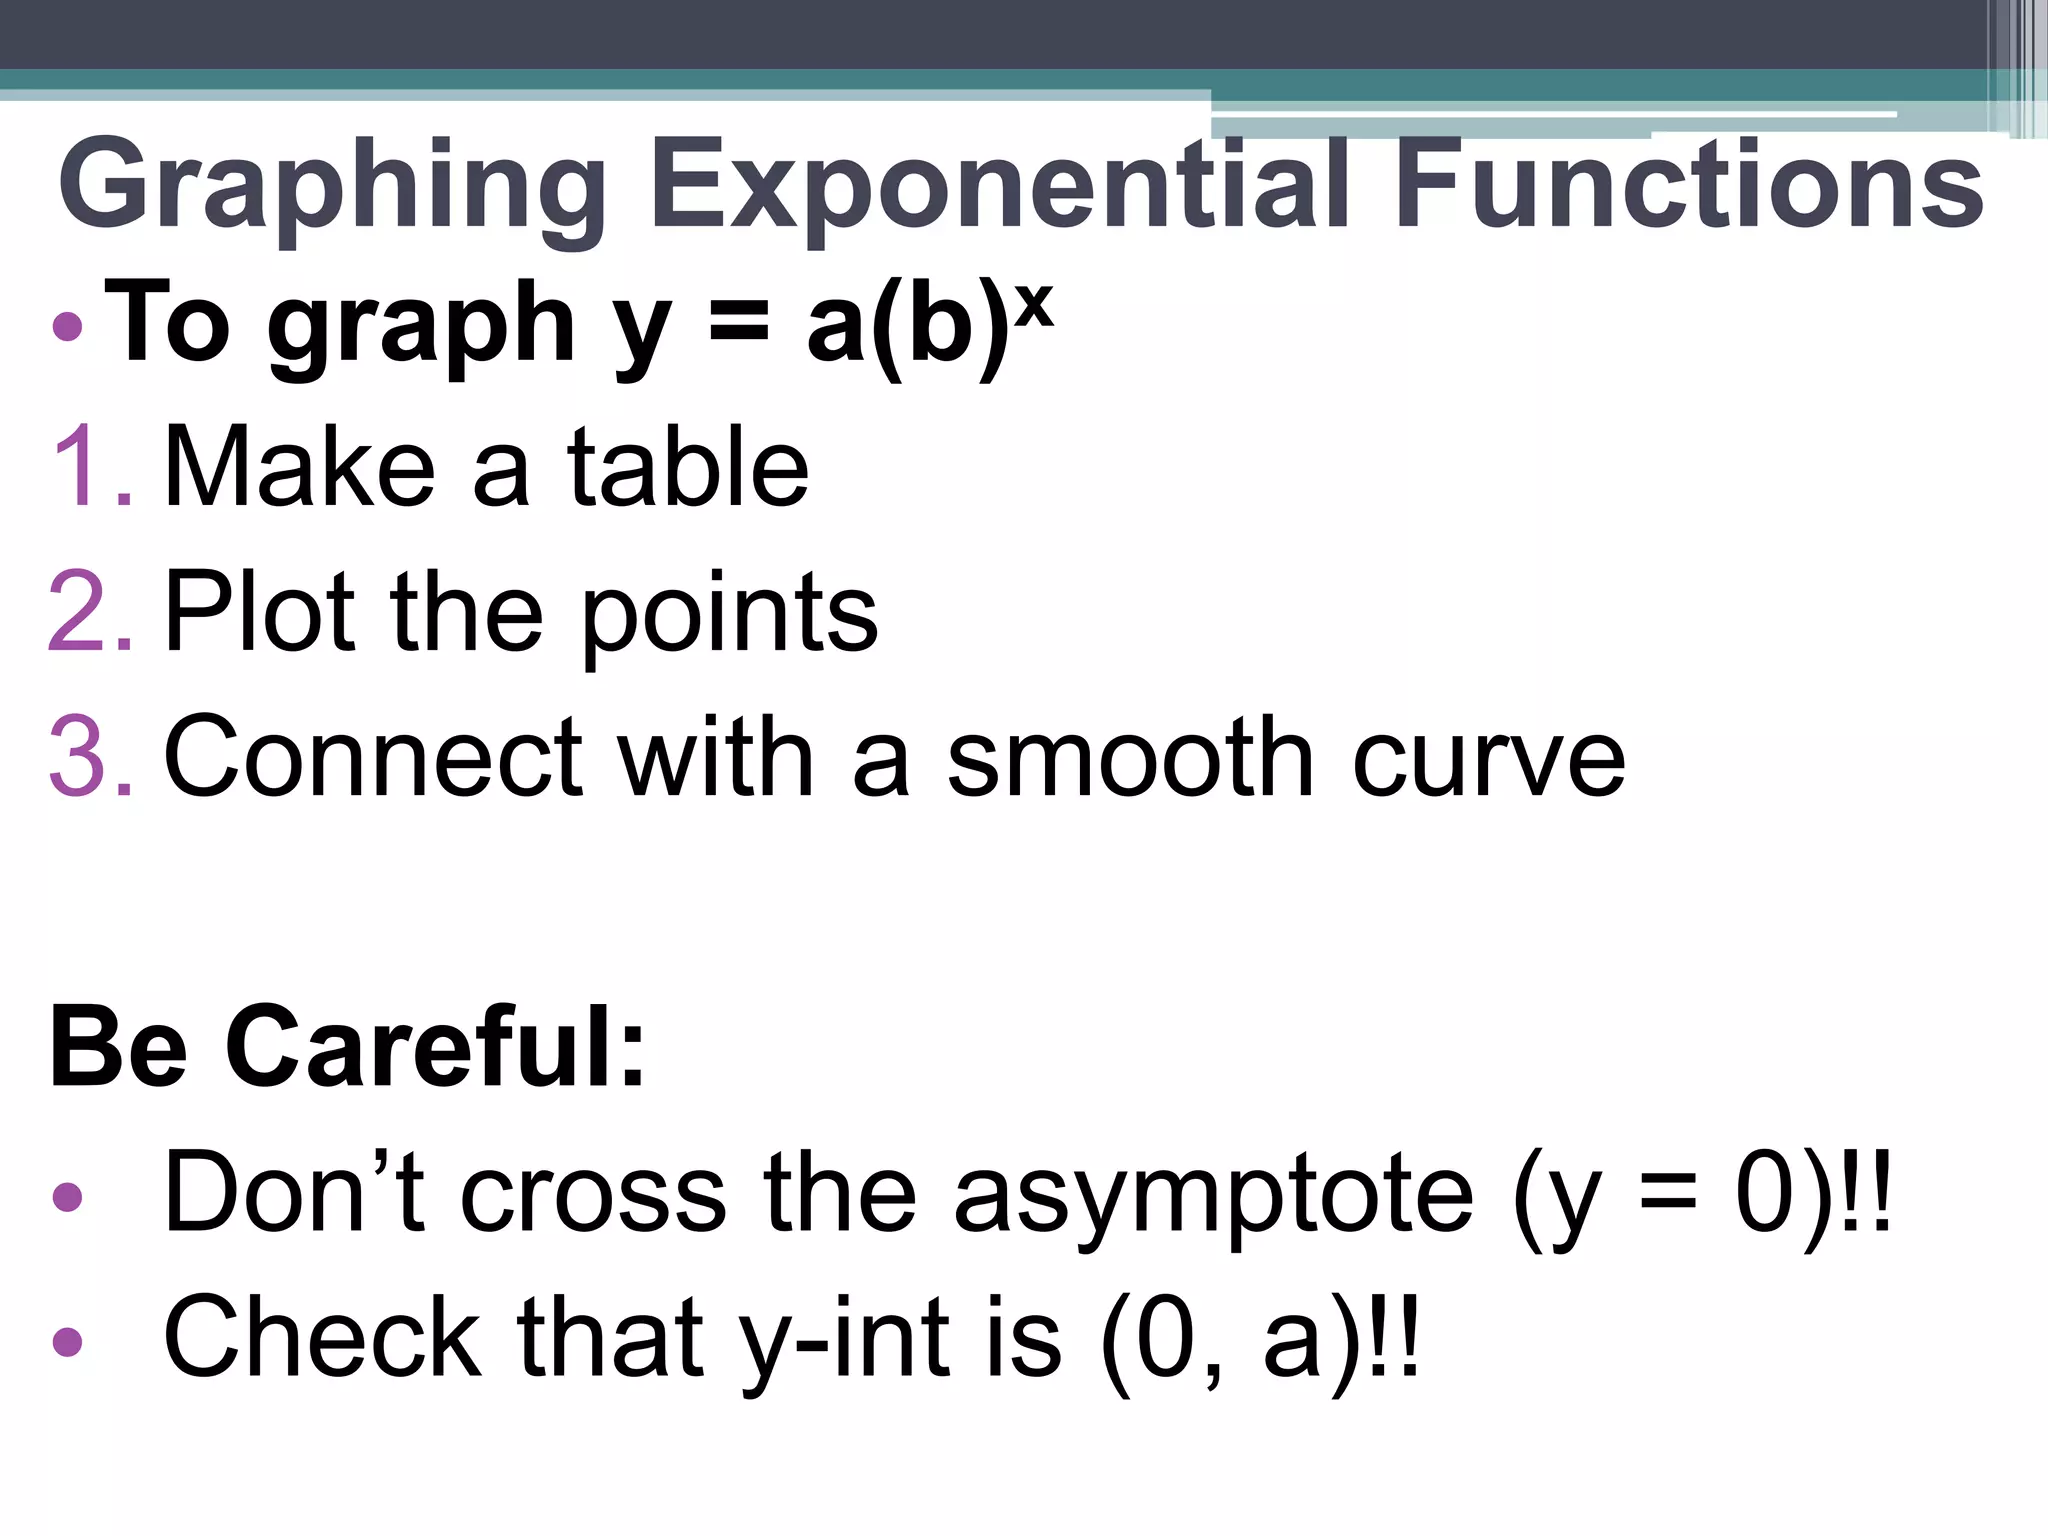
Graphing Exponential Functions
•To graph y = a(b)x
1. Make a table
2. Plot the points
3. Connect with a smooth curve
Be Careful:
• Don’t cross the asymptote (y = 0)!!
• Check that y-int is (0, a)!!
Transformations
•Remember:
•+and – mean shift
•Changing the input shifts left/right
▫ Do the opposite!!
•Changing the output shifts up/down
•We will call the original function
y = a(b)x the “parent function”
• Its graph is the “parent graph”
17.
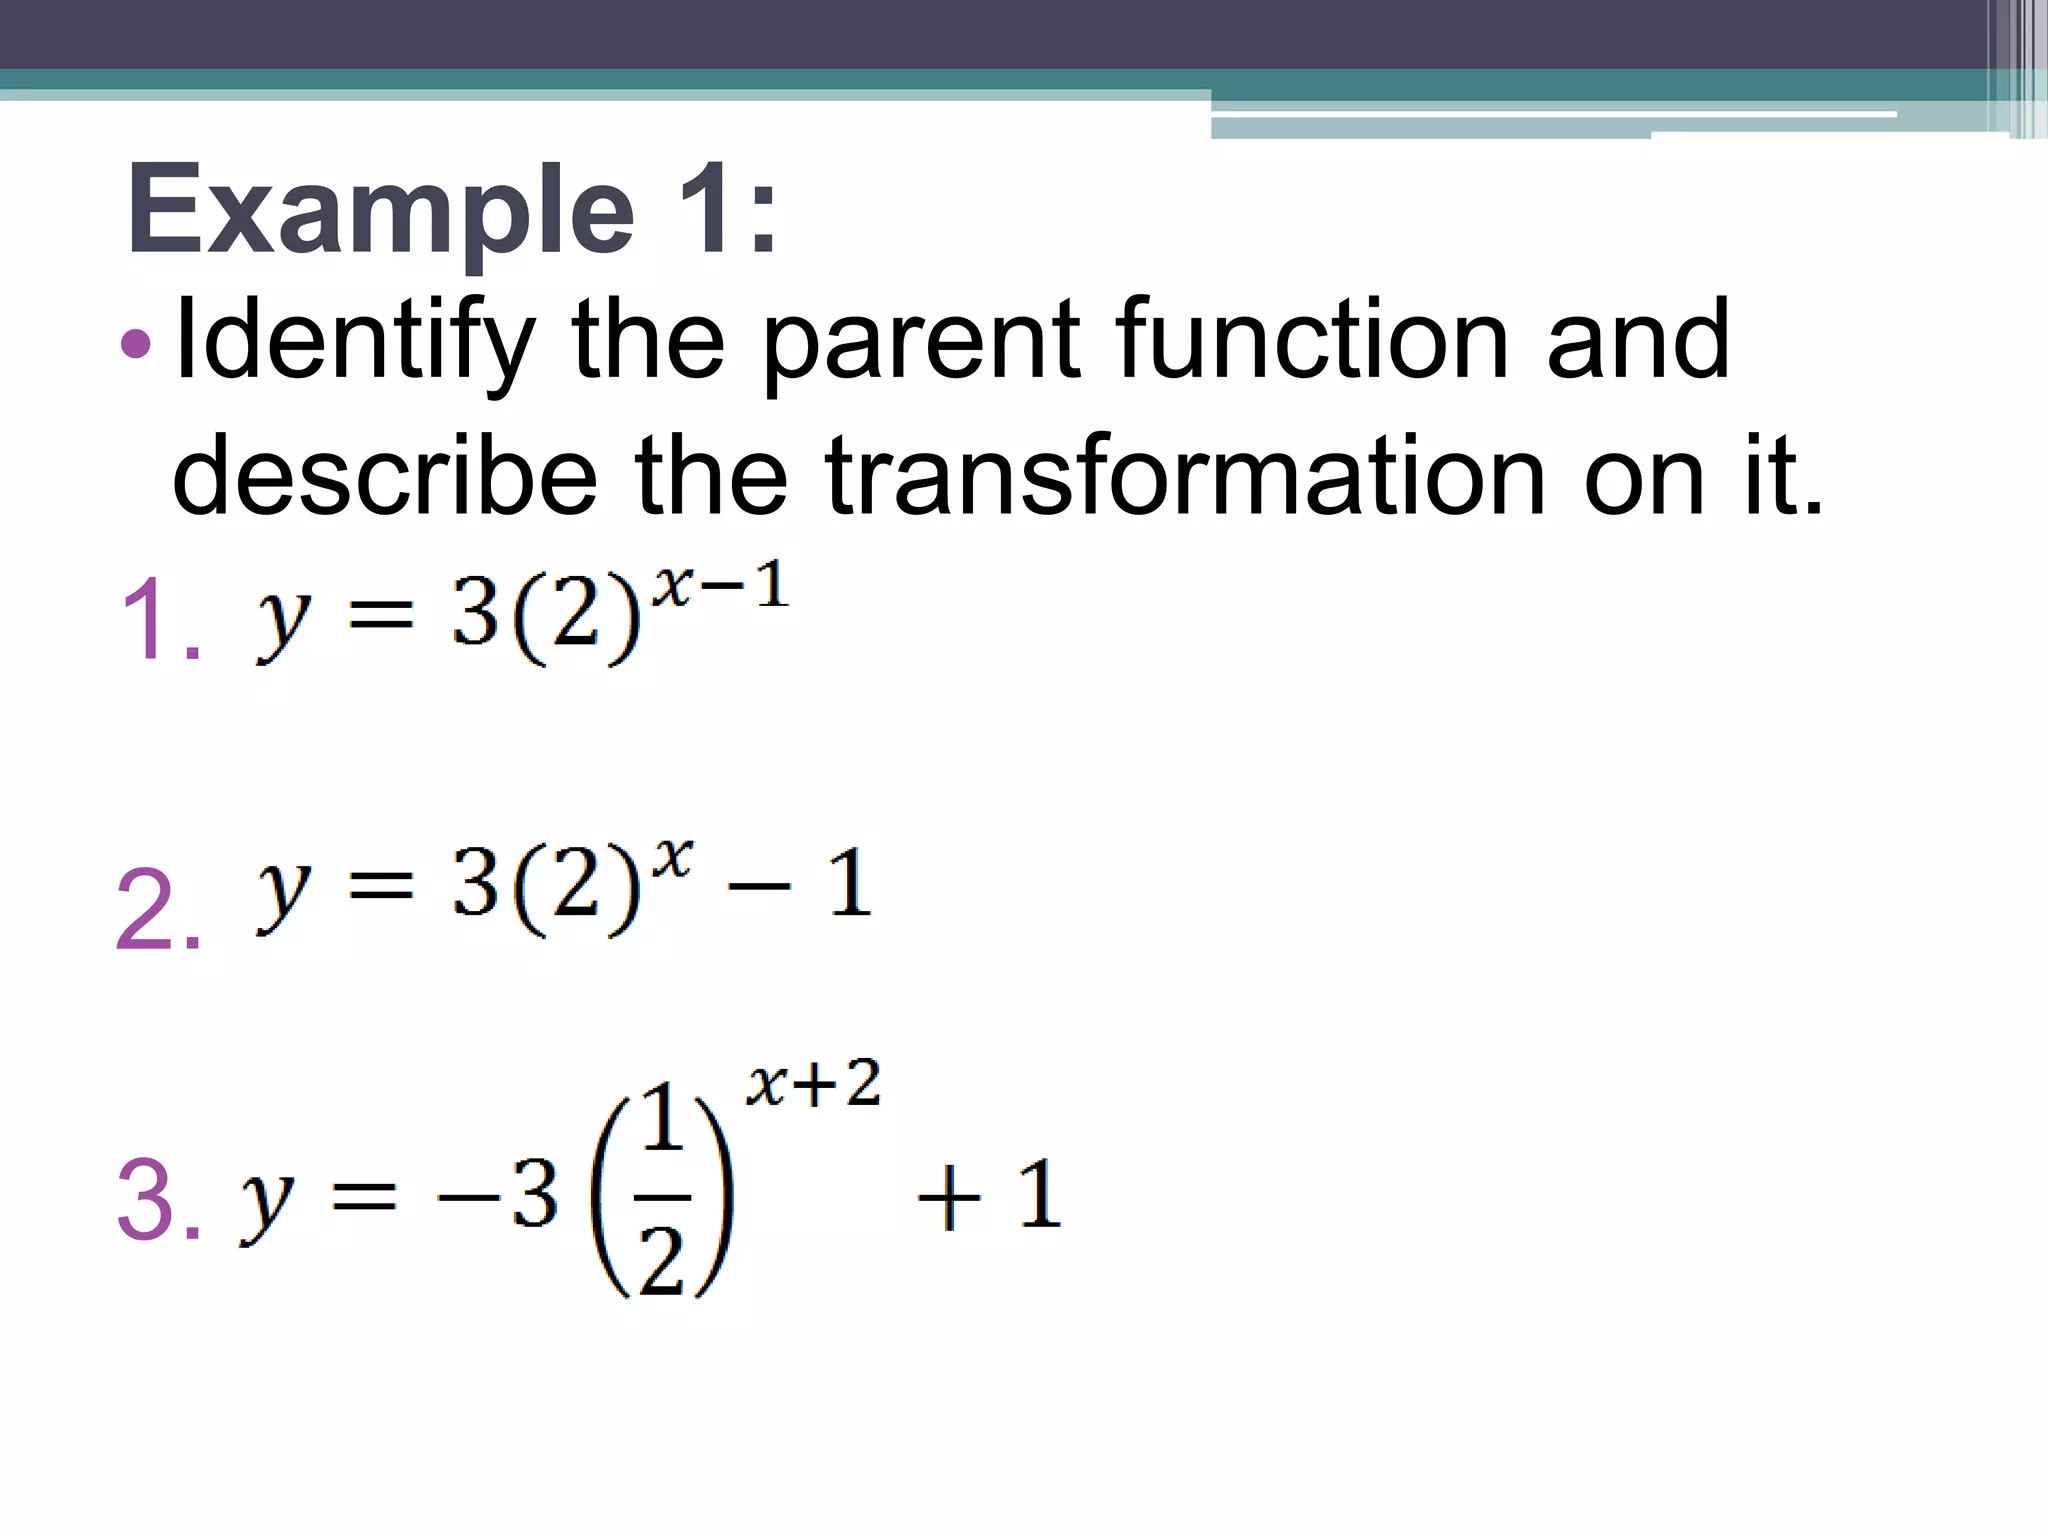
Example 1:
•Identify the parent function and
describe the transformation on it.
1.
2.
3.
18.
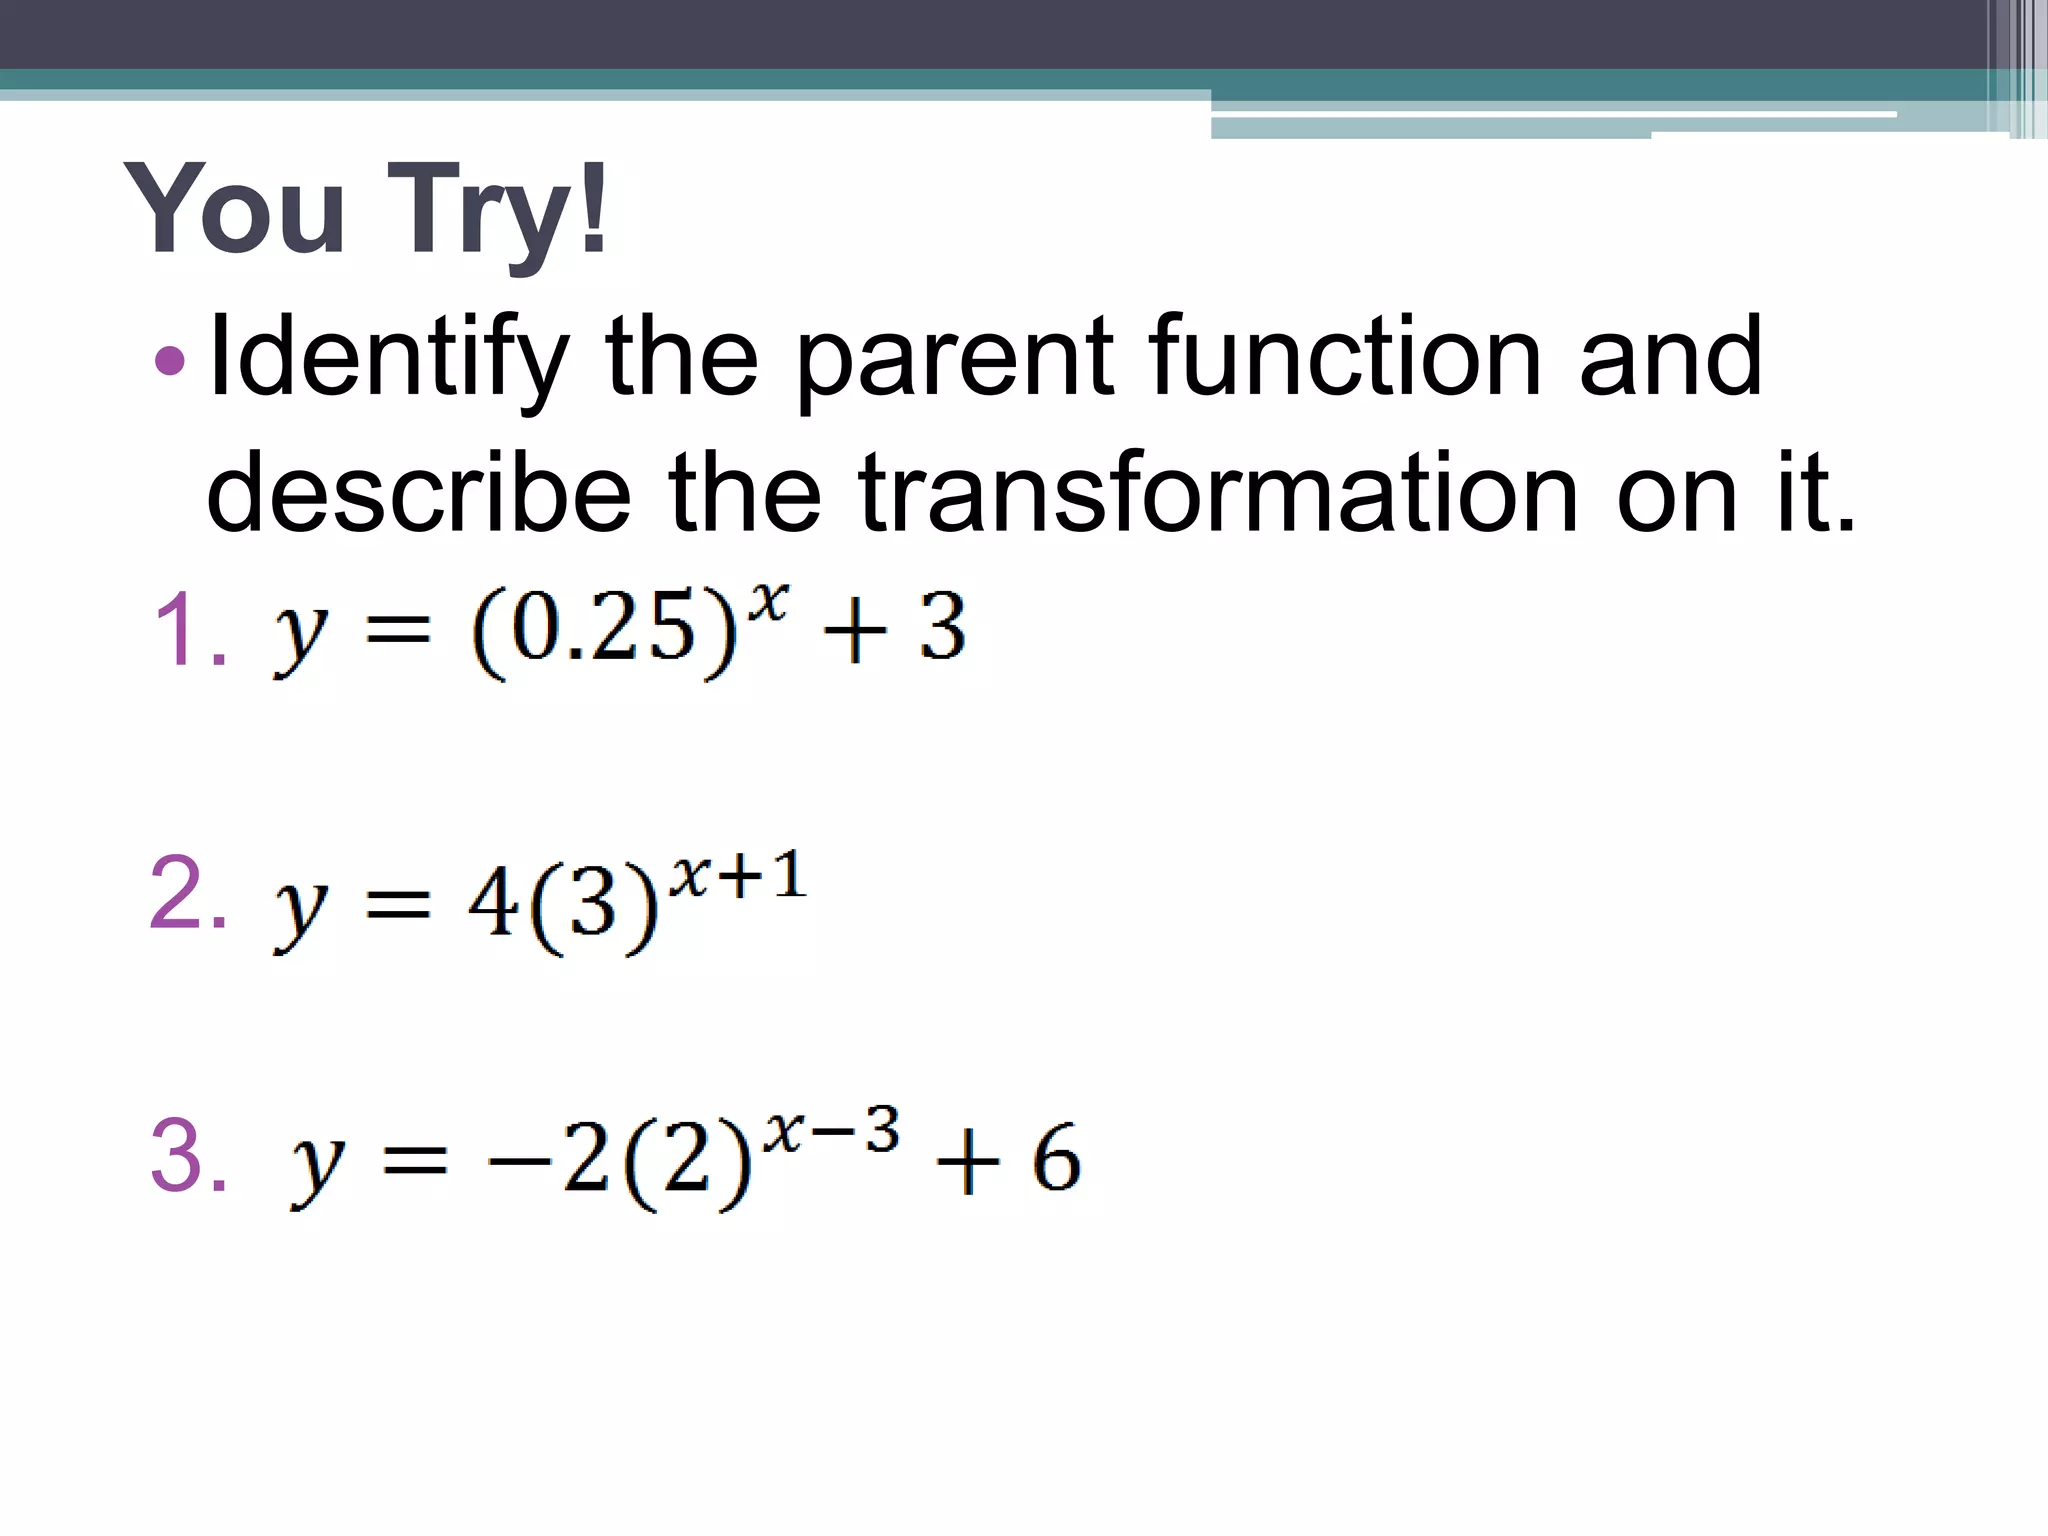
You Try!
•Identify the parent function and
describe the transformation on it.
1.
2.
3.
19.
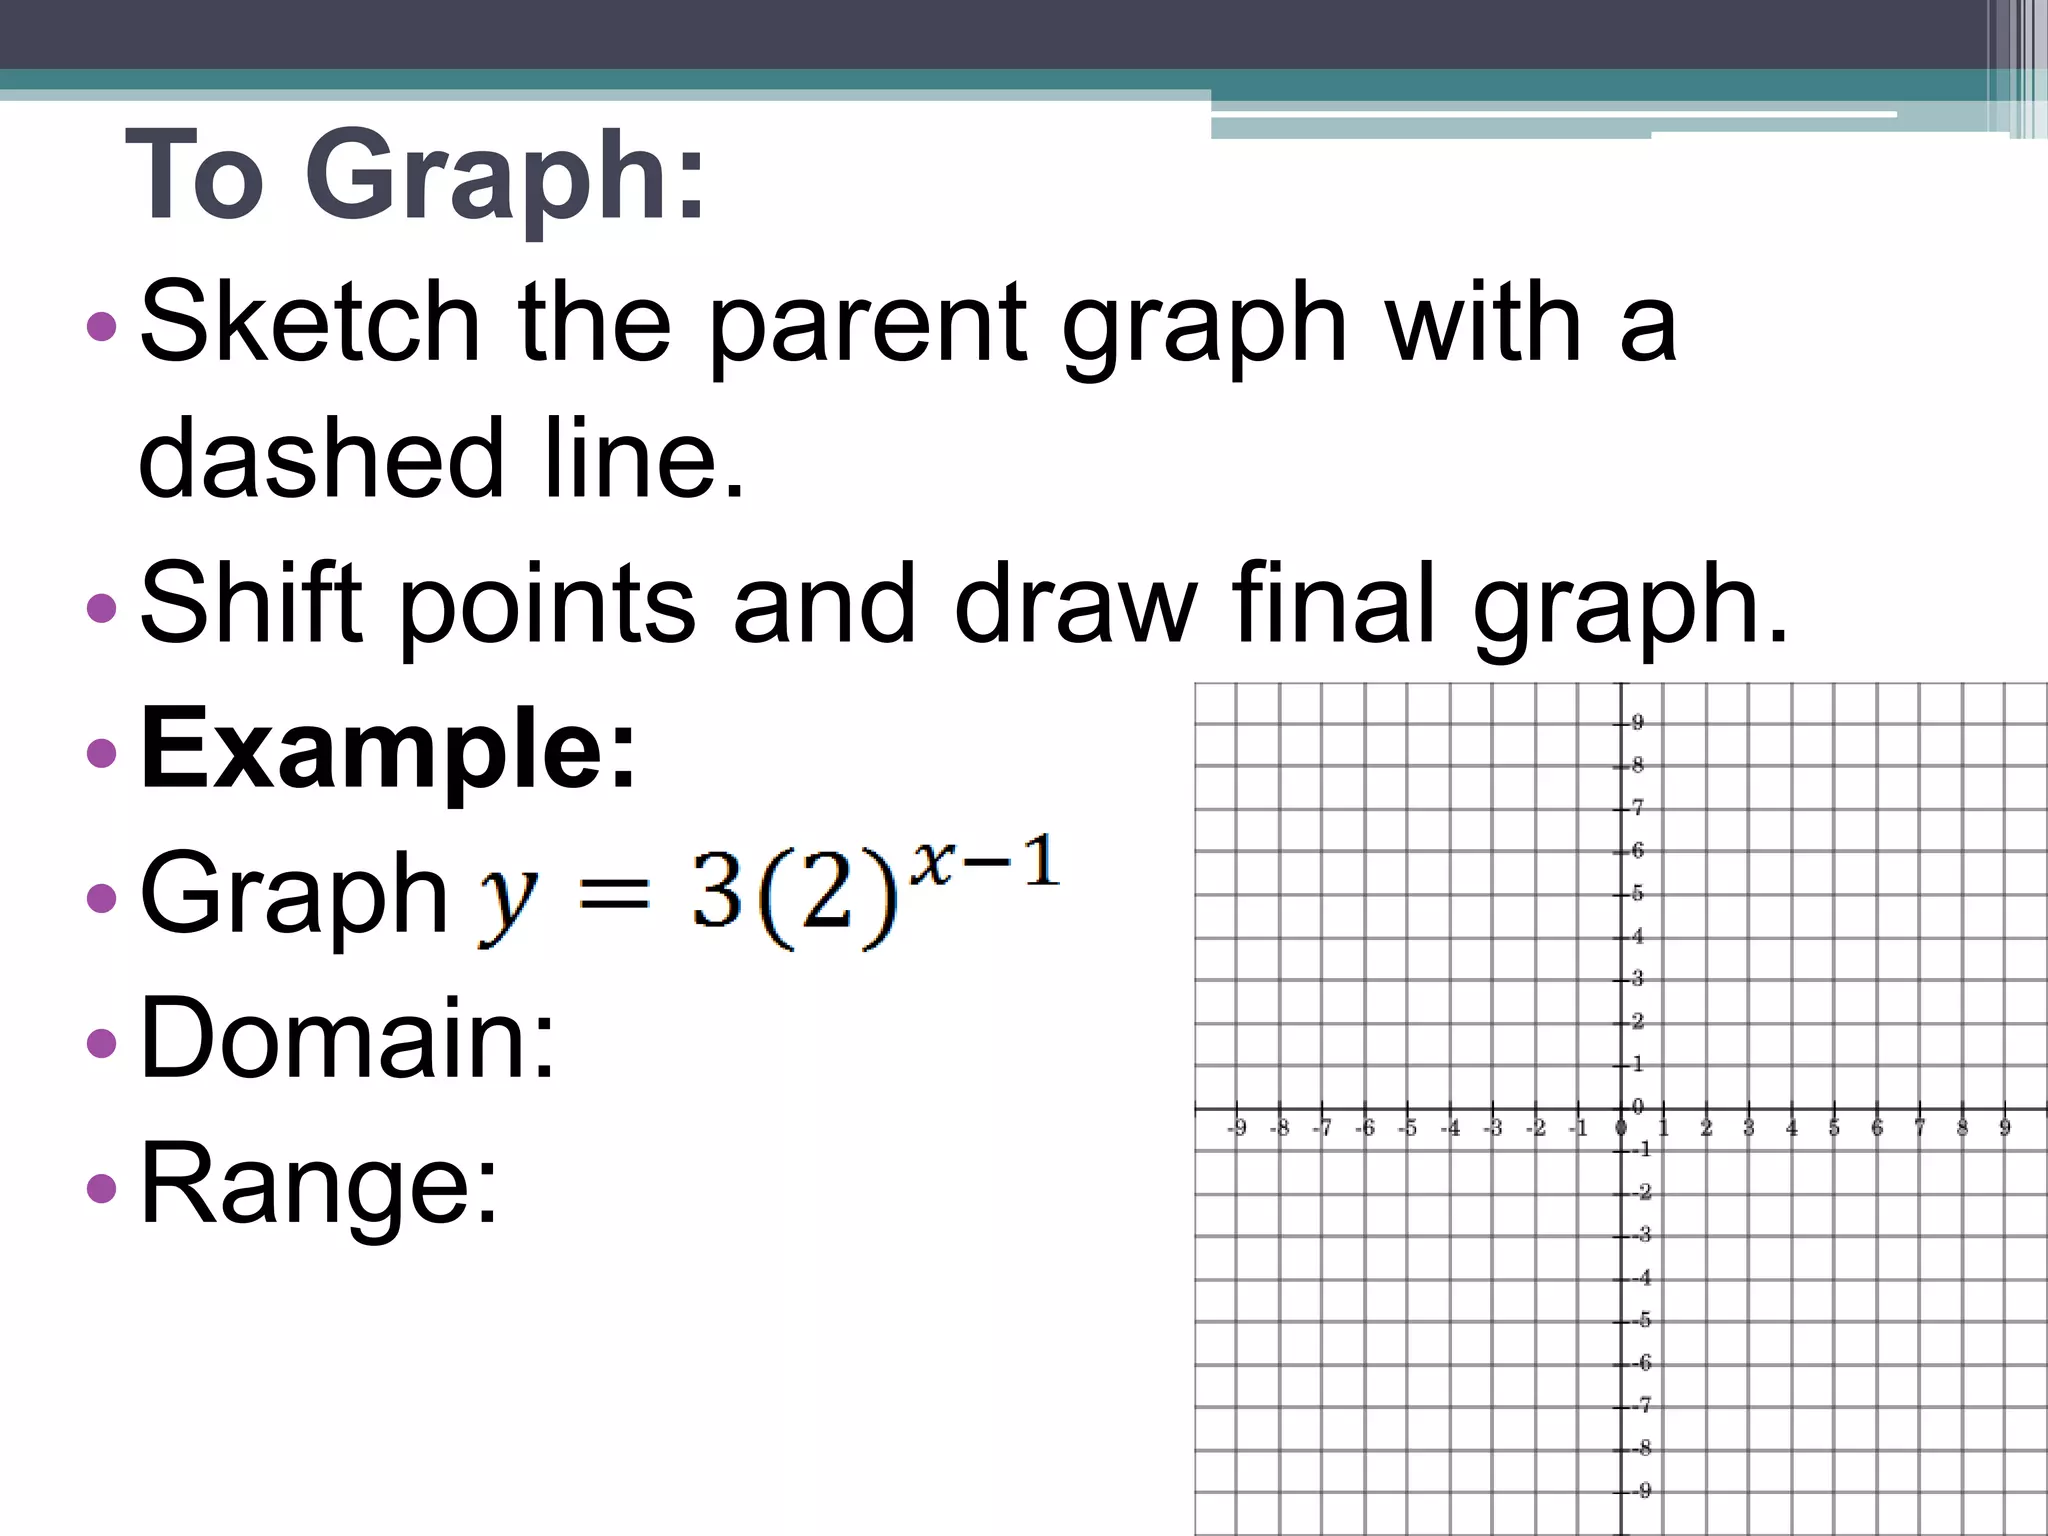
To Graph:
•Sketchthe parent graph with a
dashed line.
• Shift points and draw final graph.
•Example:
•Graph
•Domain:
•Range: