Download to read offline
![Reference List
1. Barek, N. (2013). Topic 1: Section 1.1 –Graphs of linear equations. Available from Slideshare at
https://www.slideshare.net/nahomyitbarek/topic1-16365779?qid=bf814970-084d-4a05-
a611-e98f6bd2dfad&v=&b=&from_search=10 [accessed on 21 August 2022].
2. Estelav, (2013). Linear Functions. Available from Slideshare at
https://www.slideshare.net/estelav/linear-functions-20097351?qid=9219ab42-b21c-4238-
bd52-b3ec7a683dc6&v=&b=&from_search=4 [Accessed on 21 August 2022].
3. Geraldine, M. (2021). Graph of linear function. Available from Slideshare at
https://www.slideshare.net/MartinGeraldine/graph-of-linear-function [Accessed on 20 August
2022].
4. MacLane, S., (2012). Mathematics form and function. Springer Science & Business Media.
5. Mushipe, M. and Ogbonnaya, U. I., (2019). Geogebra and Grade 9 learners’ achievement in linear
functions.
6. Racso, E. (2014). AS LEVEL Function (CIE) EXPLAINED WITH EXAMPLE AND DIAGRAMS.
Available from Slideshare at https://www.slideshare.net/RACSOstudentHELP/function-
edited?qid=20b4981c-afc2-4e55-a270-340a9f5c616f&v=&b=&from_search=10 [accessed on 20
August 2022].
7. Teacher Andoo, (2012). Linear functions 1. Available from Slideshare at
https://www.slideshare.net/teacherandoo/linear-functions-1?qid=7eb23bb1-4f42-42cf-ab16-
abe868bbf7af&v=&b=&from_search=2 [Accessed on 21 August 2022].
8. Volunteers, Siyavula Grade 10 Mathematics. Department of Basic Education. South Africa.](https://image.slidesharecdn.com/nkadimengmt219015363linearfunctionsslidesharere-purposedslidesppt-220821153454-e680b5a4/85/LINEAR-FUNCTIONS-12-320.jpg)

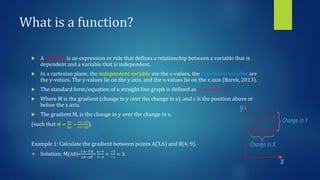
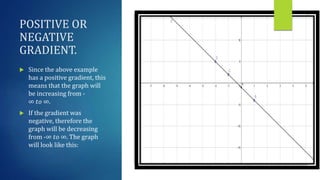
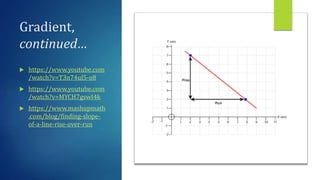
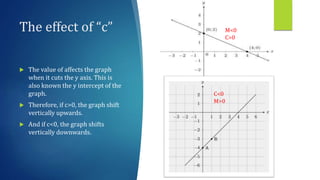
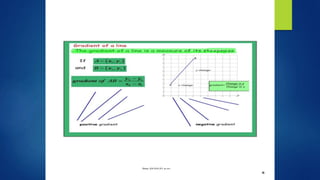
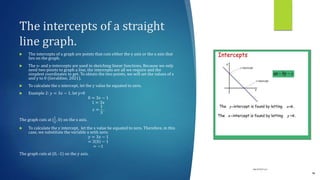
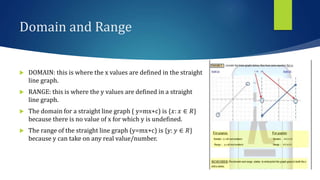
This document discusses linear functions and straight line graphs. It defines key concepts such as the standard form of a linear equation (y=mx+c), where m is the gradient and c is the y-intercept. It explains how to calculate the gradient between two points and interprets positive and negative gradients. The document also covers finding the x-intercept and y-intercept of a line, and defines the domain and range of linear functions.