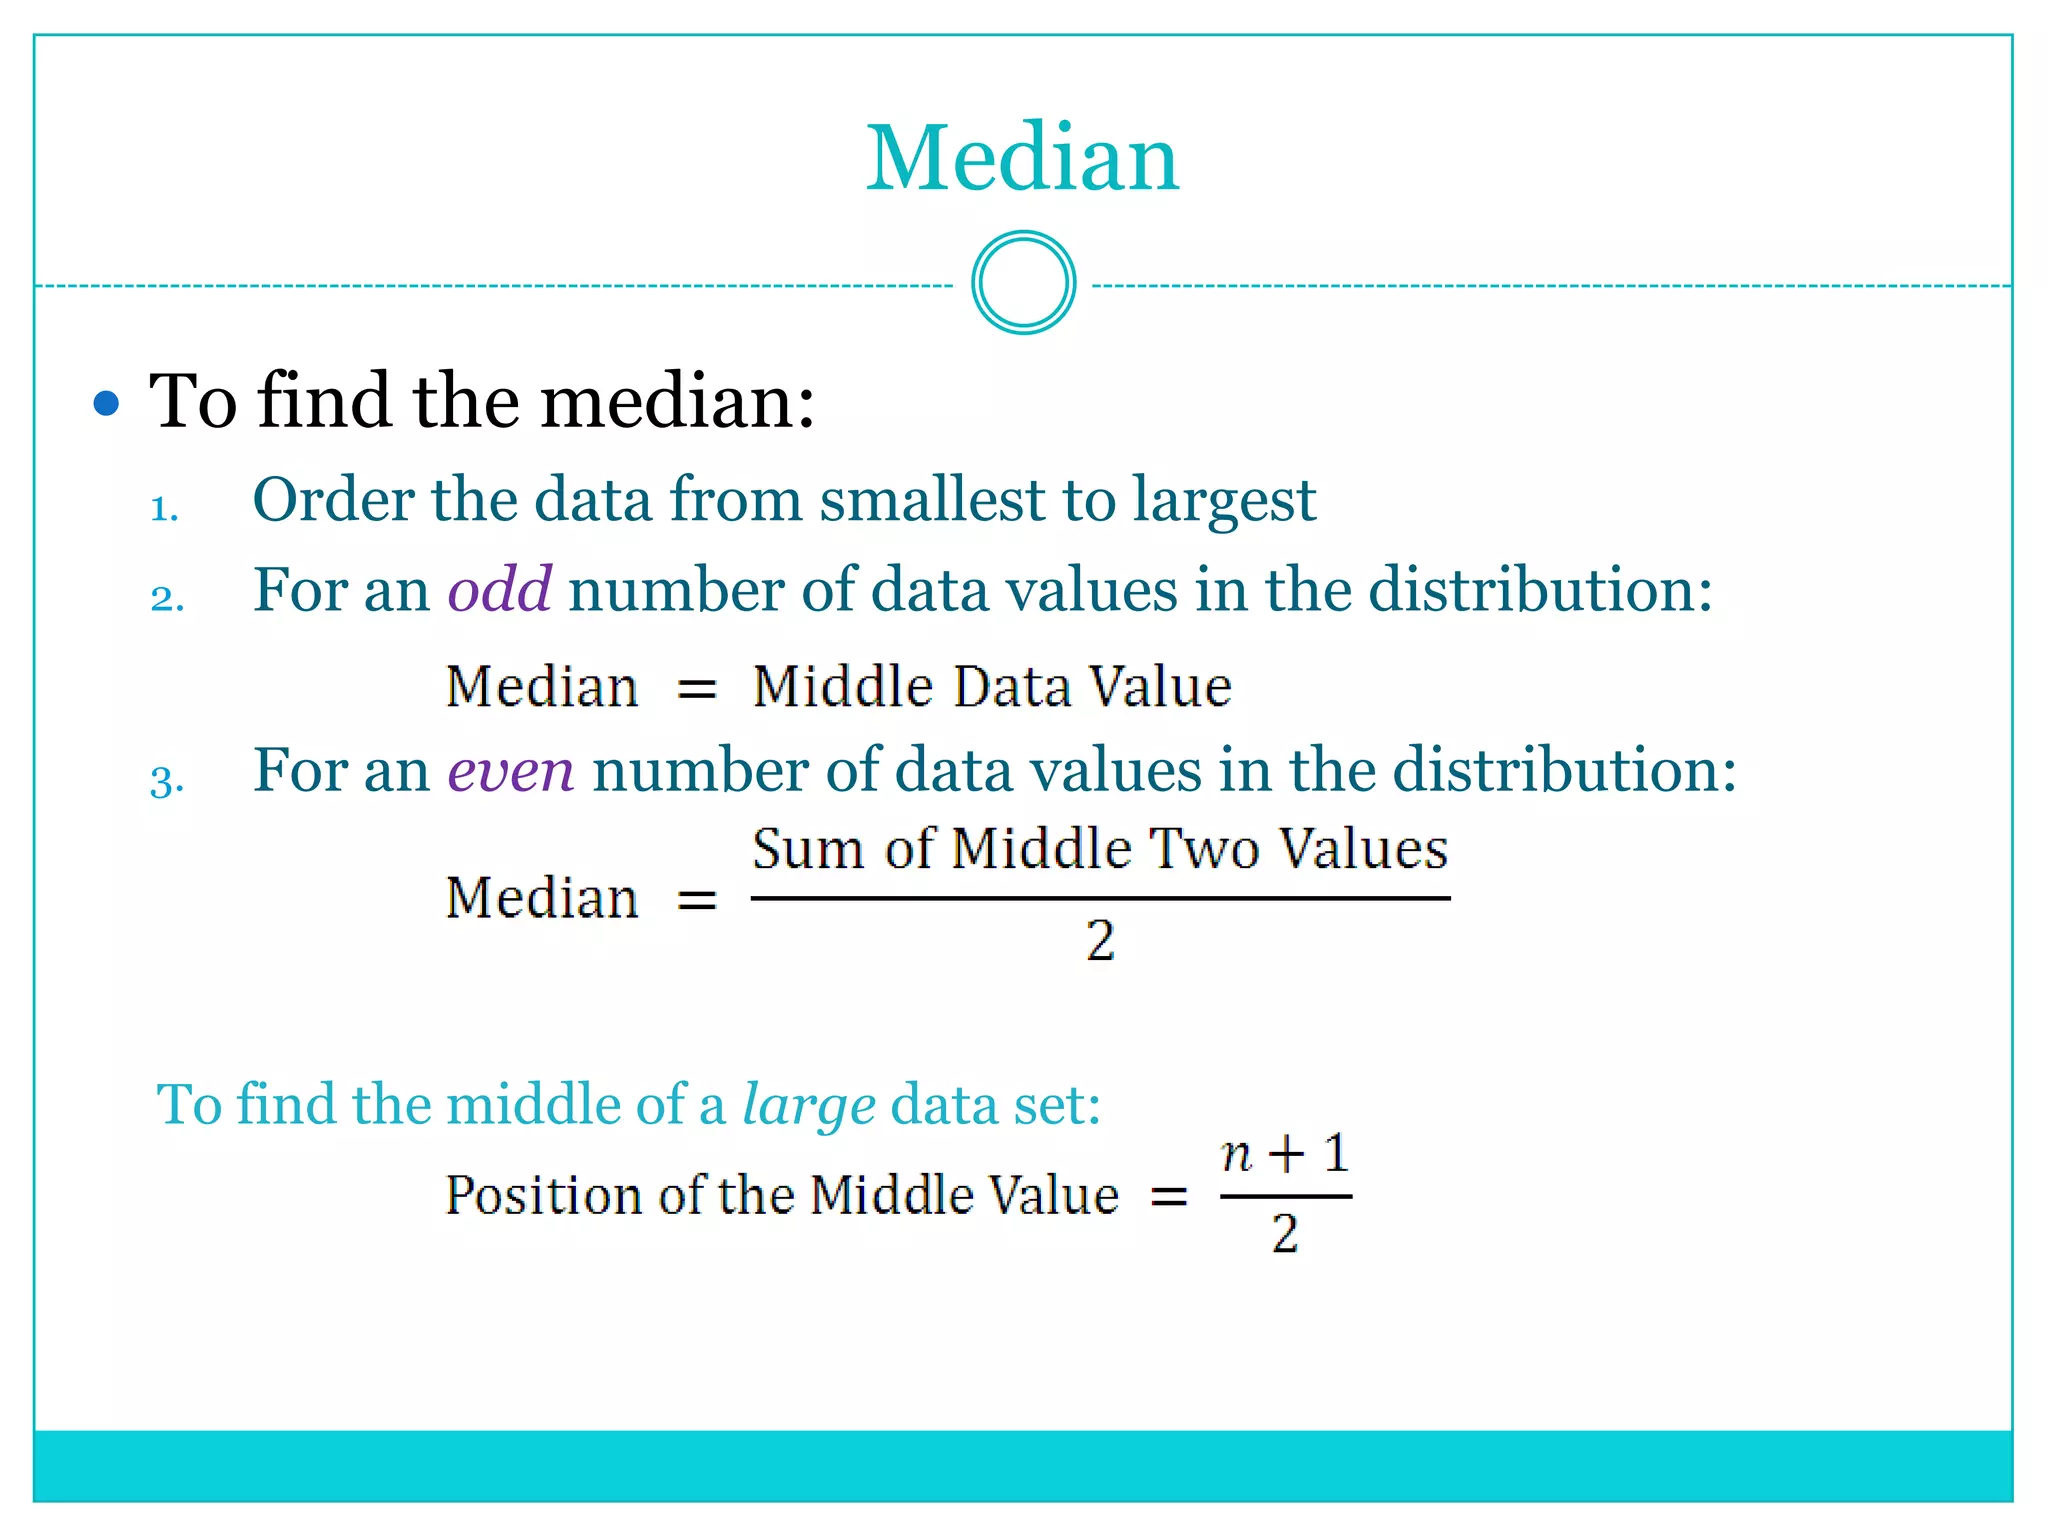
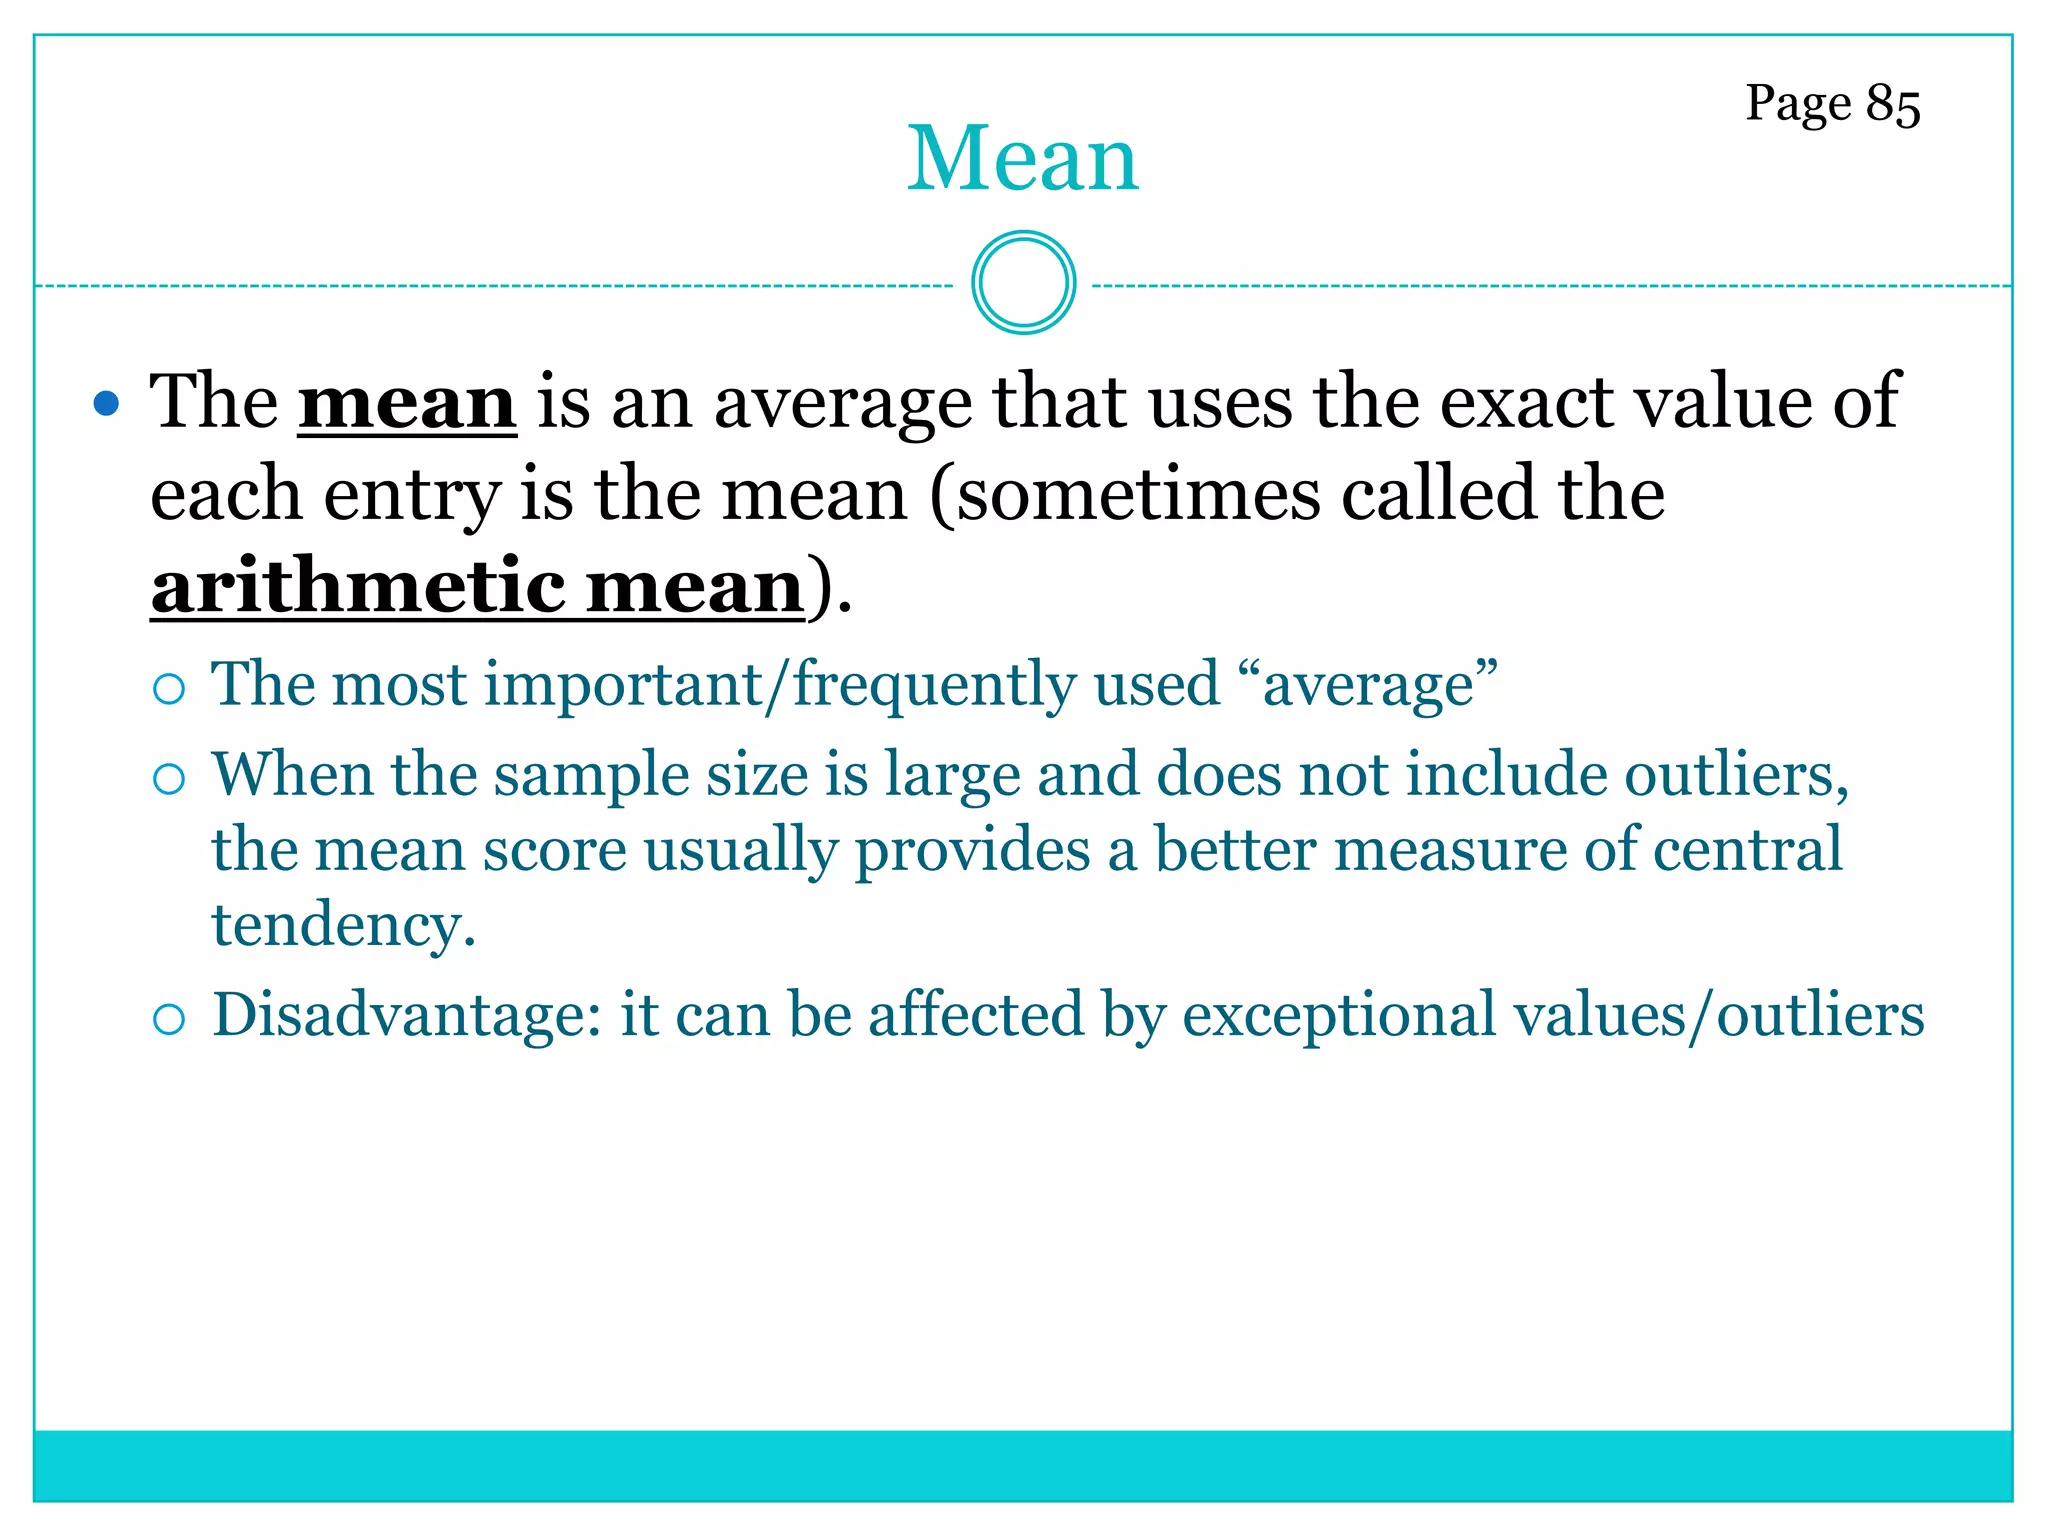
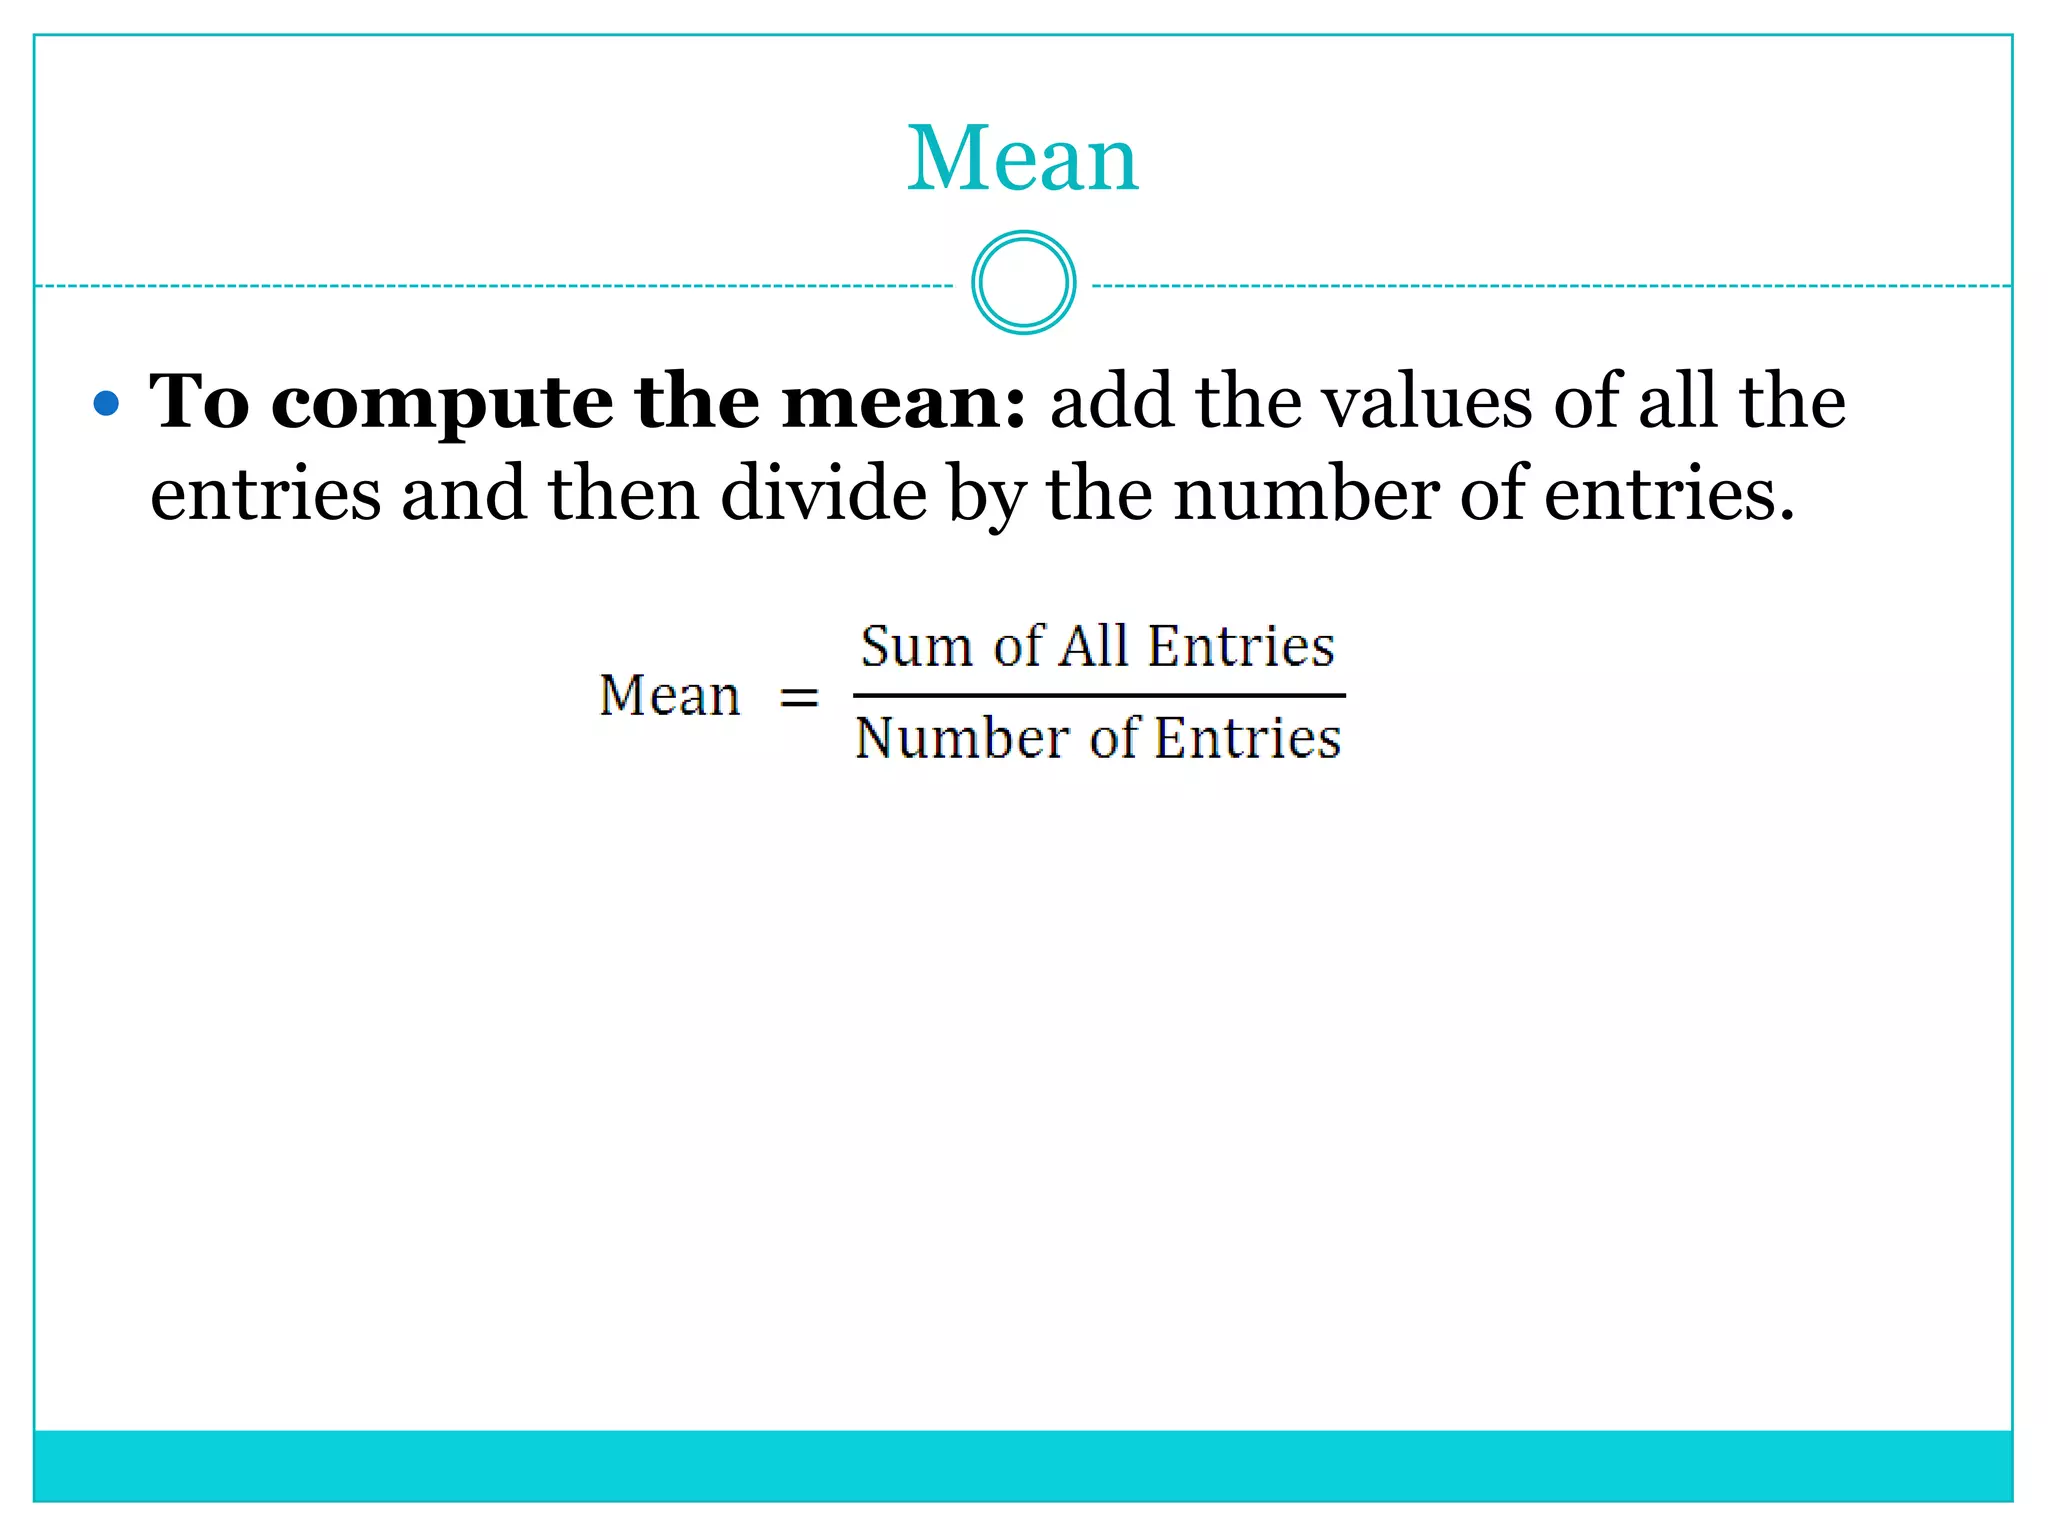
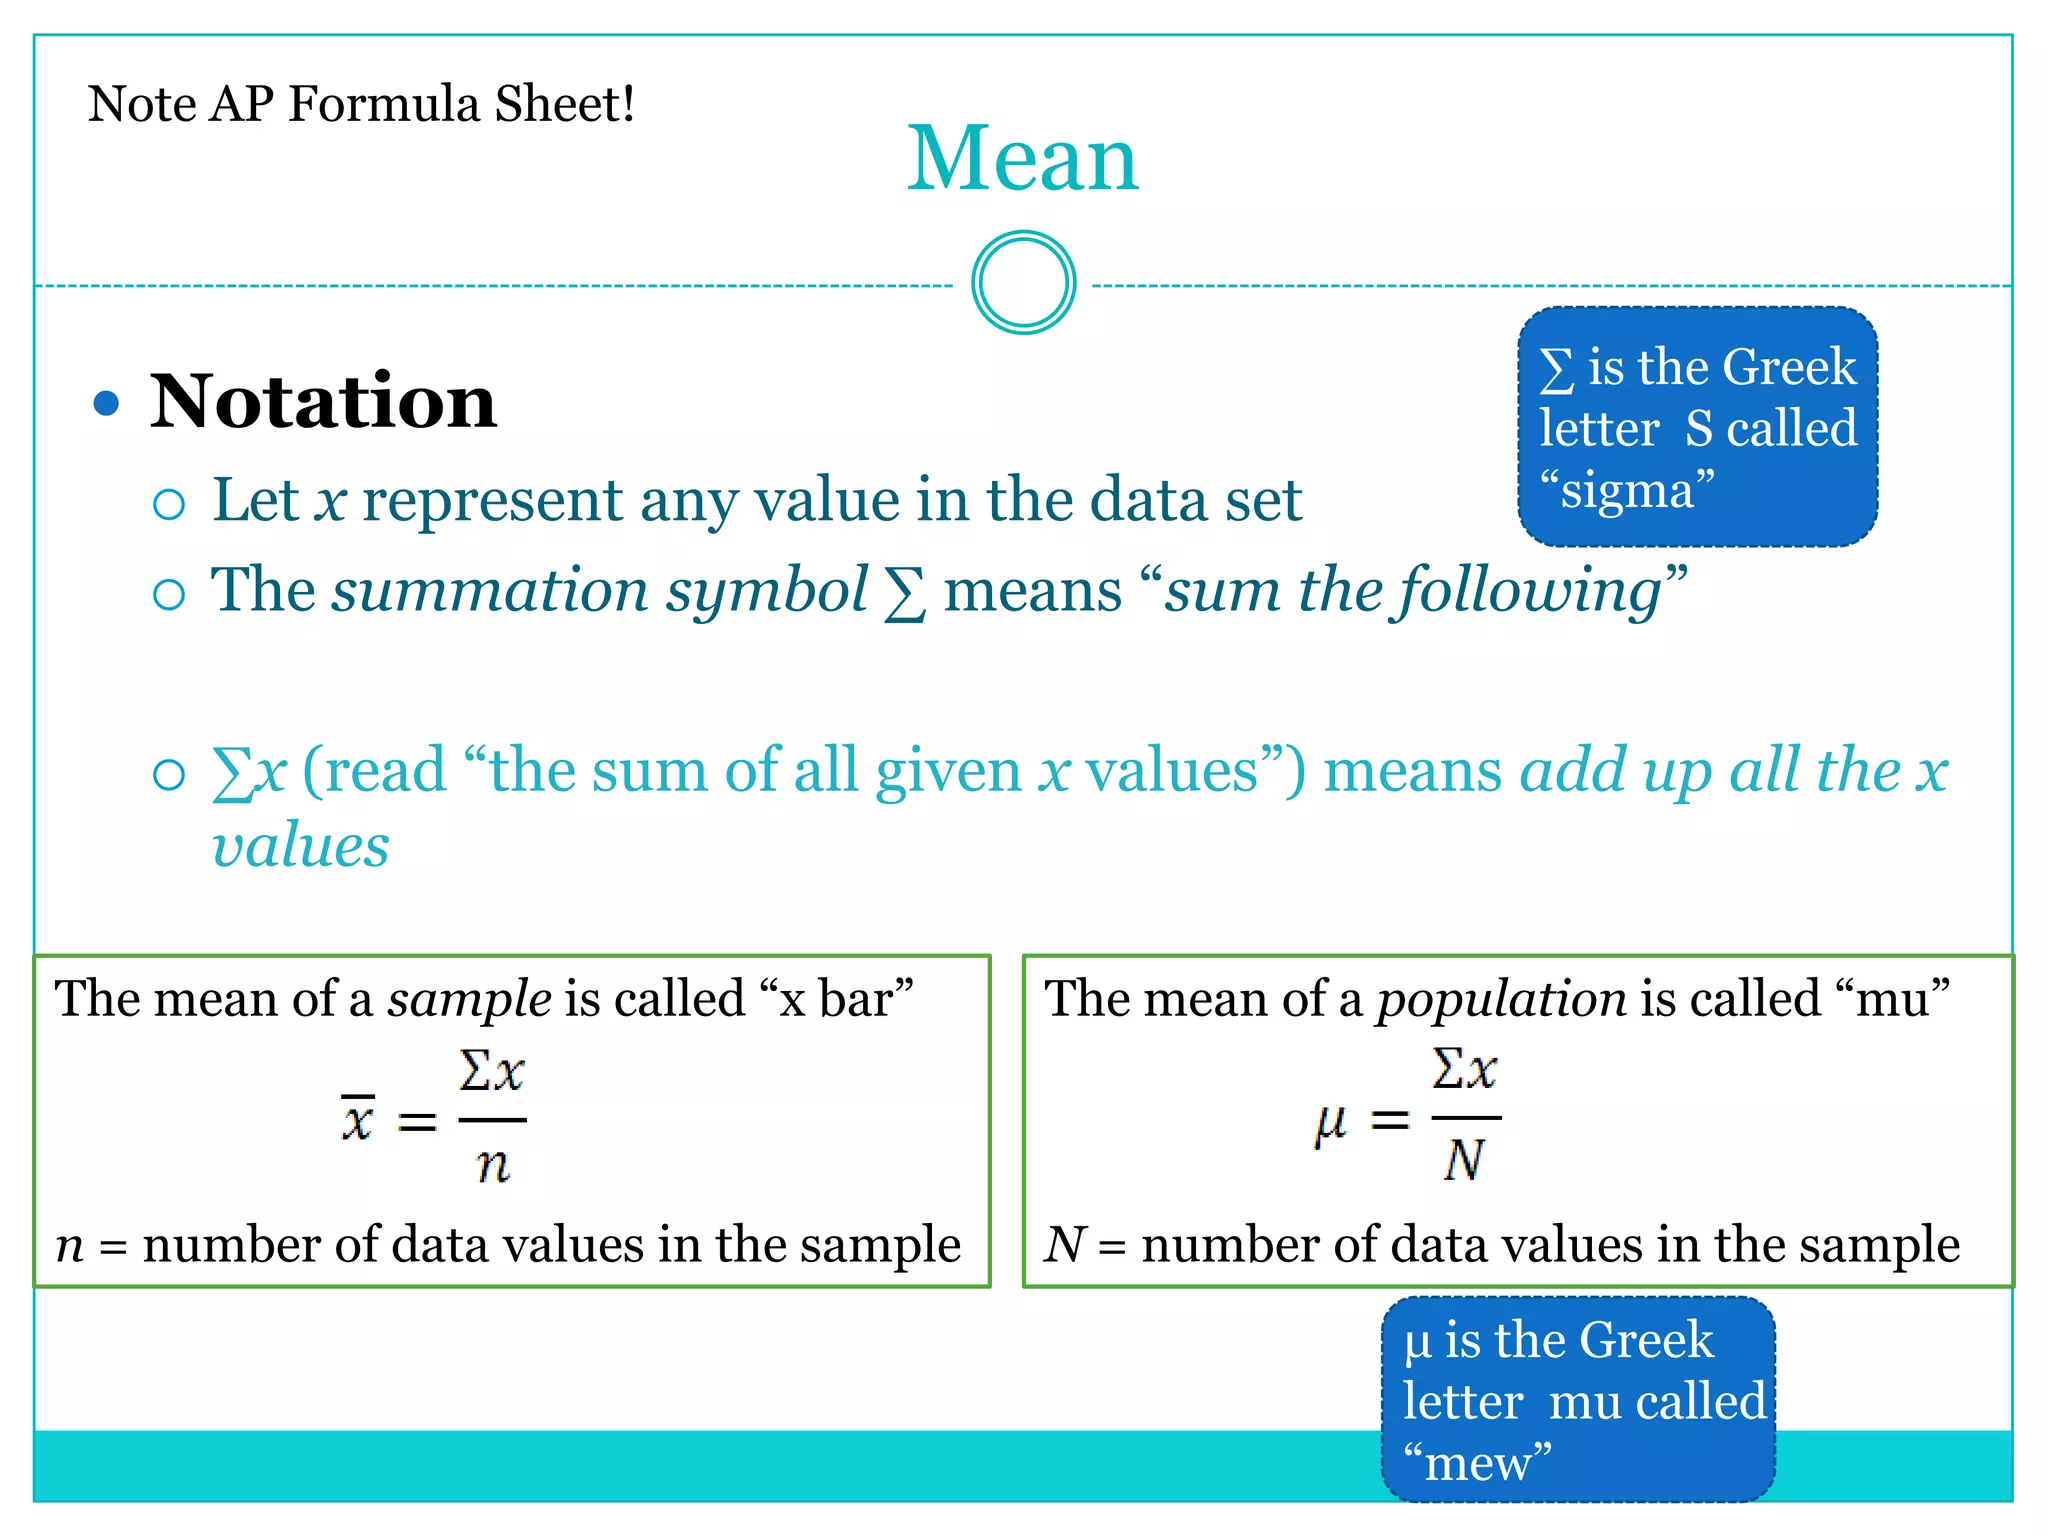
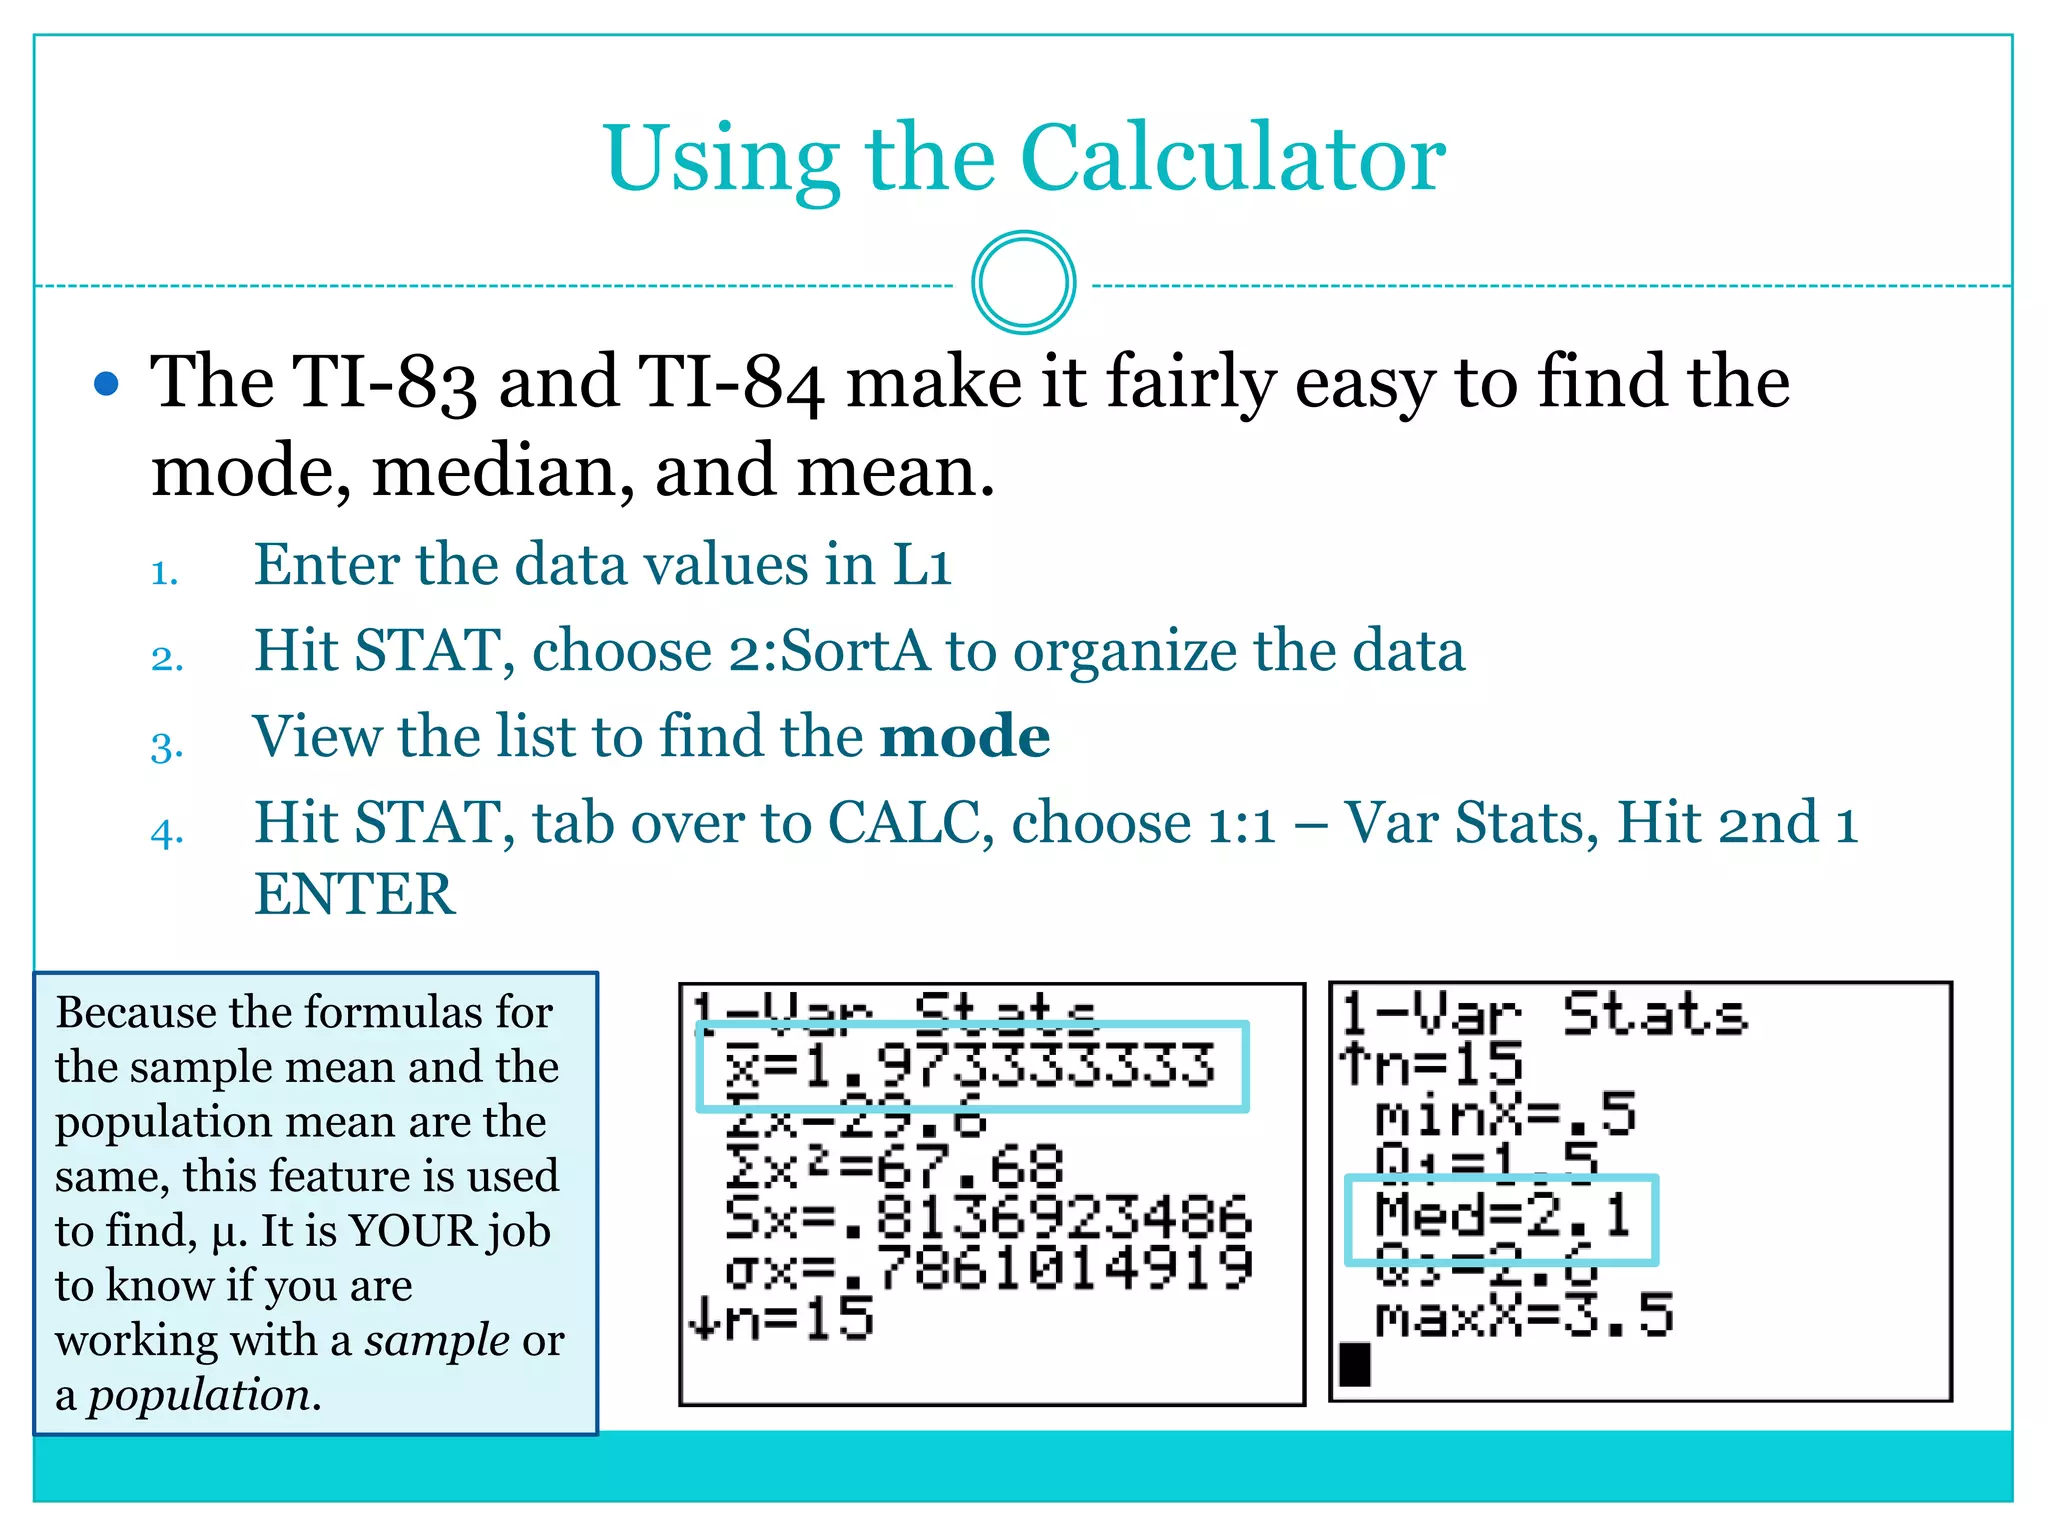
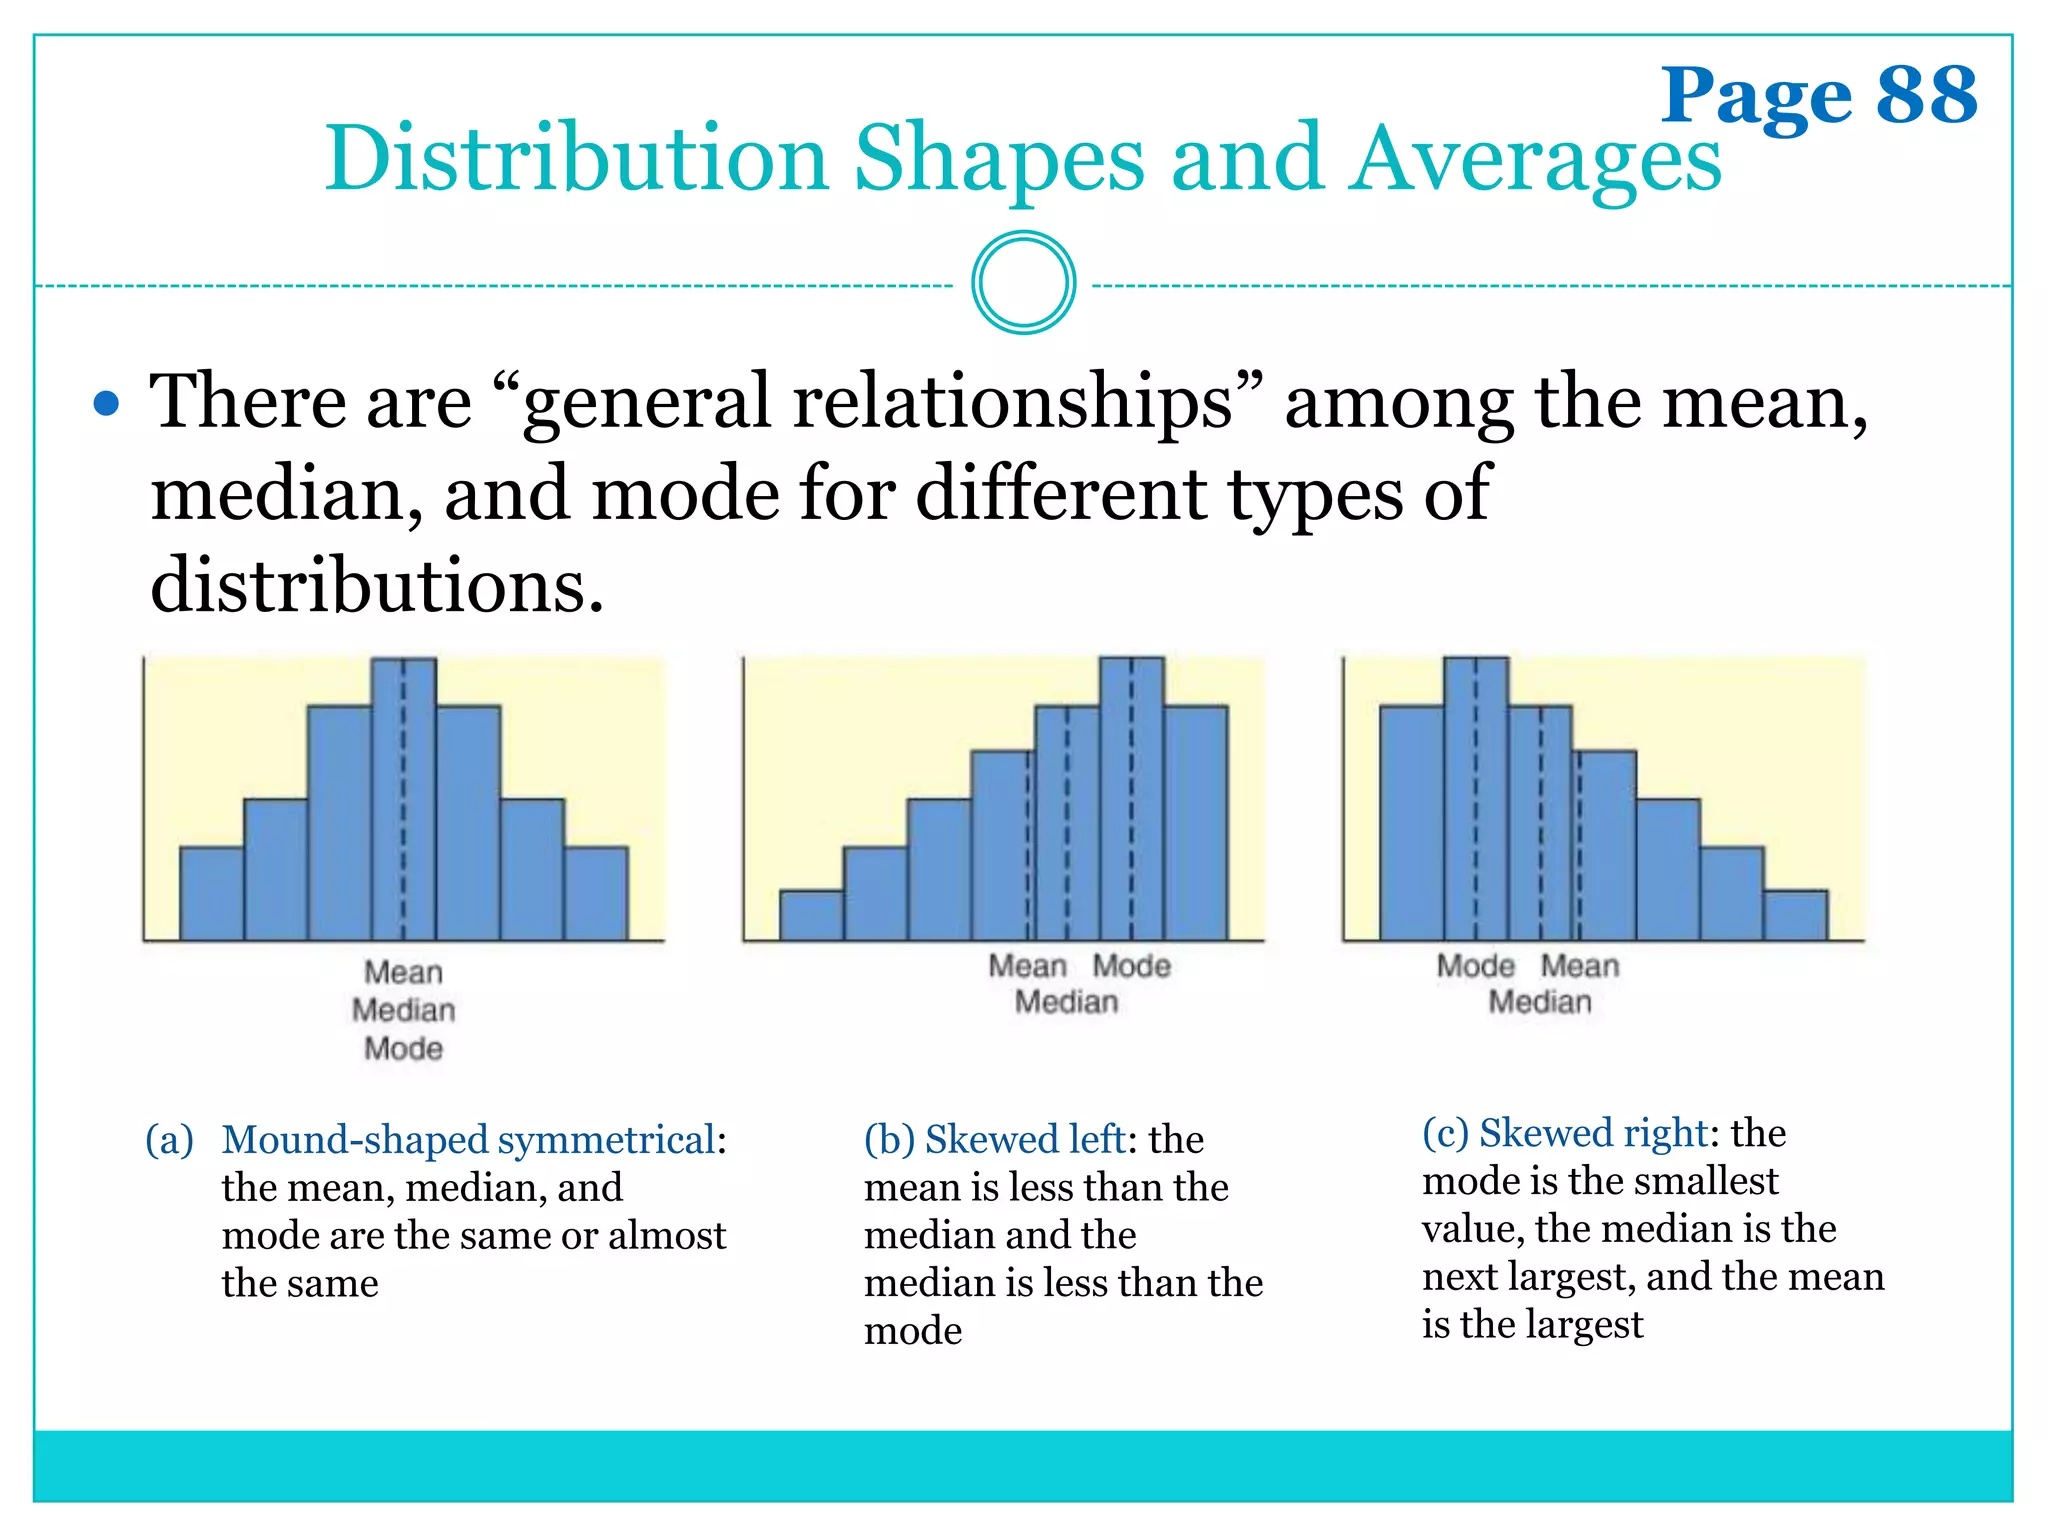
SlideShare a Scribd company logo
3.1 Measures of Central Tendency:
    Mode, Median, and Mean

             CHAPTER 3
       AVERAGES AND VARIATION
Page 82
                            Averages

 An average is a single number used to describe an
 entire sample or an entire population.
    There are many ways to compute averages, but we will study
     only three of the major ones.
        Mode, Median, and Mean
Page 82
                             Mode

 The mode of a data set is the value that occurs most
 frequently.
    The easiest average to compute
    For larger data sets, it is useful to order—or sort—the data
     before scanning them for the mode.
    Not every data set has a mode
    The mode is not very stable. Changing just one number in a
     data set can change the mode dramatically.
    The mode is a useful average when we want to know the most
     frequently occurring data value
Page 83
                             Median

 The median is the central value of an ordered
 distribution.
    The median uses the position rather than the specific value of
     each data entry.
    If the extreme values of a data set change, the median usually
     does not change.
    Advantage: if a data set contains an outlier, the median may be
     a better indicator of the center
    Disadvantage: not sensitive to the specific size of a data value
Median

 To find the median:
  1. Order the data from smallest to largest
  2. For an odd number of data values in the distribution:

  3.   For an even number of data values in the distribution:


  To find the middle of a large data set:
Page 85
                              Mean

 The mean is an average that uses the exact value of
 each entry is the mean (sometimes called the
 arithmetic mean).
    The most important/frequently used ―average‖
    When the sample size is large and does not include outliers,
     the mean score usually provides a better measure of central
     tendency.
    Disadvantage: it can be affected by exceptional values/outliers
Mean

 To compute the mean: add the values of all the
 entries and then divide by the number of entries.
Note AP Formula Sheet!
                                     Mean

                                                               ∑ is the Greek
  Notation                                                    letter S called
    Let x represent any value in the data set                 ―sigma‖

    The summation symbol ∑ means ―sum the following‖


       ∑x (read ―the sum of all given x values‖) means add up all the x
        values

The mean of a sample is called ―x bar‖    The mean of a population is called ―mu‖


n = number of data values in the sample   N = number of data values in the sample
                                                         μ is the Greek
                                                         letter mu called
                                                         ―mew‖
Using the Calculator

  The TI-83 and TI-84 make it fairly easy to find the
    mode, median, and mean.
    1.    Enter the data values in L1
    2.    Hit STAT, choose 2:SortA to organize the data
    3.    View the list to find the mode
    4.    Hit STAT, tab over to CALC, choose 1:1 – Var Stats, Hit 2nd 1
          ENTER
Because the formulas for
the sample mean and the
population mean are the
same, this feature is used
to find, μ. It is YOUR job
to know if you are
working with a sample or
a population.
Mean and Median

 The mean and median of two key measures of center.
    Important for comparing data sets
        State what the values are AND what they tell us about each set or one
         set compared to the other
    Important for describing data sets
        Gives a ―typical‖ number to consider when looking at any data sets


 For Example:
    Consider two data sets A and B where they are both roughly normal
     (bell-shaped) and have about the same spread. The mean of A is 6
     and the mean of B is 4.
        You might say: ―Set A is centered at 6, where set B is centered at 4.
         Since the mean of set B is lower than set A, set B would have lower
         overall values, on average than set A‖
Page 86
                     Resistant Measures

 A resistant measure is one that is not influenced
 by extremely high or low data values.
    The mean is not a resistant measure of center because
     changing the size of only one data value will affect the mean
     and it is affected by outliers.
        The mean is an example of a non-resistant measure.
    The median is more resistant to changes in individual data
     values and outliers.
Page 87
                Data Types and Averages

 Levels of Measurement: nominal, ordinal, interval,
  and ratio
     The mode (if it exists) can be used with all four levels
     The median can be used with data at the ordinal level of above.
     The mean can be used with data at the interval or ratio level
      (there are some exceptions at the ordinal level).
 Be careful with taking the average of averages!
   We need to know the sample size used to find each individual
    average
Page 88
          Distribution Shapes and Averages

 There are ―general relationships‖ among the mean,
 median, and mode for different types of
 distributions.


 (a) Mound-shaped symmetrical:     (b) Skewed left: the      (c) Skewed right: the
     the mean, median, and         mean is less than the     mode is the smallest
     mode are the same or almost   median and the            value, the median is the
     the same                      median is less than the   next largest, and the mean
                                   mode                      is the largest
Homework

 Page 89
   #1, 2, 3, 6, 7, 8, 14

   #17 Parts a, b, & c only

   #18

More Related Content

What's hot

Measures of dispersion
Measures of dispersionMeasures of dispersion
Measures of dispersionDrZahid Khan
 
Measures of dispersions
Measures of dispersionsMeasures of dispersions
Measures of dispersions
Inamul Hossain Imran
 
Statistics-Measures of dispersions
Statistics-Measures of dispersionsStatistics-Measures of dispersions
Statistics-Measures of dispersionsCapricorn
 
Measures of dispersion
Measures of dispersionMeasures of dispersion
Measures of dispersion
Nilanjan Bhaumik
 
MEASURES OF CENTRAL TENDENCY AND MEASURES OF DISPERSION
MEASURES OF CENTRAL TENDENCY AND  MEASURES OF DISPERSION MEASURES OF CENTRAL TENDENCY AND  MEASURES OF DISPERSION
MEASURES OF CENTRAL TENDENCY AND MEASURES OF DISPERSION Tanya Singla
 
Dr digs central tendency
Dr digs central tendencyDr digs central tendency
Dr digs central tendencydrdig
 
Normal Distribution – Introduction and Properties
Normal Distribution – Introduction and PropertiesNormal Distribution – Introduction and Properties
Normal Distribution – Introduction and Properties
Sundar B N
 
Central tendency
Central tendencyCentral tendency
Central tendency
Andi Koentary
 
Measures of central tendency
Measures of central tendencyMeasures of central tendency
Measures of central tendency
Chie Pegollo
 
Measures of central tendency
Measures of central tendencyMeasures of central tendency
Measures of central tendency
Diksha Verma
 
Introduction to statistics
Introduction to statisticsIntroduction to statistics
Introduction to statisticsakbhanj
 
Measures of Variation or Dispersion
Measures of Variation or Dispersion Measures of Variation or Dispersion
Measures of Variation or Dispersion
Dr Athar Khan
 
Descriptive statistics
Descriptive statisticsDescriptive statistics
Descriptive statistics
Mmedsc Hahm
 
Measure of Central Tendency
Measure of Central Tendency Measure of Central Tendency
Measure of Central Tendency
Umme Habiba
 
Statistics...
Statistics...Statistics...
Measures of Central Tendency
Measures of Central TendencyMeasures of Central Tendency
Measures of Central Tendency
Rejvi Ahmed
 
Skewness & Kurtosis
Skewness & KurtosisSkewness & Kurtosis
Skewness & KurtosisNavin Bafna
 
General Linear Model | Statistics
General Linear Model | StatisticsGeneral Linear Model | Statistics
General Linear Model | Statistics
Transweb Global Inc
 

What's hot (20)

Measures of dispersion
Measures of dispersionMeasures of dispersion
Measures of dispersion
 
Measures of dispersions
Measures of dispersionsMeasures of dispersions
Measures of dispersions
 
Statistics-Measures of dispersions
Statistics-Measures of dispersionsStatistics-Measures of dispersions
Statistics-Measures of dispersions
 
Measures of dispersion
Measures of dispersionMeasures of dispersion
Measures of dispersion
 
MEASURES OF CENTRAL TENDENCY AND MEASURES OF DISPERSION
MEASURES OF CENTRAL TENDENCY AND  MEASURES OF DISPERSION MEASURES OF CENTRAL TENDENCY AND  MEASURES OF DISPERSION
MEASURES OF CENTRAL TENDENCY AND MEASURES OF DISPERSION
 
Measurement of central tendency
Measurement of central tendencyMeasurement of central tendency
Measurement of central tendency
 
Measures of dispersion
Measures  of  dispersionMeasures  of  dispersion
Measures of dispersion
 
Dr digs central tendency
Dr digs central tendencyDr digs central tendency
Dr digs central tendency
 
Normal Distribution – Introduction and Properties
Normal Distribution – Introduction and PropertiesNormal Distribution – Introduction and Properties
Normal Distribution – Introduction and Properties
 
Central tendency
Central tendencyCentral tendency
Central tendency
 
Measures of central tendency
Measures of central tendencyMeasures of central tendency
Measures of central tendency
 
Measures of central tendency
Measures of central tendencyMeasures of central tendency
Measures of central tendency
 
Introduction to statistics
Introduction to statisticsIntroduction to statistics
Introduction to statistics
 
Measures of Variation or Dispersion
Measures of Variation or Dispersion Measures of Variation or Dispersion
Measures of Variation or Dispersion
 
Descriptive statistics
Descriptive statisticsDescriptive statistics
Descriptive statistics
 
Measure of Central Tendency
Measure of Central Tendency Measure of Central Tendency
Measure of Central Tendency
 
Statistics...
Statistics...Statistics...
Statistics...
 
Measures of Central Tendency
Measures of Central TendencyMeasures of Central Tendency
Measures of Central Tendency
 
Skewness & Kurtosis
Skewness & KurtosisSkewness & Kurtosis
Skewness & Kurtosis
 
General Linear Model | Statistics
General Linear Model | StatisticsGeneral Linear Model | Statistics
General Linear Model | Statistics
 

Viewers also liked

Measure of Central Tendency
Measure of Central TendencyMeasure of Central Tendency
Measure of Central Tendency
Mysore University Library
 
Mean, Median, Mode: Measures of Central Tendency
Mean, Median, Mode: Measures of Central Tendency Mean, Median, Mode: Measures of Central Tendency
Mean, Median, Mode: Measures of Central Tendency Jan Nah
 
Applications of mean ,mode & median
Applications of mean ,mode & medianApplications of mean ,mode & median
Applications of mean ,mode & medianAnagha Deshpande
 
3.1-3.2 Measures of Central Tendency
3.1-3.2 Measures of Central Tendency3.1-3.2 Measures of Central Tendency
3.1-3.2 Measures of Central Tendency
mlong24
 
Measures of central tendency
Measures of central tendencyMeasures of central tendency
Measures of central tendency
Alex Chris
 
Measures of central tendency by MHM
Measures of central tendency by MHMMeasures of central tendency by MHM
Measures of central tendency by MHM
Md Mosharof Hosen
 
2 measure of central tendency
2 measure of central  tendency2 measure of central  tendency
2 measure of central tendency
Anas Farooq Maniya AFM
 
Measures of central tendency
Measures of central tendencyMeasures of central tendency
Measures of central tendency
Joydeep Hazarika
 
Stattistic ii - mode, median, mean
Stattistic ii - mode, median, meanStattistic ii - mode, median, mean
Stattistic ii - mode, median, meanamsy1224
 
A. measure of central tendency
A. measure of central tendencyA. measure of central tendency
A. measure of central tendencyAnkita Darji
 
Measure of Central Tendency
Measure of Central TendencyMeasure of Central Tendency
Measure of Central Tendency
Kaushik Deb
 
Topic 8a Basic Statistics
Topic 8a Basic StatisticsTopic 8a Basic Statistics
Topic 8a Basic StatisticsYee Bee Choo
 
Analyzing Responses to Likert Items
Analyzing Responses to Likert ItemsAnalyzing Responses to Likert Items
Analyzing Responses to Likert Items
Sanjay Kairam
 
Measures of Central Tendency
Measures of Central TendencyMeasures of Central Tendency
Measures of Central Tendency
Regina Cruz
 
Measures of central tendency by maria diza c. febrio
Measures of central tendency by maria diza c. febrioMeasures of central tendency by maria diza c. febrio
Measures of central tendency by maria diza c. febrio
mariadiza
 
Likert scale
Likert scaleLikert scale
Likert scale
Abhilash S Ram
 
K TO 12 GRADE 4 TEACHER’S GUIDE IN MATHEMATICS (Q1-Q4)
K TO 12 GRADE 4 TEACHER’S GUIDE IN MATHEMATICS (Q1-Q4)K TO 12 GRADE 4 TEACHER’S GUIDE IN MATHEMATICS (Q1-Q4)
K TO 12 GRADE 4 TEACHER’S GUIDE IN MATHEMATICS (Q1-Q4)
LiGhT ArOhL
 
Likert Scale
Likert ScaleLikert Scale
Likert Scale
anithagrahalakshmi
 
Grouped Mean Median Mode
Grouped Mean Median ModeGrouped Mean Median Mode
Grouped Mean Median Mode
Passy World
 

Viewers also liked (20)

Measure of Central Tendency
Measure of Central TendencyMeasure of Central Tendency
Measure of Central Tendency
 
Mean, Median, Mode: Measures of Central Tendency
Mean, Median, Mode: Measures of Central Tendency Mean, Median, Mode: Measures of Central Tendency
Mean, Median, Mode: Measures of Central Tendency
 
Applications of mean ,mode & median
Applications of mean ,mode & medianApplications of mean ,mode & median
Applications of mean ,mode & median
 
3.1-3.2 Measures of Central Tendency
3.1-3.2 Measures of Central Tendency3.1-3.2 Measures of Central Tendency
3.1-3.2 Measures of Central Tendency
 
Measures of central tendency
Measures of central tendencyMeasures of central tendency
Measures of central tendency
 
Measures of central tendency by MHM
Measures of central tendency by MHMMeasures of central tendency by MHM
Measures of central tendency by MHM
 
2 measure of central tendency
2 measure of central  tendency2 measure of central  tendency
2 measure of central tendency
 
Measures of central tendency
Measures of central tendencyMeasures of central tendency
Measures of central tendency
 
Stattistic ii - mode, median, mean
Stattistic ii - mode, median, meanStattistic ii - mode, median, mean
Stattistic ii - mode, median, mean
 
A. measure of central tendency
A. measure of central tendencyA. measure of central tendency
A. measure of central tendency
 
Chapter 3
Chapter 3Chapter 3
Chapter 3
 
Measure of Central Tendency
Measure of Central TendencyMeasure of Central Tendency
Measure of Central Tendency
 
Topic 8a Basic Statistics
Topic 8a Basic StatisticsTopic 8a Basic Statistics
Topic 8a Basic Statistics
 
Analyzing Responses to Likert Items
Analyzing Responses to Likert ItemsAnalyzing Responses to Likert Items
Analyzing Responses to Likert Items
 
Measures of Central Tendency
Measures of Central TendencyMeasures of Central Tendency
Measures of Central Tendency
 
Measures of central tendency by maria diza c. febrio
Measures of central tendency by maria diza c. febrioMeasures of central tendency by maria diza c. febrio
Measures of central tendency by maria diza c. febrio
 
Likert scale
Likert scaleLikert scale
Likert scale
 
K TO 12 GRADE 4 TEACHER’S GUIDE IN MATHEMATICS (Q1-Q4)
K TO 12 GRADE 4 TEACHER’S GUIDE IN MATHEMATICS (Q1-Q4)K TO 12 GRADE 4 TEACHER’S GUIDE IN MATHEMATICS (Q1-Q4)
K TO 12 GRADE 4 TEACHER’S GUIDE IN MATHEMATICS (Q1-Q4)
 
Likert Scale
Likert ScaleLikert Scale
Likert Scale
 
Grouped Mean Median Mode
Grouped Mean Median ModeGrouped Mean Median Mode
Grouped Mean Median Mode
 

Similar to 3.1 measures of central tendency

Stat11t chapter3
Stat11t chapter3Stat11t chapter3
Stat11t chapter3
raylenepotter
 
Measure of central tendency (2)
Measure of central tendency (2)Measure of central tendency (2)
Measure of central tendency (2)
AndresBrutas
 
Measures of Central Tendencies (2).pptx
Measures of Central Tendencies (2).pptxMeasures of Central Tendencies (2).pptx
Measures of Central Tendencies (2).pptx
Rishabh332761
 
Measures of Central Tendencies.pptx
Measures of Central Tendencies.pptxMeasures of Central Tendencies.pptx
Measures of Central Tendencies.pptx
Rishabh332761
 
Ch2 Data Description
Ch2 Data DescriptionCh2 Data Description
Ch2 Data Description
Farhan Alfin
 
Measures of central tendency
Measures of central tendencyMeasures of central tendency
Measures of central tendency
renukamorani143
 
Measures of central tendancy easy to under this stats topic
Measures of central tendancy easy to under this stats topicMeasures of central tendancy easy to under this stats topic
Measures of central tendancy easy to under this stats topic
Nishant Taralkar
 
Descriptive Statistics.pptx
Descriptive Statistics.pptxDescriptive Statistics.pptx
Descriptive Statistics.pptx
Shashank Mishra
 
2. Introduction-to-Measures-of-Central-Tendency.pptx
2. Introduction-to-Measures-of-Central-Tendency.pptx2. Introduction-to-Measures-of-Central-Tendency.pptx
2. Introduction-to-Measures-of-Central-Tendency.pptx
ShriramKargaonkar
 
Measures of central tendency
Measures of central tendencyMeasures of central tendency
Measures of central tendency
Mmedsc Hahm
 
Measure of Central Tendency
Measure of Central TendencyMeasure of Central Tendency
Measure of Central Tendency
Basudev Sharma
 
Classifying Data To Convey Meaning
Classifying Data To Convey MeaningClassifying Data To Convey Meaning
Classifying Data To Convey Meaning
Anubha Walia
 
3.2 measures of variation
3.2 measures of variation3.2 measures of variation
3.2 measures of variationleblance
 
Measures of the middle
Measures of the middleMeasures of the middle
Measures of the middle
Dana Lee Ling
 
Measure OF Central Tendency
Measure OF Central TendencyMeasure OF Central Tendency
Measure OF Central TendencyIqrabutt038
 
Descriptive statistics
Descriptive statisticsDescriptive statistics
Descriptive statistics
molly joy
 
STATISTICAL PROCEDURES (Discriptive Statistics).pptx
STATISTICAL PROCEDURES (Discriptive Statistics).pptxSTATISTICAL PROCEDURES (Discriptive Statistics).pptx
STATISTICAL PROCEDURES (Discriptive Statistics).pptx
MuhammadNafees42
 
Measure-of-central-tendency-Statistics-gr12.pptx
Measure-of-central-tendency-Statistics-gr12.pptxMeasure-of-central-tendency-Statistics-gr12.pptx
Measure-of-central-tendency-Statistics-gr12.pptx
justineeehaplit
 
CABT Math 8 measures of central tendency and dispersion
CABT Math 8   measures of central tendency and dispersionCABT Math 8   measures of central tendency and dispersion
CABT Math 8 measures of central tendency and dispersionGilbert Joseph Abueg
 

Similar to 3.1 measures of central tendency (20)

Stat11t chapter3
Stat11t chapter3Stat11t chapter3
Stat11t chapter3
 
Measure of central tendency (2)
Measure of central tendency (2)Measure of central tendency (2)
Measure of central tendency (2)
 
Measures of Central Tendencies (2).pptx
Measures of Central Tendencies (2).pptxMeasures of Central Tendencies (2).pptx
Measures of Central Tendencies (2).pptx
 
Measures of Central Tendencies.pptx
Measures of Central Tendencies.pptxMeasures of Central Tendencies.pptx
Measures of Central Tendencies.pptx
 
Ch2 Data Description
Ch2 Data DescriptionCh2 Data Description
Ch2 Data Description
 
Measures of central tendency
Measures of central tendencyMeasures of central tendency
Measures of central tendency
 
Measures of central tendancy easy to under this stats topic
Measures of central tendancy easy to under this stats topicMeasures of central tendancy easy to under this stats topic
Measures of central tendancy easy to under this stats topic
 
Descriptive Statistics.pptx
Descriptive Statistics.pptxDescriptive Statistics.pptx
Descriptive Statistics.pptx
 
2. Introduction-to-Measures-of-Central-Tendency.pptx
2. Introduction-to-Measures-of-Central-Tendency.pptx2. Introduction-to-Measures-of-Central-Tendency.pptx
2. Introduction-to-Measures-of-Central-Tendency.pptx
 
Measures of central tendency
Measures of central tendencyMeasures of central tendency
Measures of central tendency
 
Measure of Central Tendency
Measure of Central TendencyMeasure of Central Tendency
Measure of Central Tendency
 
Classifying Data To Convey Meaning
Classifying Data To Convey MeaningClassifying Data To Convey Meaning
Classifying Data To Convey Meaning
 
3.2 measures of variation
3.2 measures of variation3.2 measures of variation
3.2 measures of variation
 
Measures of the middle
Measures of the middleMeasures of the middle
Measures of the middle
 
Measure OF Central Tendency
Measure OF Central TendencyMeasure OF Central Tendency
Measure OF Central Tendency
 
Descriptive statistics
Descriptive statisticsDescriptive statistics
Descriptive statistics
 
STATISTICAL PROCEDURES (Discriptive Statistics).pptx
STATISTICAL PROCEDURES (Discriptive Statistics).pptxSTATISTICAL PROCEDURES (Discriptive Statistics).pptx
STATISTICAL PROCEDURES (Discriptive Statistics).pptx
 
Measure-of-central-tendency-Statistics-gr12.pptx
Measure-of-central-tendency-Statistics-gr12.pptxMeasure-of-central-tendency-Statistics-gr12.pptx
Measure-of-central-tendency-Statistics-gr12.pptx
 
CABT Math 8 measures of central tendency and dispersion
CABT Math 8   measures of central tendency and dispersionCABT Math 8   measures of central tendency and dispersion
CABT Math 8 measures of central tendency and dispersion
 
Descriptive statistics i
Descriptive statistics iDescriptive statistics i
Descriptive statistics i
 

More from leblance

Parent night contact&survey
Parent night contact&surveyParent night contact&survey
Parent night contact&surveyleblance
 
7.3 daqy 2
7.3 daqy 27.3 daqy 2
7.3 daqy 2leblance
 
10.3 part 1
10.3 part 110.3 part 1
10.3 part 1leblance
 
10.1 part2
10.1 part210.1 part2
10.1 part2leblance
 
10.1 part 1
10.1 part 110.1 part 1
10.1 part 1leblance
 
Ch 9 practice exam
Ch 9 practice examCh 9 practice exam
Ch 9 practice examleblance
 
5.4 synthetic division
5.4 synthetic division5.4 synthetic division
5.4 synthetic divisionleblance
 
5.4 long division
5.4 long division5.4 long division
5.4 long divisionleblance
 
9.3 Part 1
9.3 Part 19.3 Part 1
9.3 Part 1leblance
 
9.1 9.2 9.3 using the graph calc
9.1 9.2 9.3 using the graph calc9.1 9.2 9.3 using the graph calc
9.1 9.2 9.3 using the graph calcleblance
 
5.1 part 2
5.1 part 25.1 part 2
5.1 part 2leblance
 
9.2 lin reg coeff of det
9.2 lin reg coeff of det9.2 lin reg coeff of det
9.2 lin reg coeff of detleblance
 

More from leblance (20)

Parent night contact&survey
Parent night contact&surveyParent night contact&survey
Parent night contact&survey
 
7.3 daqy 2
7.3 daqy 27.3 daqy 2
7.3 daqy 2
 
7.3
7.37.3
7.3
 
7.1
7.17.1
7.1
 
7.2
7.27.2
7.2
 
10.3 part 1
10.3 part 110.3 part 1
10.3 part 1
 
10.2
10.210.2
10.2
 
10.1 part2
10.1 part210.1 part2
10.1 part2
 
10.1 part 1
10.1 part 110.1 part 1
10.1 part 1
 
Ch 9 practice exam
Ch 9 practice examCh 9 practice exam
Ch 9 practice exam
 
5.4 synthetic division
5.4 synthetic division5.4 synthetic division
5.4 synthetic division
 
5.4 long division
5.4 long division5.4 long division
5.4 long division
 
5.3
5.35.3
5.3
 
9.3 Part 1
9.3 Part 19.3 Part 1
9.3 Part 1
 
9.1 9.2 9.3 using the graph calc
9.1 9.2 9.3 using the graph calc9.1 9.2 9.3 using the graph calc
9.1 9.2 9.3 using the graph calc
 
5.2
5.25.2
5.2
 
5.1 part 2
5.1 part 25.1 part 2
5.1 part 2
 
5.1[1]
5.1[1]5.1[1]
5.1[1]
 
9.1
9.19.1
9.1
 
9.2 lin reg coeff of det
9.2 lin reg coeff of det9.2 lin reg coeff of det
9.2 lin reg coeff of det
 

Recently uploaded

Communications Mining Series - Zero to Hero - Session 1
Communications Mining Series - Zero to Hero - Session 1Communications Mining Series - Zero to Hero - Session 1
Communications Mining Series - Zero to Hero - Session 1
DianaGray10
 
Microsoft - Power Platform_G.Aspiotis.pdf
Microsoft - Power Platform_G.Aspiotis.pdfMicrosoft - Power Platform_G.Aspiotis.pdf
Microsoft - Power Platform_G.Aspiotis.pdf
Uni Systems S.M.S.A.
 
Elevating Tactical DDD Patterns Through Object Calisthenics
Elevating Tactical DDD Patterns Through Object CalisthenicsElevating Tactical DDD Patterns Through Object Calisthenics
Elevating Tactical DDD Patterns Through Object Calisthenics
Dorra BARTAGUIZ
 
FIDO Alliance Osaka Seminar: Passkeys at Amazon.pdf
FIDO Alliance Osaka Seminar: Passkeys at Amazon.pdfFIDO Alliance Osaka Seminar: Passkeys at Amazon.pdf
FIDO Alliance Osaka Seminar: Passkeys at Amazon.pdf
FIDO Alliance
 
Uni Systems Copilot event_05062024_C.Vlachos.pdf
Uni Systems Copilot event_05062024_C.Vlachos.pdfUni Systems Copilot event_05062024_C.Vlachos.pdf
Uni Systems Copilot event_05062024_C.Vlachos.pdf
Uni Systems S.M.S.A.
 
Observability Concepts EVERY Developer Should Know -- DeveloperWeek Europe.pdf
Observability Concepts EVERY Developer Should Know -- DeveloperWeek Europe.pdfObservability Concepts EVERY Developer Should Know -- DeveloperWeek Europe.pdf
Observability Concepts EVERY Developer Should Know -- DeveloperWeek Europe.pdf
Paige Cruz
 
Introduction to CHERI technology - Cybersecurity
Introduction to CHERI technology - CybersecurityIntroduction to CHERI technology - Cybersecurity
Introduction to CHERI technology - Cybersecurity
mikeeftimakis1
 
National Security Agency - NSA mobile device best practices
National Security Agency - NSA mobile device best practicesNational Security Agency - NSA mobile device best practices
National Security Agency - NSA mobile device best practices
Quotidiano Piemontese
 
A tale of scale & speed: How the US Navy is enabling software delivery from l...
A tale of scale & speed: How the US Navy is enabling software delivery from l...A tale of scale & speed: How the US Navy is enabling software delivery from l...
A tale of scale & speed: How the US Navy is enabling software delivery from l...
sonjaschweigert1
 
The Art of the Pitch: WordPress Relationships and Sales
The Art of the Pitch: WordPress Relationships and SalesThe Art of the Pitch: WordPress Relationships and Sales
The Art of the Pitch: WordPress Relationships and Sales
Laura Byrne
 
By Design, not by Accident - Agile Venture Bolzano 2024
By Design, not by Accident - Agile Venture Bolzano 2024By Design, not by Accident - Agile Venture Bolzano 2024
By Design, not by Accident - Agile Venture Bolzano 2024
Pierluigi Pugliese
 
GridMate - End to end testing is a critical piece to ensure quality and avoid...
GridMate - End to end testing is a critical piece to ensure quality and avoid...GridMate - End to end testing is a critical piece to ensure quality and avoid...
GridMate - End to end testing is a critical piece to ensure quality and avoid...
ThomasParaiso2
 
Pushing the limits of ePRTC: 100ns holdover for 100 days
Pushing the limits of ePRTC: 100ns holdover for 100 daysPushing the limits of ePRTC: 100ns holdover for 100 days
Pushing the limits of ePRTC: 100ns holdover for 100 days
Adtran
 
Generative AI Deep Dive: Advancing from Proof of Concept to Production
Generative AI Deep Dive: Advancing from Proof of Concept to ProductionGenerative AI Deep Dive: Advancing from Proof of Concept to Production
Generative AI Deep Dive: Advancing from Proof of Concept to Production
Aggregage
 
UiPath Test Automation using UiPath Test Suite series, part 4
UiPath Test Automation using UiPath Test Suite series, part 4UiPath Test Automation using UiPath Test Suite series, part 4
UiPath Test Automation using UiPath Test Suite series, part 4
DianaGray10
 
DevOps and Testing slides at DASA Connect
DevOps and Testing slides at DASA ConnectDevOps and Testing slides at DASA Connect
DevOps and Testing slides at DASA Connect
Kari Kakkonen
 
Why You Should Replace Windows 11 with Nitrux Linux 3.5.0 for enhanced perfor...
Why You Should Replace Windows 11 with Nitrux Linux 3.5.0 for enhanced perfor...Why You Should Replace Windows 11 with Nitrux Linux 3.5.0 for enhanced perfor...
Why You Should Replace Windows 11 with Nitrux Linux 3.5.0 for enhanced perfor...
SOFTTECHHUB
 
Securing your Kubernetes cluster_ a step-by-step guide to success !
Securing your Kubernetes cluster_ a step-by-step guide to success !Securing your Kubernetes cluster_ a step-by-step guide to success !
Securing your Kubernetes cluster_ a step-by-step guide to success !
KatiaHIMEUR1
 
GraphSummit Singapore | Enhancing Changi Airport Group's Passenger Experience...
GraphSummit Singapore | Enhancing Changi Airport Group's Passenger Experience...GraphSummit Singapore | Enhancing Changi Airport Group's Passenger Experience...
GraphSummit Singapore | Enhancing Changi Airport Group's Passenger Experience...
Neo4j
 
Alt. GDG Cloud Southlake #33: Boule & Rebala: Effective AppSec in SDLC using ...
Alt. GDG Cloud Southlake #33: Boule & Rebala: Effective AppSec in SDLC using ...Alt. GDG Cloud Southlake #33: Boule & Rebala: Effective AppSec in SDLC using ...
Alt. GDG Cloud Southlake #33: Boule & Rebala: Effective AppSec in SDLC using ...
James Anderson
 

Recently uploaded (20)

Communications Mining Series - Zero to Hero - Session 1
Communications Mining Series - Zero to Hero - Session 1Communications Mining Series - Zero to Hero - Session 1
Communications Mining Series - Zero to Hero - Session 1
 
Microsoft - Power Platform_G.Aspiotis.pdf
Microsoft - Power Platform_G.Aspiotis.pdfMicrosoft - Power Platform_G.Aspiotis.pdf
Microsoft - Power Platform_G.Aspiotis.pdf
 
Elevating Tactical DDD Patterns Through Object Calisthenics
Elevating Tactical DDD Patterns Through Object CalisthenicsElevating Tactical DDD Patterns Through Object Calisthenics
Elevating Tactical DDD Patterns Through Object Calisthenics
 
FIDO Alliance Osaka Seminar: Passkeys at Amazon.pdf
FIDO Alliance Osaka Seminar: Passkeys at Amazon.pdfFIDO Alliance Osaka Seminar: Passkeys at Amazon.pdf
FIDO Alliance Osaka Seminar: Passkeys at Amazon.pdf
 
Uni Systems Copilot event_05062024_C.Vlachos.pdf
Uni Systems Copilot event_05062024_C.Vlachos.pdfUni Systems Copilot event_05062024_C.Vlachos.pdf
Uni Systems Copilot event_05062024_C.Vlachos.pdf
 
Observability Concepts EVERY Developer Should Know -- DeveloperWeek Europe.pdf
Observability Concepts EVERY Developer Should Know -- DeveloperWeek Europe.pdfObservability Concepts EVERY Developer Should Know -- DeveloperWeek Europe.pdf
Observability Concepts EVERY Developer Should Know -- DeveloperWeek Europe.pdf
 
Introduction to CHERI technology - Cybersecurity
Introduction to CHERI technology - CybersecurityIntroduction to CHERI technology - Cybersecurity
Introduction to CHERI technology - Cybersecurity
 
National Security Agency - NSA mobile device best practices
National Security Agency - NSA mobile device best practicesNational Security Agency - NSA mobile device best practices
National Security Agency - NSA mobile device best practices
 
A tale of scale & speed: How the US Navy is enabling software delivery from l...
A tale of scale & speed: How the US Navy is enabling software delivery from l...A tale of scale & speed: How the US Navy is enabling software delivery from l...
A tale of scale & speed: How the US Navy is enabling software delivery from l...
 
The Art of the Pitch: WordPress Relationships and Sales
The Art of the Pitch: WordPress Relationships and SalesThe Art of the Pitch: WordPress Relationships and Sales
The Art of the Pitch: WordPress Relationships and Sales
 
By Design, not by Accident - Agile Venture Bolzano 2024
By Design, not by Accident - Agile Venture Bolzano 2024By Design, not by Accident - Agile Venture Bolzano 2024
By Design, not by Accident - Agile Venture Bolzano 2024
 
GridMate - End to end testing is a critical piece to ensure quality and avoid...
GridMate - End to end testing is a critical piece to ensure quality and avoid...GridMate - End to end testing is a critical piece to ensure quality and avoid...
GridMate - End to end testing is a critical piece to ensure quality and avoid...
 
Pushing the limits of ePRTC: 100ns holdover for 100 days
Pushing the limits of ePRTC: 100ns holdover for 100 daysPushing the limits of ePRTC: 100ns holdover for 100 days
Pushing the limits of ePRTC: 100ns holdover for 100 days
 
Generative AI Deep Dive: Advancing from Proof of Concept to Production
Generative AI Deep Dive: Advancing from Proof of Concept to ProductionGenerative AI Deep Dive: Advancing from Proof of Concept to Production
Generative AI Deep Dive: Advancing from Proof of Concept to Production
 
UiPath Test Automation using UiPath Test Suite series, part 4
UiPath Test Automation using UiPath Test Suite series, part 4UiPath Test Automation using UiPath Test Suite series, part 4
UiPath Test Automation using UiPath Test Suite series, part 4
 
DevOps and Testing slides at DASA Connect
DevOps and Testing slides at DASA ConnectDevOps and Testing slides at DASA Connect
DevOps and Testing slides at DASA Connect
 
Why You Should Replace Windows 11 with Nitrux Linux 3.5.0 for enhanced perfor...
Why You Should Replace Windows 11 with Nitrux Linux 3.5.0 for enhanced perfor...Why You Should Replace Windows 11 with Nitrux Linux 3.5.0 for enhanced perfor...
Why You Should Replace Windows 11 with Nitrux Linux 3.5.0 for enhanced perfor...
 
Securing your Kubernetes cluster_ a step-by-step guide to success !
Securing your Kubernetes cluster_ a step-by-step guide to success !Securing your Kubernetes cluster_ a step-by-step guide to success !
Securing your Kubernetes cluster_ a step-by-step guide to success !
 
GraphSummit Singapore | Enhancing Changi Airport Group's Passenger Experience...
GraphSummit Singapore | Enhancing Changi Airport Group's Passenger Experience...GraphSummit Singapore | Enhancing Changi Airport Group's Passenger Experience...
GraphSummit Singapore | Enhancing Changi Airport Group's Passenger Experience...
 
Alt. GDG Cloud Southlake #33: Boule & Rebala: Effective AppSec in SDLC using ...
Alt. GDG Cloud Southlake #33: Boule & Rebala: Effective AppSec in SDLC using ...Alt. GDG Cloud Southlake #33: Boule & Rebala: Effective AppSec in SDLC using ...
Alt. GDG Cloud Southlake #33: Boule & Rebala: Effective AppSec in SDLC using ...
 

3.1 measures of central tendency

  • 1. 3.1 Measures of Central Tendency: Mode, Median, and Mean CHAPTER 3 AVERAGES AND VARIATION
  • 2. Page 82 Averages  An average is a single number used to describe an entire sample or an entire population.  There are many ways to compute averages, but we will study only three of the major ones.  Mode, Median, and Mean
  • 3. Page 82 Mode  The mode of a data set is the value that occurs most frequently.  The easiest average to compute  For larger data sets, it is useful to order—or sort—the data before scanning them for the mode.  Not every data set has a mode  The mode is not very stable. Changing just one number in a data set can change the mode dramatically.  The mode is a useful average when we want to know the most frequently occurring data value
  • 4. Page 83 Median  The median is the central value of an ordered distribution.  The median uses the position rather than the specific value of each data entry.  If the extreme values of a data set change, the median usually does not change.  Advantage: if a data set contains an outlier, the median may be a better indicator of the center  Disadvantage: not sensitive to the specific size of a data value
  • 5. Median  To find the median: 1. Order the data from smallest to largest 2. For an odd number of data values in the distribution: 3. For an even number of data values in the distribution: To find the middle of a large data set:
  • 6. Page 85 Mean  The mean is an average that uses the exact value of each entry is the mean (sometimes called the arithmetic mean).  The most important/frequently used ―average‖  When the sample size is large and does not include outliers, the mean score usually provides a better measure of central tendency.  Disadvantage: it can be affected by exceptional values/outliers
  • 7. Mean  To compute the mean: add the values of all the entries and then divide by the number of entries.
  • 8. Note AP Formula Sheet! Mean ∑ is the Greek  Notation letter S called  Let x represent any value in the data set ―sigma‖  The summation symbol ∑ means ―sum the following‖  ∑x (read ―the sum of all given x values‖) means add up all the x values The mean of a sample is called ―x bar‖ The mean of a population is called ―mu‖ n = number of data values in the sample N = number of data values in the sample μ is the Greek letter mu called ―mew‖
  • 9. Using the Calculator  The TI-83 and TI-84 make it fairly easy to find the mode, median, and mean. 1. Enter the data values in L1 2. Hit STAT, choose 2:SortA to organize the data 3. View the list to find the mode 4. Hit STAT, tab over to CALC, choose 1:1 – Var Stats, Hit 2nd 1 ENTER Because the formulas for the sample mean and the population mean are the same, this feature is used to find, μ. It is YOUR job to know if you are working with a sample or a population.
  • 10. Mean and Median  The mean and median of two key measures of center.  Important for comparing data sets  State what the values are AND what they tell us about each set or one set compared to the other  Important for describing data sets  Gives a ―typical‖ number to consider when looking at any data sets  For Example:  Consider two data sets A and B where they are both roughly normal (bell-shaped) and have about the same spread. The mean of A is 6 and the mean of B is 4.  You might say: ―Set A is centered at 6, where set B is centered at 4. Since the mean of set B is lower than set A, set B would have lower overall values, on average than set A‖
  • 11. Page 86 Resistant Measures  A resistant measure is one that is not influenced by extremely high or low data values.  The mean is not a resistant measure of center because changing the size of only one data value will affect the mean and it is affected by outliers.  The mean is an example of a non-resistant measure.  The median is more resistant to changes in individual data values and outliers.
  • 12. Page 87 Data Types and Averages  Levels of Measurement: nominal, ordinal, interval, and ratio  The mode (if it exists) can be used with all four levels  The median can be used with data at the ordinal level of above.  The mean can be used with data at the interval or ratio level (there are some exceptions at the ordinal level).  Be careful with taking the average of averages!  We need to know the sample size used to find each individual average
  • 13. Page 88 Distribution Shapes and Averages  There are ―general relationships‖ among the mean, median, and mode for different types of distributions. (a) Mound-shaped symmetrical: (b) Skewed left: the (c) Skewed right: the the mean, median, and mean is less than the mode is the smallest mode are the same or almost median and the value, the median is the the same median is less than the next largest, and the mean mode is the largest
  • 14. Homework  Page 89  #1, 2, 3, 6, 7, 8, 14  #17 Parts a, b, & c only  #18