Download to read offline


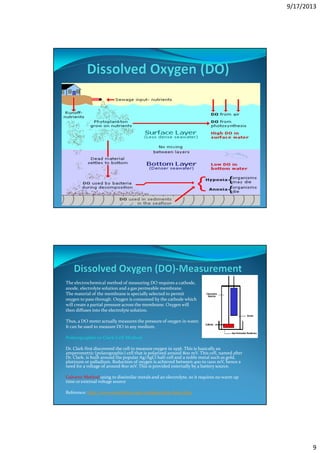


The document outlines various measurements and methods for monitoring water quality, including pH, conductivity, and dissolved oxygen, referencing standard methods from organizations like EPA and ASTM. It describes the principles behind these measurements, calibration techniques, and essential maintenance practices for probes and meters used in these assessments. Key factors affecting measurements such as temperature, water composition, and equipment storage are also addressed.


![Electrolyte Analyzer.Pptx [Autosaved]](https://cdn.slidesharecdn.com/ss_thumbnails/electrolyteanalyzer-pptxautosaved-091114145704-phpapp01-thumbnail.jpg?width=640&height=640&fit=bounds)


![Presentation to AZ WQA (1) [Read-Only]](https://cdn.slidesharecdn.com/ss_thumbnails/fcd3223d-dca9-4cfb-8f1e-22dffa830632-151012180053-lva1-app6891-thumbnail.jpg?width=640&height=640&fit=bounds)


