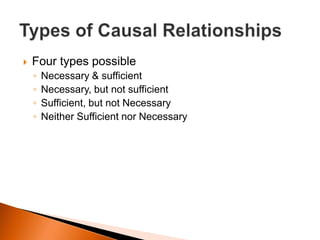
Downloaded 221 times
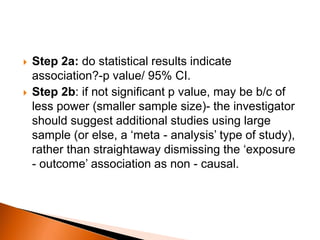
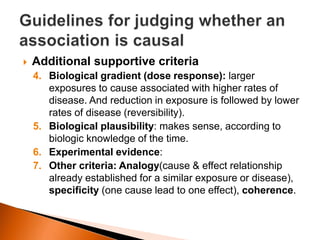
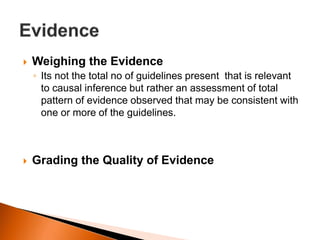
![ Cause defined as “anything producing an effect or
a result”. [Webster]
Cause in medical textbooks discussed under
headings like- “etiology”, “Pathogenesis”,
“Mechanisms”, “Risk factors”.
Important to physician because it guides their
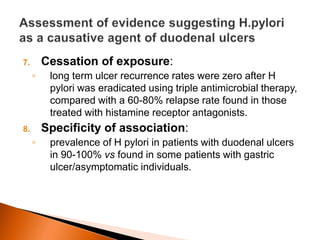
approach to three clinical tasks- Prevention,
Diagnosis & Treatment. Eg…..](https://image.slidesharecdn.com/rupeshassociationvscausation-140923140815-phpapp01/85/Association-vs-causation-10-320.jpg)
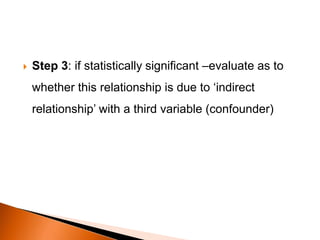
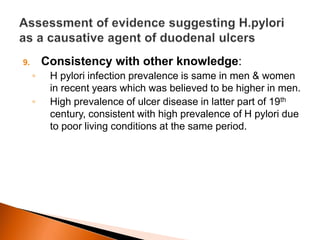
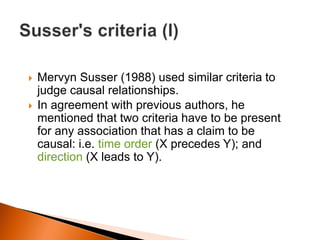
![ In what ci rcumstances can we
pass f rom [an] observed
associat ion to a verdict of
causat ion? Upon what basis
should we proceed to do so?
Sir Austin Bradford Hill, 1965](https://image.slidesharecdn.com/rupeshassociationvscausation-140923140815-phpapp01/85/Association-vs-causation-24-320.jpg)

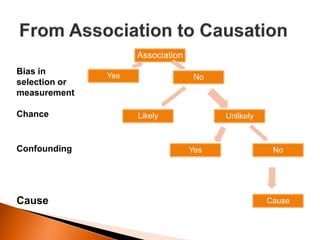

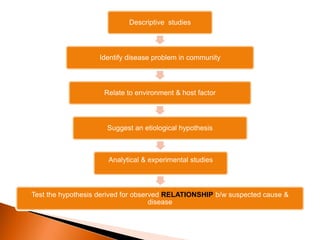
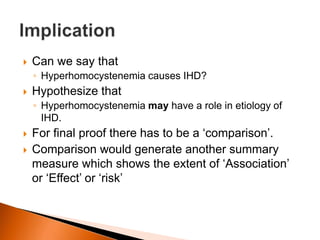
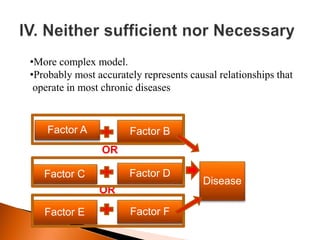
The document discusses the identification and testing of disease causality through various types of studies, emphasizing the importance of establishing associations and distinguishing between different types of relationships (causal, indirect, and spurious). It outlines key criteria for establishing causal relationships, such as temporality, strength of association, and biological plausibility, and discusses the implications for clinical practice in prevention, diagnosis, and treatment. The document emphasizes the need for rigorous methods and comparisons to affirm causative links in epidemiology.


![Associations[1]](https://cdn.slidesharecdn.com/ss_thumbnails/associations1-140402063706-phpapp02-thumbnail.jpg?width=640&height=640&fit=bounds)
![Associations[1] (2)](https://cdn.slidesharecdn.com/ss_thumbnails/associations12-140402063711-phpapp01-thumbnail.jpg?width=640&height=640&fit=bounds)


