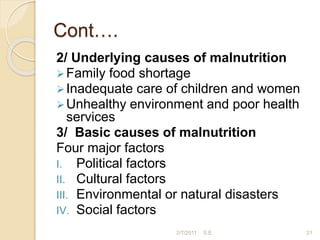
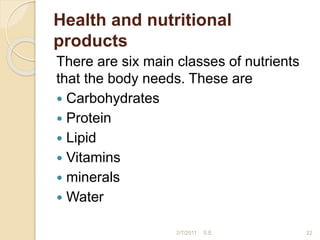
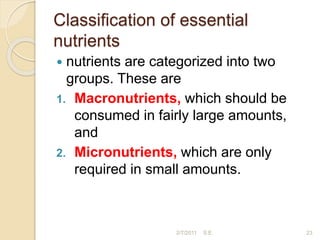
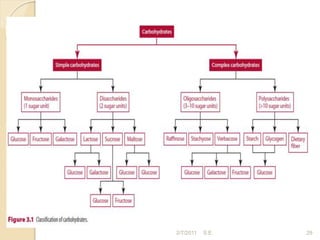
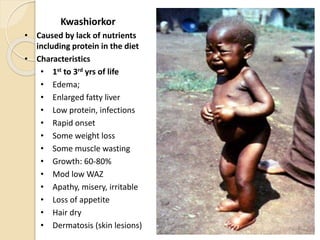
Mizan –Aman
College of Health Sciences
Department of midwifery
Human Nutrition For level III
MW Students
By: Sebsibe E. (Bsc, PHO)
objectives
At the end of this unit, you will be able
to:
Define common terms used in nutrition
List common forms of malnutrition
Describe the six nutritional
constituents
Describe the function of the six
nutritional constituents
Identify nutritional deficiencies
2/7/2011 S.E. 2
Pretest questions
1. What is nutrition?
2. What is malnutrition?
3. How do you classify carbohydrates?
4. What are the functions of protein?
5. What are the food sources of Vitamin
A?
2/7/2011 S.E. 3
Introduction to Nutrition
Human nutrition
 The science of foods, the nutrients and the
substances there in, their action, interaction
and balance in relation to health and
diseases.
 Nutrition science is the area of knowledge
regarding the role of food in the maintenance
of good health.
 Thus nutrition is the study of food at work in
our body“ (The Council On Food And
Nutrition Of The American Medical
Association).
4
2/7/2011 S.E.
Dietetics
It is Science/ art of applying the
principles of nutrition in feeding .
Food
Anything which is edible as defined
based on specific culture, religion,
ethnicity, etc.
Diet
It is the sequence of meals in a day. It
is concerned about the eating style of
individuals or a group.
Nutrient: - is an active ingredient in the
food that play specific structural or
functional role in the body’s lively activities.
5
2/7/2011 S.E.
Macronutrients
Are nutrients that are required by our
body in larger quantities on a daily
basis and need to be transformed in to
smaller units by the body in order to
give essential functions in the body in
process. E.g. carbohydrates, fats &
lipids, proteins
Micronutrients
Are nutrients that are required in
small quantities by the body and
perform essential physiological &
structural functions. e.g. – Vitamins,
minerals 6
2/7/2011 S.E.
Malnutrition
The shortage of nutrient leads to
malnutrition of one form or another.
On other hand;
The excessive consumption of some
nutrients may also be harmful to the
body and lead to metabolic disorders
or in the case of excessive
consumption of fat and carbohydrate
to obesity.
7
2/7/2011 S.E.
GROWTH AND
DEVELOPMENT
Definitions
 Growth: Is the process of growing –
the increase in size and development
of a living organism from a simple to a
more complex form or from its earliest
stage of being to maturity.
 Development: implies an increase in
skill and complexity of function.
8
2/7/2011 S.E.
Factors Affecting growth
 Genetic factors
 Neural control of growth
 Hormonal influence
 Nutrition
 Environmental and social factors
9
2/7/2011 S.E.
Assessment of Growth and
Development
 Disease in childhood affects growth
and development.
 Measurement of growth and
development is therefore an essential
skill to monitor the health of the
individual child and the community at
large.
10
2/7/2011 S.E.
Assessment of Growth
 The most powerful tool in growth
assessment is the growth chart
 The growth chart provides most of the
information needed to assess growth.
 The standard charts are based on data
collected from 1963 to1975 by the
National Centres for Health Statistics
(NCHS) on
weight for age,
height for age,
head circumference for age, and
weight for height
11
2/7/2011 S.E.
 Separate charts are provided for boys
and girls
 Each chart is composed of seven
percentile curves
 normal values for age are represented
between the fifth and ninety-fifth
percentiles, and the fiftieth percentile
represents the median (standard) value.
 In children under 5 years old an
additional chart (Harvard standard) is
used to measure weight for age as
percentages of the median or standard
value in the NCHS curve.
12
2/7/2011 S.E.
Developmental Assessment
Assessment of development helps to
identify children with developmental
delay.
For this purpose the following
developmental assessments may be
used.
Gross motor development
Manipulation (fine motor
development)
Cognition and social skill
Language 13
2/7/2011 S.E.
Developmental milestones in
the 1st yr of life
Milestone Average age of
Attainment (in
months)
Developmental
implication
Gross motor
Head steady in sitting 2 Allows more visual
intention
Pull to sit, no head lag 3 Muscle tone
Hands together in mid
line
3 Self discovery
Sits without support 6 Increasing exploration
Rolls back to stomach 6.5 Truncal flexion, risk of
falls
Walks alone 12 Exploration, control of
proximity to parents
Runs 16 Supervision more
difficult
14
2/7/2011 S.E.
15
Fine motor
Grasps rattle 3.5 Object use
Reaches for object 4 Visual motor
coordination
Transfers objects 5 Comparison of
objects
Thumb -finger grasp 8 Able to explore small
object
Scribbles 13 Visual-motor
coordination
Communication
and Language
Smile in response to
face, voice
1.7 More active social
participation
Monosyllabic babble 6 Experiment sound
Follows one step
command gesture
7 non verbal
communication
2/7/2011 S.E.
Follows one step out gesture 10 Verbal receptive
language
Speaks 1st real word 12 Beginning of labeling
Speaks 4-6 word 15 Acquisition of object &
personal name
Speaks 10-15 word 18 Acquisition of objects
& personal name
Speaks two word sentences 19 Beginning of
grammatization
Cognitive
Stares momentarily at spot
where object disappeared
2 Lack of objective
permanence
Uncovers toy (after seeing
i.e. hidden)
8 Object permanence
Egocentric pretend play 12 Beginning symbolic
thoughts
16
2/7/2011 S.E.
Consequences of malnutrition
 The enormous consequences of
malnutrition are often not appreciated
because they may be hidden.
 Often there are no obvious signs, and
the victims themselves are silent and
not aware of the problem.
 considerable damage to the
developing child has been done and
satisfactory recovery becomes less
likely.
17
2/7/2011 S.E.
Cont…..
 Well-nourished women are likely to be
fit and healthy and able to look after
their family well.
 The outcomes of pregnancy and
lactation are improved when the
woman is healthy herself.
 Just as malnutrition has many causes,
its effects are also multidimensional in
nature.
18
2/7/2011 S.E.
Cont…
1. Increased risk of disease and death
2. Low productivity of the malnourished
individuals
3. Poor school performance and
attendance
4. Poverty perpetuation (a vicious
circle)
5. Intergenerational cycle of
malnutrition
19
2/7/2011 S.E.
Causes of malnutrition
20
Causes could be categorized as:
Immediate causes
Underlying causes, and
Basic causes
1/ Immediate causes of malnutrition
Poor diet
Disease
2/7/2011 S.E.
Cont….
2/ Underlying causes of malnutrition
Family food shortage
Inadequate care of children and women
Unhealthy environment and poor health
services
3/ Basic causes of malnutrition
Four major factors
I. Political factors
II. Cultural factors
III. Environmental or natural disasters
IV. Social factors
21
2/7/2011 S.E.
Health and nutritional
products
There are six main classes of nutrients
that the body needs. These are
 Carbohydrates
 Protein
 Lipid
 Vitamins
 minerals
 Water
22
2/7/2011 S.E.
Classification of essential
nutrients
 nutrients are categorized into two
groups. These are
1. Macronutrients, which should be
consumed in fairly large amounts,
and
2. Micronutrients, which are only
required in small amounts.
23
2/7/2011 S.E.
Macronutrients:
Carbohydrates, Proteins, and
Fats
24
2/7/2011 S.E.
What are macronutrients?
 Macronutrients are nutrients that provide
calories or energy.
 Since “macro” means large, macronutrients
are nutrients needed in large amounts.
There are three macronutrients:
◦ Carbohydrate
◦ Protein
◦ Fat
25
2/7/2011 S.E.
Macronutrients contribute to the
energy pool of the body
26
 Carbohydrates
 (45-65%)
Energy
Pool
of the
body
(100%)
Fats
20% - 35%
Proteins
(10% - 35%)
2/7/2011 S.E.
Cont’…
 While each of these macronutrients provides
calories, the amount of calories that each one
provides varies.
 Carbohydrate provides 4 kilocalories per gram.
 Protein provides 4 kilocalories per gram.
 Fat provides 9 kilocalories per gram.
 Besides carbohydrate, protein, and fat the
only other substance that provides calories is
alcohol. Alcohol provides 7 kilocalories per
gram.
 Alcohol, however, is not a macronutrient
because we do not need it for survival and it
interferes with the body’s growth, maintenance,
and repair.
27
2/7/2011 S.E.
Carbohydrates
• Carbohydrates are called carbohydrates
because they are essentially hydrates of carbon
(i.e. they are composed of carbon and water
and have a composition of (CH2O)n.
• The major nutritional role of carbohydrates is
to provide energy and digestible carbohydrates
provide 4 kilocalories per gram.
• No single carbohydrate is essential, but
carbohydrates do participate in many required
functions in the body.
28
2/7/2011 S.E.
29
2/7/2011 S.E.
 Simple sugars
 Monosaccharides
 Three common sugars share the same
molecular formula: C6H12O6. Because of their
six carbon atoms, each is a hexose.
 They are:
 1. Glucose - "blood sugar", the immediate and
major source of energy for cellular respiration.
• Also called as dextrose or grape sugar.
• It is the end product of digestion of starch,
sucrose, maltose and lactose.
• Found in fruits, vegetables, honey, corn syrup
and molasses
• After meal glucose is converted to glycogen
and excess is converted to triaglycerol and
stored.
30
2/7/2011 S.E.
 2. Galactose - a sugar in milk (and yoghurt),
• It is not found free in nature
• Produced in the body during digestion of lactose
• Also called as milk sugar
• During lactation glucose is converted to
galactose so that milk can be produced.
 3. Fructose - a sugar found in fruits and honey.
• It is the sweetest of all sugars and also known
as levulose or fruit sugars.
• It is produced during digestion of sucrose and is
found in nectar of flowers, honey and molasses.
31
2/7/2011 S.E.
Disaccharides
 Three common disaccharides:
 All sugars are very soluble in water
because of their many hydroxyl
groups.
 Although not as concentrated a fuel as
fats, sugars are the most important
source of energy for many cells.
32
2/7/2011 S.E.
 1. Sucrose — common table sugar =
glucose + fructose
• Is made up of one glucose unit and one
fructose unit.
• Found in molasses, sorghum and corn
syrups
• Also called as table sugar and used at
home daily.
 2. Lactose — major sugar in milk =
glucose + galactose
• Only found in milk
• When hydrolyzed yields galactose and
glucose.
33
2/7/2011 S.E.
 3. Maltose — product of starch
digestion = glucose + glucose
• Has two glucose units.
• Maltose(malt sugar) is found in
sprouts and sweetening agents
• Is formed in the body as an
intermediate product of starch
digestion.
• Is found in beer, infant formulas and
malted breakfast cereals
34
2/7/2011 S.E.
Complex carbohydrates
(polysaccharides)
 Oligosaccharides
 Polysaccharides
◦ Starch
◦ Glycogen
◦ Dietary fiber =Nonstarch polysaccharide
(cellulose,
hemicelluloses, pectins, gums, and mucilages as
well as the nonpolysaccharides lignins, cutins,
and tannins).
o Complex CHO that contain as many as 60000
CHO molecules.
o Starch, glycogen and cellulose are important in
nutrition.
35
2/7/2011 S.E.
Starch
Major storage carbohydrate in higher
plants.
Glycogen
 Major storage carbohydrate in animals
Cellulose
• Comprises of 50% or more of all carbon
found in vegetation.
• Structural constituent of plant cell wall.
• Humans do not have the enzymes to
digest cellulose.
• Also called dietary fiber or roughage.
36
2/7/2011 S.E.
FUNCTIONS OF CARBOHYDRATES:
 Energy supply:
 To meet immediate energy needs as glucose
 The CNS is entirely dependent on glucose for
energy.

 Protein sparing action:
 When CHO and fat content of diet is low
more protein is used for energy at expense
of tissue building and maintenance(weight
reduction)
 Helping the body use fat effectively:
 Prevents the occurrence of ketosis due to
mobilization of lipids.
37
2/7/2011 S.E.
 Lactose enhances calcium absorption:
 As component of body substances and
compounds
 as heparin, nervous tissue, ribose and
component in the liver that destroys toxins.
 Encouraging the growth of useful bacteria:
 Fructose oligosaccharides selectively promote
the growth of important bacteria like
lactobacillus and bifido bacteria.
 Probiotic: bacteria that benefit the host by
acting upon the food
 Prebiotic: Food stuffs that selectively
stimulate the growth of essential bacteria ex.
Fructose, oligosaccharides.
38
2/7/2011 S.E.
 Promoting normal functioning of the lower
intestinal tract:
 Dietary fiber promote peristalsis and normal
movement of the food and waste products along
the GI tract and prevent occurrence of diseases.
 Improving the palatability of food and drink:
 Sucrose is used as sweetening agent and added
to foods like biscuits, soft drink, coffee, tea etc.
 Texturing and preservatives:
 Starch and soluble fiber are used in food industry
to improve texture
39
2/7/2011 S.E.
 FOOD SOURCE OF CARBOHYDRATES:
 FREE SUGARS: Syrups, cereal grains, dried fruits, pasta, candies,
pastries/kyk/ and breads and fruits like banana and sweet
potato.(high CHO density)
 Oligosaccharides(medium CHO density): garlic, onions,
legumes, fruits and molasses.
 Polysaccharides: fruits, vegetables, cereals and legumes, whole
grain cereals.
 high carbohydrate sources: bread, cereals, rice, pasta, vegetables
 Low sources-egg, fish, poultry/honey meat/, cheese, meat, milk,
animal and vegetable fats contain CHO.
40
2/7/2011 S.E.
 RECOMMENDED DAILY ALLOWANCE:
• Daily intake from food should not contribute
more than 50% of total daily requirement.
• To prevent ketosis 50 – 100 gms of CHO intake
is recommended.
• Excess CHO consumed can be converted to
lipids and get stored leading to obesity.
• Dental caries is the commonest problem for
frequent frank sugar consumers.
• Decreased sugar intake may lead to utilization of
body’s protein pool leading to cachexia.
41
2/7/2011 S.E.
Proteins and Amino Acids
 About 10–35% of calories should
come from protein.
 Proteins are needed in our diets for
growth (especially important for
children, teens and pregnant women)
and to improve immune functions.
 They also play an important role in
making essential hormones and
enzymes, in tissue repair, preserving
lean muscle mass, and
42
2/7/2011 S.E.
Cont….
 Pregnant women need protein to build
their bodies and that of the babies and
placentas,
 To make extra blood and for fat
storage. Breastfeeding mothers need
protein to make breast milk.
 supplying energy in times when
carbohydrates are not available.
43
2/7/2011 S.E.
Classification of proteins
 Essential – must be consumed in the
diet
 Nonessential– can be synthesized in
the body
 Conditional Amino acids– cannot be
synthesized due to illness or lack of
necessary precursors
◦ Premature infants lack sufficient enzymes
needed to create arginine
44
2/7/2011 S.E.
45
2/7/2011 S.E.
46
2/7/2011 S.E.
Best Sources of Protein
47
2/7/2011 S.E.
Functions of protein
◦ Provide structural and mechanical
support
◦ Maintain body tissues
◦ Functions as enzymes and
hormones
◦ Help maintain acid base balance
◦ Transport nutrients
◦ Assist the immune system
◦ Serve as a source of energy when
necessary
48
2/7/2011 S.E.
Nitrogen Balance
Definition: Nitrogen balance refers to the
situation where nitrogen intake from food
is equal to nitrogen excretion.
 This occurs in a healthy non-growing
adult person taking adequate amount of
energy from carbohydrates.
 In some situations Nitrogen excretion
may be greater than nitrogen intake, this
is called negative nitrogen balance.
 Other situations where nitrogen excretion
is less than nitrogen intake from food are
called positive nitrogen balance.
49
2/7/2011 S.E.
Factors affecting nitrogen
equilibrium
50
Nitrogen intake = Nitrogen Excretion (nitrogen balance)
?
Positive Nitrogen balance
-Pregnancy
-Lactation
-Growth
-Recovery from Illness (Convalescent stage)
Negative Nitrogen balance
1. Starvation
2. Devastating illness
3. Protein energy malnutrition
2/7/2011 S.E.
Nitrogen Balance and
Imbalance
51
2/7/2011 S.E.
Protein requirement
 Protein intake recommendations
◦ 10–35% of total daily kilocalories
◦ Adults over 18
 0.8 g/kg daily
 American College of Sports Medicine,
the American Dietetic Association, and
other experts advocate
◦ 50–100% more protein for competitive
athletes participating in endurance exercise
or resistance exercise
◦ Typically this population eats more and
therefore gets additional protein
52
2/7/2011 S.E.
Eating Too Much Protein
 Risk of heart disease
 Risk of kidney stones
 Risk of calcium loss from bones
 Risk of colon cancer
 Displacement of other nutrient-rich,
disease preventing foods
53
2/7/2011 S.E.
Eating Too Little Protein
 Protein-energy malnutrition (PEM)
◦ Protein is used for energy rather
than its other functions in the body
◦ Other important nutrients are in short
supply
◦ More prevalent in infants and
children
 17,000 children die each day as a result
54
2/7/2011 S.E.
Types of PEM: Kwashiorkor
Severe protein deficiency
◦ Generally result of a diet high in grains
and deficient in protein
Symptoms range from
◦ Edema in legs, feet, and stomach
◦ Muscle tone and strength diminish
◦ Hair is brittle and easy to pull out
◦ Appear pale, sad, and apathetic
◦ Prone to infection, rapid heart rate,
excess fluid in lungs, pneumonia,
septicemia, and water and electrolyte
imbalances
(Image from http://www.thachers.org/pediatrics.htm)
55
2/7/2011 S.E.
Types of PEM: Marasmus
Results from a severe
deficiency in kilocalories
◦ Frail, emaciated appearance
◦ Weakened and appear
apathetic
◦ Many cannot stand without
support
◦ Look old
◦ Hair is thin, dry, and lacks
sheen
◦ Body temperature and blood
pressure are low
◦ Prone to dehydration,
infections, and unnecessary
blood clotting 56
2/7/2011 S.E.
Types of PEM: Marasmic
Kwashiorkor
 Chronic deficiency in
kilocalories and protein
◦ Have edema in legs and
arms
◦ Have a “skin and bones”
appearance
◦ With treatment the edema
subsides and appearance
becomes more like
someone with marasmus
57
2/7/2011 S.E.
Fats and oils
58
Fats and oils are
concentrated sources of
energy and so are
important nutrients for
young children who need a
lot of energy-rich food.
 Fats can also make meals
more tasty and satisfying.
Fat is found in meat,
chicken, milk products,
butters, creams, avocado,
cooking oils and fats,
cheese, fish and ground
2/7/2011 S.E.
Classification of fats
 Fats are classified into saturated and
unsaturated fats.
 The classification is important to
enable you to advise your community
about which fats can be consumed
with less risk to people’s health.
 Saturated fats are not good for a
person’s health.
59
2/7/2011 S.E.
Saturated fats are usually solid at cool
temperatures. Eating too much saturated
fat is not good for a person’s health, as it
can cause heart and blood vessel
problems.
Unsaturated fats are usually liquid at
room temperature. These types of fats
are healthy fats. Examples include fats
from fish, oil seeds (sesame and
sunflower), maize oil and ground nut oil
and breast milk.
NOTE
- as a general rule, plant sources of fats
are better for a person’s health than the
animal sources, because animal fats
contain more saturated fats. 60
2/7/2011 S.E.
Food Sources for Fats
 There are three main types of fat, saturated fat,
unsaturated fat, and trans fat.
High Risk to CHD
◦ Saturated fat (found in foods like meat, butter, lard,
and cream) and
◦ trans fat (found in baked goods, snack foods, fried
foods, and margarines) have been shown to increase
your risk for heart disease.
Low Risk to CHD
◦ Unsaturated Fat (PUFAS & MUFAS) (found in foods
like olive oil, avocados, nuts, and canola oil,
vegetable oils, fish)
*Replacing saturated and trans fat in your diet with unsaturated fat has
been shown decrease the risk of developing heart disease.
61
2/7/2011 S.E.
FUNCTIONS
 Concentrated sources of energy i.e. 9
calories/gram
 Insulator of heat under the skin
 Improves the palatability of food
 Helps for absorption of fat soluble
vitamins
 Supports the internal organs
 Reserve storage form of energy
 Myelin sheath of nerves
62
2/7/2011 S.E.
Dietary Recommendations
 Total fatty acid intake should average
30 % of dietary energy. Of this,
10 % of total energy should be provided
by saturated fatty acids,
 12 % by monounsaturated fatty acids,
6 % from polyunsaturated fatty acids and
2 % from trans fatty acids.
63
2/7/2011 S.E.
Cont..
 Excessive intake: results in positive
energy balance and obesity,
complications like HTN, DM and
atherosclerosis
 Inadequate intake- results in EFA
deficiencies manifested by itching,
skin and another health problems.
Decrease growth and development of
infant an young children
64
2/7/2011 S.E.
Water
 A 50 kg adult contains about 31 liters of
water and a one year old, 10 kg child
contains nearly 8 liters of water.
 Almost every part of the body contains
large amounts of water.
 People can live without solid food for a
few weeks, but we cannot live without
water for more than a few days.
 An adult needs about 2–3 litres of water
each day. That is why giving drinks are
so important when people lose a lot of
water, such as when they have
diarrhoea.
65
2/7/2011 S.E.
Water is essential for life.
 For the body to make cells and fluids
such as tears, digestive juices and
breast milk.
 For the body to make sweat for cooling
itself.
 For essential body processes — most
take place in water.
 For keeping the lining of the mouth,
intestine, eyelids and lungs wet and
healthy.
 For the production of urine, which carries
waste from the body.
2/7/2011 S.E. 66
Quiz
1. One of the following is major source
of energy pool
A. Proteins B. fats C. carbohydrates D.
lipid
2. The sweetest of all sugar
A. Maltose B. sucrose C. fructose D.
glucose
3. Over consumption of CHO can result
the following health problem
EXCEPT 2/7/2011 S.E. 67
Cont..
4. Nonessential amino acids must
consumed in the diet
A. True B. False
5. The most abundant source of
proteins are
A. Fruit B. vegetable C. meat D.
cereals
6. Eating too much protein can result
A. Kwashiorkor B. marasmus C. heart
disease D. all
2/7/2011 S.E. 68
Cont…
7. Write three function of carbohydrate
A.-------------------------
B. -------------------------
C. ------------------------
8. Write three function of protein
A.-------------------------
B. -------------------------
C. ------------------------
2/7/2011 S.E. 69
cont….
9. --------- fats are not good for a
person’s health
10. Animal sources of fats are better for
a person’s health than the plant sources
A. False B. True
2/7/2011 S.E. 70
71
VITAMINS
2/7/2011 S.E.
Vitamins
Essential organic substances (contain
carbon)
◦ Not synthesized
◦ Inadequate synthesis
 Yield no energy, but facilitate energy-
yielding chemical reactions
 If absent from a diet, it will produce
deficiency signs and symptoms
72
2/7/2011 S.E.
Body Needs Vitamins for
Normal
Function
Growth
Maintenance
Reproduction
73
2/7/2011 S.E.
Vitamin Classification
  Fat-soluble vitamins
– Dissolve in substances such as ether and benzene
but not readily in water
– Include vitamins A, D, E, and K
  Water-soluble vitamins
– Vitamins that dissolve in water
– Include B vitamins and vitamin C
74
2/7/2011 S.E.
Fat vs. Water Soluble Vitamins
Characteristics Water soluble Fat soluble
Examples All the eight B complexes
and vitamin C
Vitamins A, D, E and K
Solubility Soluble in water Soluble in lipids and
organic compounds
(chloroform, benzene, ether,
etc)
Storage Not stored very much Stored in different organs
Absorption Directly With lipids through the
lymphatic system
Transport in the blood Freely Need to be bound to carrier
protein
75
2/7/2011 S.E.
Cont…
Deficiency Develop following acute
shortages
Deficiency doesn’t
develop following acute
shortage of the vitamins
•Slow to develop
deficiency
Fat mal absorption
syndrome (steatorhea)
Does not result in their
deficiency
Results in their
deficiency
Toxicity upon intake of
mega doses (e.g. During
treatment)
Unlikely to occur Likely to occur
76
2/7/2011 S.E.
77
2/7/2011 S.E.
Water Soluble Vitamins
 The B Vitamins
Vitamin B1 (Thiamine)
Vitamin B2 (Riboflavin)
Vitamin B3 or Vitamin P (Niacin)
Vitamin B5 (Pantothenic acid)
Vitamin B6 (Pyridoxine and Pyridoxamine)
Vitamin B7 or Vitamin H (Biotin)
Vitamin B9 or Vitamin M and Vitamin B-c
(Folic acid)
Vitamin B12 (Cyanocobalamin)
78
2/7/2011 S.E.
Functions and sources of
vitamins.
 Vitamin A
Function
Night vision
Healing epithelial cells
Normal development of teeth and bones
Food sources
Breast milk, tomatoes, cabbage,
lettuce/selata/, pumpkins/duba/ Mangoes,
papaya, carrots Liver, kidney, egg yolk,
milk, butter, cheese cream
Deficiency: Night blindness
79
2/7/2011 S.E.
Cont….
 Vitamin D
Function
 Needed for absorption of calcium from
small intestines Calcification of the
skeleton
Food sources
 Ultra violet light from the sun Eggs,
butter, fish Fortified oils, fats and cereals
 Deficiency:
Rickets (a childhood deficiency):
 Osteomalacia (adult rickets):
80
2/7/2011 S.E.
Cont….
 Vitamin K
Function
For blood clotting
Food sources
 Green leafy vegetables Fruits,
cereals, meat, dairy products
Deficiency:
Hemorrhagic disease /bleeding
disorder
81
2/7/2011 S.E.
Cont…
 B complex
Function
Metabolism of carbohydrates, proteins
and fats
Food sources
Milk, egg yolk, liver, kidney and heart
Whole grain cereals, meat, whole bread,
fish, bananas
Deficiency: Beriberi, Pellagra,
megaloblastic anemia etc……
82
2/7/2011 S.E.
Cont….
 Vitamin C
Function
Prevention of scurvy Aiding wound
healing Assisting absorption of iron
Food sources
Fresh fruits (oranges, banana, mango,
grapefruits, lemons, potatoes) and
vegetables (cabbage, carrots, pepper,
tomatoes) Breast milk
Deficiency: Scurvy
83
2/7/2011 S.E.
Minerals
 Minerals are the substances that
people need to ensure the health and
correct working of their soft tissues,
fluids and their skeleton.
 Examples of minerals include calcium,
iron, iodine, fluorine, phosphorus,
potassium, zinc, selenium, and
sodium.
84
2/7/2011 S.E.
Functions and sources of common
minerals.
Minerals Function Food sources
Calcium Gives bones and
teeth rigidity and
strength
Milk, cheese and dairy products
Foods fortified with calcium, e.g.
flour, cereals. eggs, fish cabbage
Iron Formation of
haemoglobin
Meat and meat products Eggs,
bread, green leafy vegetables,
pulses, fruits
Iodine For normal
metabolism of cells
Iodised salt, sea vegetables,
yogurt, cow's milk, eggs, and
cheese Fish; plants grown in iodine
rich soil
Zinc For children to grow
and develop
normally; for wound
healing
Maize, fish, breastmilk, meat,
beans
85
2/7/2011 S.E.
Sources of information
Supplier product manuals
Product labels
Brochures
Internet
Product seminars
86
2/7/2011 S.E.
Storage of health and nutritional
products
 Food preservation includes a variety
of techniques that allow food to be
kept for extended periods of time
without losing nutritional quality and
avoiding the growth of unwanted
microorganisms.
 There are three basic objectives for
the preservation of foods:
87
2/7/2011 S.E.
Cont…
 Prevention of contamination of food
from damaging agents.
 Delay or prevention of growth of
microorganisms in the food.
 Delay of enzymic spoilage, i.e. self-
decomposition of the food by naturally
occurring enzymes within it.
88
2/7/2011 S.E.
Prevention of contamination
(aseptic technique)
This technique simply means to
prevent contamination of the food by
spoilage agents or by contact with
them. The word ‘aseptic’ means free
from harmful bacteria, viruses etc.
The technique requires either using an
artificial covering for the food, or
keeping its natural protective covering
if there is one.
89
2/7/2011 S.E.
Removal or reduction of
microorganisms
 Microorganisms can be physically
removed from food, or their numbers
reduced, by techniques like washing,
trimming, sieving and filtration.
90
2/7/2011 S.E.
The use of high temperature
Heat is one of the oldest methods of
destroying microorganisms in food
processing and preservation.
. Food is also rendered safe by the
application of heat because most
pathogenic microorganisms are
comparatively heat-sensitive.
91
2/7/2011 S.E.
Cont….
 Some of the methods of heat
treatment used for food preservation
are discussed below.
 Cooking/boiling
 Pasteurisation
 Blanching
 Canning
92
2/7/2011 S.E.
The use of low temperature
 Unlike high temperature, cold is not an
effective means of destroying
pathogenic bacteria, viruses and
toxins in foods, but it can retard their
multiplication and metabolic activities.
 No food or food product is rendered
free from microorganisms by low
temperature (by freezing or
refrigeration).
93
2/7/2011 S.E.
Cont…
 Chilling
 Freezing
Drying
Fermentation and pickling
Chemical preservation
Salting
Sugaring
Smoking
94
2/7/2011 S.E.
Thank you
95
2/7/2011 S.E.
HEALTH AND NUTRITION
INFORMATION
 The parents and carers, whose
children become malnourished,
generally come from the poorest
sections of society.
 They frequently have not attended
school, or have only had basic
education.
 Many cannot read of write.
 They are often unaware of the
nutritional needs of children. 96
2/7/2011 S.E.
Key Message
Key Message 1:
A young child should grow well and gain
weight rapidly. From birth to age two,
children should be weighed every month.
If a child has not gained weight for about
two months, something is wrong
Key Message 2:
Breast milk alone is the only food and
drink an infant needs until the age of six
months. After six months, the child needs
a variety of other foods in addition to
breast milk
97
2/7/2011 S.E.
Cont….
Key Message 3:
From the age of six months to two years,
children need to be fed five times a day,
in addition to sustained breastfeeding
Key Message 4:
Children need vitamin A to resist illness
and prevent visual impairments. Vitamin
A can be found in many fruits and
vegetables, oils, eggs, dairy products,
fortified foods, breast milk, or vitamin A
supplements
98
2/7/2011 S.E.
Cont….
Key Message 5:
Children need iron-rich foods to
protect their physical and mental
abilities. The best sources of iron are
liver, lean meats, fish, eggs and iron-
fortified foods or iron supplements •
Key Message 6:
Iodized salt is essential to prevent
learning disabilities and delayed
development in children
99
2/7/2011 S.E.
Cont….
Key Message 7:
During an illness, children need to
continue to eat regularly. After an
illness, children need at least one
extra meal every day for at least a
week
100
2/7/2011 S.E.
Nutritional Assessment
101
2/7/2011 S.E.
Introduction
•What is nutritional assessment?
o Nutritional assessment is the
interpretation of
 anthropometric,
 biochemical (laboratory),
 clinical and
 dietary data
oTo determine whether a person or groups
of people are well nourished or
malnourished (over nourished or under-
nourished).
 There are two methods of assessing Nutritional
status:
1. Direct method
2. Indirect method
Indirect methods
- include assessment of indicators of the food
and nutrition situations in the area/ region of
interest by looking at certain data that are
closely related to malnutrition or which are
aggravated by malnutrition.
- These include:
- Cause specific mortality rates
- Age specific mortality rates
- Health service statistics
- Rate of nutritionally relevant infections
103
2/7/2011 S.E.
Cont’…
-Meteorological data (rainfall data )
- Production pattern and distribution pattern
- Income levels
- Market price of foods
- Predominance of cash crops
104
2/7/2011 S.E.
Direct methods
 Involve the direct measurement of body
dimensions and proportions, determination
of tissue or body fluid concentrations of
nutrients, dietary intake, appearance of the
clinical symptoms and signs related to a
specific nutrient dependent functional
impairment. abbreviated as the ABCDs
 A=Anthropometry
 B= Biochemical/Biophysical
 C= Clinical
 D= Dietary
105
2/7/2011 S.E.
Generalized scheme for development of
nutritional deficiency
106
2/7/2011 S.E.
A. Anthropometric assessments
 Anthropometry comes from two words:
- Anthropo = Human, and
- Metry = measurement.
 Definition: - Anthropometry refers to
measurement of variations of physical
dimension and gross composition of human
body at different levels and degrees of nutrition
(Jelliff, 1966).
107
2/7/2011 S.E.
1. Head circumference (HC)
 Measured using flexible measuring tape around
0.6cm wide to the nearest 1mm.
 It is the circumference of the head along the
supra orbital ridge anteriorly and occipital
prominence posteriorly.
 HC is useful in assessing chronic nutritional
problems in under two children.
 But after 2 years as the growth of the brain is
sluggish it is not useful.
108
2/7/2011 S.E.
2. Length
o A wooden measuring board (also called sliding
board) is used for measuring length.
o It is measured in recumbent position in children
<2 yrs old to the nearest 1mm.
o An assistance of two people is needed in taking
the measurement.
o Measurement is read to the nearest mm.
109
2/7/2011 S.E.
3. Height
 Is measured in children > 2 yrs and adults in
standing position to the nearest 0.1 cm.
 The head should be in the Frankfurt plane
during measurement, knees should be straight
and the heels, buttocks and the shoulders
blades, should touch the vertical surface of the
stadiometer (anthropometer) or wall.
 Stadiometer or portable anthropometer can be
used for measuring.
 There is also a plastic instrument called acustat
Stadiometer that is cheaper than the
conventional Stadiometer.
110
2/7/2011 S.E.
2/7/2011 111
S.E.
2/7/2011 112
S.E.
4. Weight
• Weighing sling (spring balance) also called
salter scale is used for measurement of weight
in children < 2 years.
• In children < 2 years the measurement is
performed to the nearest 10g.
• In adults and children >2 years, beam balance
is used and the measurement is performed to
the nearest 0.1 kg.
113
2/7/2011 S.E.
2/7/2011 114
S.E.
2/7/2011 115
S.E.
2/7/2011 116
S.E.
Indices derived from these
measurements
 What is an index? It is a combination of two
measurements or a measurement plus age.
 The following are few of them: -
- Head circumference-for age
- Weight -for-age
- Height-for age
- Weight for height
117
2/7/2011 S.E.
Meanings of the indices derived from growth
measurements
118
2/7/2011 S.E.
Cont…
Stunting is defined as a low height for
age of the child compared to the
standard child of the same age.
Stunted children have decreased
mental and physical productivity
capacity.
Wasting is defined as a low weight for
the height of the child compared to the
standard child of the same height.
Wasted children are vulnerable to
infection and stand a greater chance
of dying. 2/7/2011 S.E. 119
Anthropometric measurements
used to assess body composition
Measurements of fat-mass (fatness)
Body mass index (BMI) is the weight of a
person in kilogram divided by their height
in meters squired.
Anon pregnant adult is considered to have
a normal BMI when it falls between 18.5-
and 25 kg/meter squired.
If an adult person has a BMI of less than
16 kg/ m2 they will not be able to do much
physical work because they will have poor
energy stores.
2/7/2011 S.E. 120
Cont….
 In addition they will be at increased
risk of infection due to low immunity.
Risk of mortality and morbidity is
related to the nutritional status as
assessed by the BMI.
 If peoples are too fat or too thin their
health is suffer.
2/7/2011 S.E. 121
Bodymassindex(BMI)=Weightinkilogram
Heightinmetersquired
Classifications of overweight,
obesity and normal BMI
Body mass index Classification
< 16 Sever chronic energy deficiency
16.0- 16.9 Moderate chronic energy
deficiency
17.0- 18.49 Mild chronic energy deficiency
18.5- 24.9 Normal
25.0-29.9 Overweight ( pre-obese)
30.0 – 40 Obese
>40 Very obese
2/7/2011 S.E. 122
Measuring fat-free mass
(muscle mass)
Mid upper arm circumference (MUAC)
An accurate way to measure fat free
mass is to measure the Upper arm
circumference (MUAC). is the
circumference of the upper arm at
midway between the shoulder tip and the
elbow tip on the left arm.
The mid arm point is determined by
measuring the distance from the
shoulder tip to the elbow and dividing it
by two.
A low reading indicates a loss of muscle
mass. 2/7/2011 S.E. 123
Measure the MUAC of children: A
special tape is used to the MUAC of a
child. The tape has three colors, with
the red indicates sever acute
malnutrition (SAM), the yellow indicating
moderate acute malnutrition and the
green indicate normal nutritional status.
2/7/2011 S.E. 124
Cut-off points for screening in
the community for SAM and
MAM using MUAC
Target Groups MUAC (in cm) Nutritional status
Children less than five
years
11- 11.9 cm Moderate acute
malnutrition (MAM)
< 11 cm Sever acute malnutrition
( SAM)
Pregnant women
/adult
17-21 cm
Moderate malnutrition
18-21 cm with recent
weight loss
< 17 cm Sever malnutrition
< 18 cm with recent weight
loss
2/7/2011 S.E. 125
Clinical assessment method
Clinical method of nutritional status
assessment involves checking the sign
of nutritional deficiency at specific places
on the body or asking the patient
whether they have any symptoms that
might suggest nutrient deficiency.
The Clinical signs of nutrient deficiency
include: pallor (on the palm of hands or
the conjunctiva of the eye), Bitot’s spot
on the eye, pitting edema on the leg,
sever wasting and goiter on the neck.
2/7/2011 S.E. 126
Checking for bilateral pitting
edema in a child
To determine the presence of edema,
apply normal thumb pressure on both
feet for three seconds (count the
number 101,102,102 in order to
estimate three second without using a
watch).
If a shallow print persists on both feet,
the child has nutritional edema ( pitted
edema ).
2/7/2011 S.E. 127
2/7/2011 S.E. 128
Grades of edema
Depending on the presence of edema on the
different levels of the body it is graded, an
increase in grade indicates the severity of
edema.
0 = no edema
+ = below the ankle (pitting pedal edema)
++ = pitting edema below the knee
+++ = Generalized edema
Bitot’s spot
 Bitot’s spot: is a sign of vitamin A
deficiency, the spots are a creamy
color and appear on whit part of the
eye.
2/7/2011 S.E. 129
Goiter
 Goiter: is swelling on the neck and is
visible sign of iodine deficiency
disease.
2/7/2011 S.E. 130
Visible sever wasting
 To determine the presence of visible
sever wasting for younger than six
months child, you will need to ask the
mother to remove all of the child’s
cloth so you can look at the arms,
thighs, and buttocks for loss of muscle
bulk. Sagging skin and buttock
indicates visible sever wasting as you
can see in the figure.
2/7/2011 S.E. 131
Pallor on the palm of hands or
conjunctiva
 Pallor on the palm of hands or
conjunctiva is a sign of Iron and folic
acid deficiency is estimated to be
responsible for half of all anemia cases
treating Iron deficiency anemia
decreases maternal and child mortality
significantly.
2/7/2011 S.E. 132
clinical signs and symptoms
of nutritional problems
Sign or symptoms Nutritional abnormality
Pale: palms, conjunctiva, tongue
gets tired easily : loss of appetite,
shortness of breath
Anemia :may be due to the
deficiency of iron, folic acid,
vitamin B12, acid, copper protein or
vitamin B6
Bitot’s spot ( whitish patchy
triangular lesions on the side of
the eye
Vitamin A deficiency
Goiter ( swelling on the front of
the neck
Iodine deficiency disorder
2/7/2011 S.E. 133
Biochemical assessment
method
 Biochemical assessment method: It
is one of the nutritional status
assessment methods. This method
involves measurement of either total
amount of nutrient in the body or
concentration of nutrient in body fluid
or organs in the body ( e.g. plasma
albumin, other serum protein level and
hemoglobin).
2/7/2011 S.E. 134
Dietary methods of assessing
nutritional status
 Dietary methods of assessment involves
looking the past or current intake of
nutrients from food by individuals or
group to determine their nutritional
status. You can ask what the family or
the mother and the child have eaten over
the past 24 hours and use this data to
calculate the dietary diversity score.
 Dietary diversity is a measure of the
number of food groups consumed over a
reference period, usually 24 hours.
2/7/2011 S.E. 135
Interpretation of the Indices
 Taking age and sex into consideration,
differences in measurements can be
expressed in a number of ways:
◦ Z-score
◦ Percent of the median
◦ percentiles
2/7/2011 136
S.E.
Classification of nutritional status based
anthropometric indicators
I. Gomez classification (weight-for-age)
(Gomez et al, 1956)
137
2/7/2011 S.E.
2. Well-come classification (weight-for-
age)
(Welcome trust working party 1970)
138
2/7/2011 S.E.
Waterlow Classification ( Waterlow JC,1972)
Index % of NCHS reference Level of Malnutrition
In adults
Height
For
Age
90-94%
85-89%
Mild
Moderate
Sever
Weigh for
Height
80- 89
<70%
< 85%
Stunting
(Chronic
malnutrition)
Wasting
(Acute
Malnutrition)
70-79
Mild
Moderate
Sever
139
2/7/2011 S.E.
Introduction
 What is malnutrition?
◦ Faulty nutrition
◦ Occurs when you take excess or do not get enough calories or nutrients
 Over nutrition
 Under nutrition
 Excessive or inadequate intake of macronutrients and micronutrients could result
in
A. Over nutrition
◦ Excess intake of macronutrients
 Overweight/obesity
 NCDs
◦ Excess intake of micronutrients
 Toxicity
B. Undernutrition
◦ Inadequate intake of macronutrients
 PEM/PCM
◦ Inadequate intake of micronutrients
 VAD, IDA, IDD, ZiD, PEM, etc
 MNDs are the world’s most prevalent and most devastating nutritional
problems 2/7/2011 140
S.E.
 Ethiopia’s main nutritional problems of
public health importance are
◦ Protein Energy (Calorie) Malnutrition
(PEM/PCM)
 Clinical forms (Marasmus, Kwashiorkor, Mixed)
 Milder forms (stunting, underweight, wasting)
◦ Micronutrient Deficiencies (MNDs)
 Iron Deficiency Anemia (IDA)
 Iodine Deficiency Disorders (IDD)
 Vitamin A Deficiency (VAD)
 Zinc Deficiency (ZiD)
◦ But, these are not the only nutritional disorders in
our country.
2/7/2011 141
S.E.
causes of malnutrition
 Multifactorial causes
• Having a number of interwoven factors
operating simultaneously
• Three causes
 Basic causes
 Underlying causes
 Immediate causes
2/7/2011 142
S.E.
143
2/7/2011 S.E.
Protein Energy Malnutrition
 Other terms are
 Multi-deficiency syndrome
 Failure to thrive
 The term PEM/PCM/PED has been used to describe
◦ A range of disorders primarily characterized by growth
failure or retardation in children.
 Growth deficit is catalogued as
◦ Clinical forms
– Marasmus :- Retarded growth with wasting of subcutaneous
fat
– Kwashiorkor;- Growth failure with wasting of muscles and
preservation of subcutaneous fat and pitting type edema
– Mixed: Marasmus-Kwashiorkor (MK):- Edema of kwashiorkor
with wasting of marasmus
◦ Milder forms
 Wasting: Thinness using weight for height (W/H)
 Stunting: Linear growth retardation using height for age (H/A)
 Underweight: A result of wasting and/or stunting , Using
weight for age (W/A) 2/7/2011 144
S.E.
Clinical forms
Marasmus
• Characteristics
• Occurs in children < 2 yrs of age
• Severe deprivation
• Develops slowly
• As the stored fats and tissue proteins are used
up for the production of energy, severe weight
loss and severe muscle wasting are evident
• Low growth (<60%), Low WAZ
• No edema, no fatty liver
• Anxiety, apathy
• Possible good appetite
• Hair thin, dry; skin dry
• “Old Man“ face, wrinkled appearance
• Ribs become prominent and limbs
become very thin as the fat layer
beneath the skin disappears.
2/7/2011 145
S.E.
2/7/2011 146
S.E.
2/7/2011 147
S.E.
2/7/2011 148
S.E.
2/7/2011 149
S.E.
2/7/2011 150
S.E.
Kwashiorkor
• Caused by lack of nutrients
including protein in the diet
• Characteristics
• 1st to 3rd yrs of life
• Edema;
• Enlarged fatty liver
• Low protein, infections
• Rapid onset
• Some weight loss
• Some muscle wasting
• Growth: 60-80%
• Mod low WAZ
• Apathy, misery, irritable
• Loss of appetite
• Hair dry
• Dermatosis (skin lesions)
2/7/2011 151
S.E.
2/7/2011 152
S.E.
2/7/2011 153
S.E.
2/7/2011 154
S.E.
2/7/2011 155
S.E.
2/7/2011 156
Assessment of bilateral pitting edema
S.E.
2/7/2011 157
S.E.
 Marasmus-Kwashiorkor
◦ Common
◦ Combination of the two
◦ Characterized by bilateral edema AND the
child is low weight for height
◦ This combination is often seen in
HIV/AIDS.
2/7/2011 158
S.E.
159
2/7/2011 S.E.
2/7/2011 160
S.E.
Supplementary Suckling
Technique
 This infant is suckling the
breast and also getting the
F100diluted (130ml/kg/d) by
the supplemental suckling
technique.
 Raising or lowering the cup
determines the ease with
which the infant gets the
supplement: for very weak
infants it can be at the level
of the infant’s mouth. If it is
above this level the feed can
go into the child by
siphonage when there is a
danger of aspiration.
2/7/2011 161
S.E.
2/7/2011 162
S.E.
Micronutrient Deficiency Disord
2/7/2011 S.E. 163
(VAD)
Definition
• A comprehensive term that covers all
effects of the deficiency state
including those on health, survival and
vision
• Vitamin A deficiency (VAD) is a disease
caused by lack of adequate vitamin A
intake.
• It is manifested by night blindness,
xerophthalmia, and if deficiency is
2/7/2011 S.E. 165
Bitot’s spots (X1B)
2/7/2011 S.E. 166
Diagnosis
 Diagnosis is based on mainly history and
physical examination
 The patient may have the following symptoms
and signs
 Symptoms:
-Night blindness
-Feeling of dryness in the eye
-Sometimes parents may complain of
whitish plaque in the child’s eye
-Blindness
Signs:
-Poor dark adaptation
-Bitot’s spots
167
2/7/2011 S.E.
Prevention and Control of Vitamin A
deficiency
The elimination of VAD can best be achieved
through a comprehensive approach that
combines strategies.
There are five main types of intervention for
VAD as suggested by WHO:
- Promoting breast milk
- Supplementation
- Food fortification
- Dietary modification
- Infection control
168
2/7/2011 S.E.
Iodine Deficiency Disorder (IDD)
Definition
 Iodine Deficiency Disorders refer to a spectrum
of health consequences resulting from
inadequate intake of iodine.
 The adverse consequences of iodine deficiency
lead to a wide spectrum of problems ranging
from abortion and still birth to mental and
physical retardation and deafness, which
collectively known as Iodine Deficiency
Disorders (IDDs).
169
2/7/2011 S.E.
Aetiology
 Iodine deficiency occurs when either iodine
intake is inadequate or the presence of
goitrogens (anti thyroid) in the diet is high.
 The erosion of soils in areas with river due
to loss of vegetation from clearing results in a
continued and increasing loss of iodine from
the soil. Groundwater and foods grown in these
areas lack iodine.
170
2/7/2011 S.E.
Clinical Features (Signs and
Symptoms)
Fetus
◦ Abortion
◦ Congenital anomalies
◦ Still birth
◦ Increased perinatal mortality
◦ Endemic cretinism (physical &mental
stunting to hypothyroidism)
171
2/7/2011 S.E.
Neonate
◦ Neonatal goiter
◦ Neonatal hypothyroidism
◦ Endemic mental retardation
Child and adolescent
◦ Goiter
◦ Impaired mental development and function
◦ Hypothyroidism
◦ Retarded physical development
172
2/7/2011 S.E.
Adult
◦ Hypothyroidism
◦ Impaired mental function
Most important consequences of the
spectrum of IDD are:
◦ Goiter
◦ Mental retardation
◦ Hypothyroidism
◦ Cretinism
◦ Increased morbidity and mortality of infants
and neonates
173
2/7/2011 S.E.
Diagnosis
A. History, physical examination
-Thyroid size
B . Lab
Iodine level is best assessed by measurement
of
- Urinary iodine
- Serum T3, T4, TSH and Thyroglobulin
- Saliva /serum iodine ratio
174
2/7/2011 S.E.
Cut off points for iodine deficiency
175
2/7/2011 S.E.
Prevention and Control of IDD
 The main strategies to control and eliminate
iodine deficiency are:
1. Universal iodization of salt for human
and animal consumption
 Iodized salt is both a preventive and
corrective measure for iodine deficiency
and is the most effective, low cost, long-
term solution to this major public health
problem.
 Iodized salt should be used on a daily basis
in an iodine deficient environment and the
daily requirement of iodine for adults is 150
micrograms.
176
2/7/2011 S.E.
2. Supplementation of iodine capsules to
populations in highly endemic areas
 As a short-term strategy in highly endemic
areas, Lipiodol (iodized oil capsules), should
be distributed on a one-time basis to
individuals.
Dosage is:
- One capsule for pregnant women and children
under 5
- Two capsules for women of reproductive age
and children 5 to 14 years of age.
177
2/7/2011 S.E.
Iron Deficiency Anaemia (IDA)
Definition
 Anaemia is defined as a reduction of the red
blood cell volume or haemoglobin concentration
below the level considered normal for the
person's age/sex.
Epidemiology
 Iron deficiency anaemia is the most prevalent
nutritional problem in the world today, affecting
more than 700 million persons.
 It is considerably more prevalent in the
developing than in the developed world (36% or
about 1.4 billion persons out of an estimated
population of 3.8 billion in developing countries,
versus 8% or just under 100 million persons
out of an estimated population of 1.2 billion in
developed countries). 178
2/7/2011 S.E.
 According to EDHS 2011 more than half
(54%) of Ethiopian children age 6-59 months
and 27 % of women age 15-49 are anaemic.
Aetiology
 Iron deficiency anaemia can be caused by:
1. Deficient iron content of the food.
2. Deficient absorption of iron.
-This is due to poor dietary practice like, less
consumption of diets rich in vitamin C
which enhance iron absorption, drinking
coffee and tea immediately after meal which
inhibits iron absorption.
179
2/7/2011 S.E.
3. Gastrointestinal tract operation. It may occur
also in chronic malabsorption states or
diseases and consumption of antiacids,
fibrous diet and heavy metals like calcium,
zinc, magnesium.
4. Deficient transport: A decrease in transferrin
(iron-binding protein).
5. Abnormal loss of iron: It is commonly caused
by loss of circulating red cells through
haemorrhage, excessively heavy menstruation
or due to parasites like hookworm and
schistosomiasis.
6. Increased physiologic requirements: This
occurs primarily in children during active 180
2/7/2011 S.E.
Clinical Features
Symptoms
 Tiredness, weakness or fainting, fatigue,
head ache
 Breathlessness (shortness of breath),
nausea, poor appetite
 Exercise intolerance, tinnitus (ringing in the
ear)
 Blurred vision , palpitation (uncomfortable
awareness of ones heart beat).
 Excessive desire to eat unusual substances
(pica) such as clay or ice.
181
2/7/2011 S.E.
Signs
 Paleness (skin and mucus membranes)
 Edema in chronic and sever cases
 Irritability
 Poor growth and development in children
Diagnosis of anaemia
 Anaemia can be identified using the following
methods:
 History: Detect clinical symptoms of anaemia,
dietary history.
 Physical Examination: Examine mucous
membrane (mouth, conjunctiva), palm and
finger nails.
182
2/7/2011 S.E.
 Laboratory Examination: Measure
haemoglobin or hematocrit.
 The haemoglobin levels indicating anaemia are
shown in the following table.
183
2/7/2011 S.E.
Assessment of Iron Nutritional
Status
• Iron nutritional status can be assessed
by the following biochemical and
hematological tests
– Hemoglobin
– Hematocrit
– Serum iron concentration
– Total iron binding capacity
– Transferrin saturation
– Protoporphyrin
– Serum ferritin
– Transferrin receptors
2/7/2011 S.E. 184
Public health implications of IDA
◦ IDA is associated with
 Poor reproductive performance
 High proportion of maternal death (10 – 20%
of total deaths)
 High incidence of LBW (< 2500 g at birth)
 Intrauterine malnutrition
 Impaired scholastic performance (impaired
psychomotor development and intellectual
performance)
 Decreased resistance to infection
 Reduction of work capacity/productivity
2/7/2011 S.E. 185
Prevention and Control
 Early detection and treatment of underlying
causes
 Assessment and appropriate management of
high risk groups:
E.g. - Pregnant women
- Pre-term infants
- Lactating mothers
- People with malnutrition
186
2/7/2011 S.E.
Preventing the underlying causes of
anaemia
Prevention of malaria
Prevention of parasites like hook worm
infestation
Prevention of chemical poisoning, like
lead poisoning.
Safety measures for the prevention of
trauma causing blood loss.
Other public health measures such as:
Birth spacing, immunization, improved
water supply and sanitation, dietary
improvement, food fortification,
supplementation with iron tablets.
187
2/7/2011 S.E.
Nutritional intervention
Definition- It is a corrective measure that is
undertaken to reduce or avoid the occurrence of
over all malnutrition or specific nutrient
deficiency or excess.
Based on the underlying cause of the
nutritional problem, the nutritional interventions
can vary.
1. Nutrition education and promotion of
horticultural activities (dietary
diversification)
 It promotes consumption of different varieties of
foods.
 Nutritional education needs to focus on the
promotion of consumption of different diversities
of foods.
 Problems that may face this approach
 The food promoted must be
- Culturally accepted
- Consumed by the vulnerable
- Target nutrients must be absorbed from
189
2/7/2011 S.E.
2. Dietary modification
 Aimed at modifying the energy, protein, and
micronutrient content of foods especially
weaning foods, and other infant formulas.
 e.g. – The energy and protein content of a food
can be improved by fermenting or germinating
adding a powder flour.
 Other methods employed to improve the
micronutrient contents of a food include.
 Enrichment- addition of a nutrient, which is
originally present in the food, above the level
found naturally.
 Restoration- Replacement of a nutrient lost
during harvest, storage or processing.
190
2/7/2011 S.E.
Cont’…
 Standardization- to compensate for the natural
variation of foods grown in different geographic
areas in their contents of a nutrient.
 Fortification- an addition of a nutrient in a food
that is not naturally present in order to enhance
the consumption of the target nutrient.
 Supplementation- administration of nutrients
in the form of tablets, capsule, or injection.
191
2/7/2011 S.E.
3. Economic approaches
A. Food-For-Work (FFW) Projects
 In these projects, food is given as full or partial
payment of wages to people working in land
improvement or community development
projects.
 This strategy is very effective during food
shortages, particularly when it targets the poor.
 It allows able -bodied individuals to earn food
rather than become reliant on food handouts.
192
2/7/2011 S.E.
B. Food stamps
 A sort of officially stamped ticket will be given to
the poor which they could use for buying food
from restaurant etc and this will be paid later on
by the government.
Advantage
- They are preventive.
Disadvantage
 They are highly targeted to urban people.
 They have high administrative cost.
 The system can be abused.
193
2/7/2011 S.E.
C. Income-Generating Projects (IGP)
 Relief agencies may issue small loans and
training to the most affected families in order to
provide them with alternative sources of income
once food aid is phased out.
 These projects should have a direct impact on
improving food production, e.g., digging wells,
raising poultry and small livestock, fishing or
milling projects.
194
2/7/2011 S.E.
4. ENA (Essential Nutrition Actions)
 Over past 30-40 years nutrition interventions
were often…
not integrated
viewed as separate vertical programs
in competition with one another
not action oriented(non-specific)
focused only on GM/P activities
195
2/7/2011 S.E.
ENA…
 In the past 10 years growing consensus is that
nutrition interventions need to be…
 integrated conceptually& programatically
- infant & young child feeding
- maternal nutrition
- micronutrients
 based on proven impact
 action oriented with clear guidance « Who
should take what action when »
 7 action areas
196
2/7/2011 S.E.
197
2/7/2011 S.E.
198
2/7/2011 S.E.
199
2/7/2011 S.E.
200
2/7/2011 S.E.
201
2/7/2011 S.E.
202
2/7/2011 S.E.
203
2/7/2011 S.E.
204
2/7/2011 S.E.
205
2/7/2011 S.E.
206
2/7/2011 S.E.
207
2/7/2011 S.E.
Infant feeding options in the context of
HIV/AIDS
Group1: Pregnant women whose HIV
status is unknown or who have been
tested and are HIV negative:
 As before…
- Exclusive breastfeeding 0 to 6 months
- Introduction of Complementary Feeding at 6
months
- Continued breastfeeding to 24months+
208
2/7/2011 S.E.
Group 2: Pregnant women who have been
tested and are HIV positive:
 Ideally a woman should be supported through
counseling to make an informed choice on how
to feed her infant to reduce risk of HIV
transmission.
 Provision of ARVs to reduce transmission
209
2/7/2011 S.E.
210
2/7/2011 S.E.
When replacement feeding IS NOT
acceptable, feasible, affordable,
sustainable and safe…
Option 1: Safer breastfeeding
Option 2: Heat treating breast milk
Option 3: Wet nursing by HIV negative woman
Option 4: Early cessation of breastfeeding
211
2/7/2011 S.E.
212
2/7/2011 S.E.
2/7/2011 213
S.E.
2/7/2011 214
S.E.

2- Nutritional Assmalnutritin and intervention.pptx

  • 1.
    Mizan –Aman College ofHealth Sciences Department of midwifery Human Nutrition For level III MW Students By: Sebsibe E. (Bsc, PHO)
  • 2.
    objectives At the endof this unit, you will be able to: Define common terms used in nutrition List common forms of malnutrition Describe the six nutritional constituents Describe the function of the six nutritional constituents Identify nutritional deficiencies 2/7/2011 S.E. 2
  • 3.
    Pretest questions 1. Whatis nutrition? 2. What is malnutrition? 3. How do you classify carbohydrates? 4. What are the functions of protein? 5. What are the food sources of Vitamin A? 2/7/2011 S.E. 3
  • 4.
    Introduction to Nutrition Humannutrition  The science of foods, the nutrients and the substances there in, their action, interaction and balance in relation to health and diseases.  Nutrition science is the area of knowledge regarding the role of food in the maintenance of good health.  Thus nutrition is the study of food at work in our body“ (The Council On Food And Nutrition Of The American Medical Association). 4 2/7/2011 S.E.
  • 5.
    Dietetics It is Science/art of applying the principles of nutrition in feeding . Food Anything which is edible as defined based on specific culture, religion, ethnicity, etc. Diet It is the sequence of meals in a day. It is concerned about the eating style of individuals or a group. Nutrient: - is an active ingredient in the food that play specific structural or functional role in the body’s lively activities. 5 2/7/2011 S.E.
  • 6.
    Macronutrients Are nutrients thatare required by our body in larger quantities on a daily basis and need to be transformed in to smaller units by the body in order to give essential functions in the body in process. E.g. carbohydrates, fats & lipids, proteins Micronutrients Are nutrients that are required in small quantities by the body and perform essential physiological & structural functions. e.g. – Vitamins, minerals 6 2/7/2011 S.E.
  • 7.
    Malnutrition The shortage ofnutrient leads to malnutrition of one form or another. On other hand; The excessive consumption of some nutrients may also be harmful to the body and lead to metabolic disorders or in the case of excessive consumption of fat and carbohydrate to obesity. 7 2/7/2011 S.E.
  • 8.
    GROWTH AND DEVELOPMENT Definitions  Growth:Is the process of growing – the increase in size and development of a living organism from a simple to a more complex form or from its earliest stage of being to maturity.  Development: implies an increase in skill and complexity of function. 8 2/7/2011 S.E.
  • 9.
    Factors Affecting growth Genetic factors  Neural control of growth  Hormonal influence  Nutrition  Environmental and social factors 9 2/7/2011 S.E.
  • 10.
    Assessment of Growthand Development  Disease in childhood affects growth and development.  Measurement of growth and development is therefore an essential skill to monitor the health of the individual child and the community at large. 10 2/7/2011 S.E.
  • 11.
    Assessment of Growth The most powerful tool in growth assessment is the growth chart  The growth chart provides most of the information needed to assess growth.  The standard charts are based on data collected from 1963 to1975 by the National Centres for Health Statistics (NCHS) on weight for age, height for age, head circumference for age, and weight for height 11 2/7/2011 S.E.
  • 12.
     Separate chartsare provided for boys and girls  Each chart is composed of seven percentile curves  normal values for age are represented between the fifth and ninety-fifth percentiles, and the fiftieth percentile represents the median (standard) value.  In children under 5 years old an additional chart (Harvard standard) is used to measure weight for age as percentages of the median or standard value in the NCHS curve. 12 2/7/2011 S.E.
  • 13.
    Developmental Assessment Assessment ofdevelopment helps to identify children with developmental delay. For this purpose the following developmental assessments may be used. Gross motor development Manipulation (fine motor development) Cognition and social skill Language 13 2/7/2011 S.E.
  • 14.
    Developmental milestones in the1st yr of life Milestone Average age of Attainment (in months) Developmental implication Gross motor Head steady in sitting 2 Allows more visual intention Pull to sit, no head lag 3 Muscle tone Hands together in mid line 3 Self discovery Sits without support 6 Increasing exploration Rolls back to stomach 6.5 Truncal flexion, risk of falls Walks alone 12 Exploration, control of proximity to parents Runs 16 Supervision more difficult 14 2/7/2011 S.E.
  • 15.
    15 Fine motor Grasps rattle3.5 Object use Reaches for object 4 Visual motor coordination Transfers objects 5 Comparison of objects Thumb -finger grasp 8 Able to explore small object Scribbles 13 Visual-motor coordination Communication and Language Smile in response to face, voice 1.7 More active social participation Monosyllabic babble 6 Experiment sound Follows one step command gesture 7 non verbal communication 2/7/2011 S.E.
  • 16.
    Follows one stepout gesture 10 Verbal receptive language Speaks 1st real word 12 Beginning of labeling Speaks 4-6 word 15 Acquisition of object & personal name Speaks 10-15 word 18 Acquisition of objects & personal name Speaks two word sentences 19 Beginning of grammatization Cognitive Stares momentarily at spot where object disappeared 2 Lack of objective permanence Uncovers toy (after seeing i.e. hidden) 8 Object permanence Egocentric pretend play 12 Beginning symbolic thoughts 16 2/7/2011 S.E.
  • 17.
    Consequences of malnutrition The enormous consequences of malnutrition are often not appreciated because they may be hidden.  Often there are no obvious signs, and the victims themselves are silent and not aware of the problem.  considerable damage to the developing child has been done and satisfactory recovery becomes less likely. 17 2/7/2011 S.E.
  • 18.
    Cont…..  Well-nourished womenare likely to be fit and healthy and able to look after their family well.  The outcomes of pregnancy and lactation are improved when the woman is healthy herself.  Just as malnutrition has many causes, its effects are also multidimensional in nature. 18 2/7/2011 S.E.
  • 19.
    Cont… 1. Increased riskof disease and death 2. Low productivity of the malnourished individuals 3. Poor school performance and attendance 4. Poverty perpetuation (a vicious circle) 5. Intergenerational cycle of malnutrition 19 2/7/2011 S.E.
  • 20.
    Causes of malnutrition 20 Causescould be categorized as: Immediate causes Underlying causes, and Basic causes 1/ Immediate causes of malnutrition Poor diet Disease 2/7/2011 S.E.
  • 21.
    Cont…. 2/ Underlying causesof malnutrition Family food shortage Inadequate care of children and women Unhealthy environment and poor health services 3/ Basic causes of malnutrition Four major factors I. Political factors II. Cultural factors III. Environmental or natural disasters IV. Social factors 21 2/7/2011 S.E.
  • 22.
    Health and nutritional products Thereare six main classes of nutrients that the body needs. These are  Carbohydrates  Protein  Lipid  Vitamins  minerals  Water 22 2/7/2011 S.E.
  • 23.
    Classification of essential nutrients nutrients are categorized into two groups. These are 1. Macronutrients, which should be consumed in fairly large amounts, and 2. Micronutrients, which are only required in small amounts. 23 2/7/2011 S.E.
  • 24.
  • 25.
    What are macronutrients? Macronutrients are nutrients that provide calories or energy.  Since “macro” means large, macronutrients are nutrients needed in large amounts. There are three macronutrients: ◦ Carbohydrate ◦ Protein ◦ Fat 25 2/7/2011 S.E.
  • 26.
    Macronutrients contribute tothe energy pool of the body 26  Carbohydrates  (45-65%) Energy Pool of the body (100%) Fats 20% - 35% Proteins (10% - 35%) 2/7/2011 S.E.
  • 27.
    Cont’…  While eachof these macronutrients provides calories, the amount of calories that each one provides varies.  Carbohydrate provides 4 kilocalories per gram.  Protein provides 4 kilocalories per gram.  Fat provides 9 kilocalories per gram.  Besides carbohydrate, protein, and fat the only other substance that provides calories is alcohol. Alcohol provides 7 kilocalories per gram.  Alcohol, however, is not a macronutrient because we do not need it for survival and it interferes with the body’s growth, maintenance, and repair. 27 2/7/2011 S.E.
  • 28.
    Carbohydrates • Carbohydrates arecalled carbohydrates because they are essentially hydrates of carbon (i.e. they are composed of carbon and water and have a composition of (CH2O)n. • The major nutritional role of carbohydrates is to provide energy and digestible carbohydrates provide 4 kilocalories per gram. • No single carbohydrate is essential, but carbohydrates do participate in many required functions in the body. 28 2/7/2011 S.E.
  • 29.
  • 30.
     Simple sugars Monosaccharides  Three common sugars share the same molecular formula: C6H12O6. Because of their six carbon atoms, each is a hexose.  They are:  1. Glucose - "blood sugar", the immediate and major source of energy for cellular respiration. • Also called as dextrose or grape sugar. • It is the end product of digestion of starch, sucrose, maltose and lactose. • Found in fruits, vegetables, honey, corn syrup and molasses • After meal glucose is converted to glycogen and excess is converted to triaglycerol and stored. 30 2/7/2011 S.E.
  • 31.
     2. Galactose- a sugar in milk (and yoghurt), • It is not found free in nature • Produced in the body during digestion of lactose • Also called as milk sugar • During lactation glucose is converted to galactose so that milk can be produced.  3. Fructose - a sugar found in fruits and honey. • It is the sweetest of all sugars and also known as levulose or fruit sugars. • It is produced during digestion of sucrose and is found in nectar of flowers, honey and molasses. 31 2/7/2011 S.E.
  • 32.
    Disaccharides  Three commondisaccharides:  All sugars are very soluble in water because of their many hydroxyl groups.  Although not as concentrated a fuel as fats, sugars are the most important source of energy for many cells. 32 2/7/2011 S.E.
  • 33.
     1. Sucrose— common table sugar = glucose + fructose • Is made up of one glucose unit and one fructose unit. • Found in molasses, sorghum and corn syrups • Also called as table sugar and used at home daily.  2. Lactose — major sugar in milk = glucose + galactose • Only found in milk • When hydrolyzed yields galactose and glucose. 33 2/7/2011 S.E.
  • 34.
     3. Maltose— product of starch digestion = glucose + glucose • Has two glucose units. • Maltose(malt sugar) is found in sprouts and sweetening agents • Is formed in the body as an intermediate product of starch digestion. • Is found in beer, infant formulas and malted breakfast cereals 34 2/7/2011 S.E.
  • 35.
    Complex carbohydrates (polysaccharides)  Oligosaccharides Polysaccharides ◦ Starch ◦ Glycogen ◦ Dietary fiber =Nonstarch polysaccharide (cellulose, hemicelluloses, pectins, gums, and mucilages as well as the nonpolysaccharides lignins, cutins, and tannins). o Complex CHO that contain as many as 60000 CHO molecules. o Starch, glycogen and cellulose are important in nutrition. 35 2/7/2011 S.E.
  • 36.
    Starch Major storage carbohydratein higher plants. Glycogen  Major storage carbohydrate in animals Cellulose • Comprises of 50% or more of all carbon found in vegetation. • Structural constituent of plant cell wall. • Humans do not have the enzymes to digest cellulose. • Also called dietary fiber or roughage. 36 2/7/2011 S.E.
  • 37.
    FUNCTIONS OF CARBOHYDRATES: Energy supply:  To meet immediate energy needs as glucose  The CNS is entirely dependent on glucose for energy.   Protein sparing action:  When CHO and fat content of diet is low more protein is used for energy at expense of tissue building and maintenance(weight reduction)  Helping the body use fat effectively:  Prevents the occurrence of ketosis due to mobilization of lipids. 37 2/7/2011 S.E.
  • 38.
     Lactose enhancescalcium absorption:  As component of body substances and compounds  as heparin, nervous tissue, ribose and component in the liver that destroys toxins.  Encouraging the growth of useful bacteria:  Fructose oligosaccharides selectively promote the growth of important bacteria like lactobacillus and bifido bacteria.  Probiotic: bacteria that benefit the host by acting upon the food  Prebiotic: Food stuffs that selectively stimulate the growth of essential bacteria ex. Fructose, oligosaccharides. 38 2/7/2011 S.E.
  • 39.
     Promoting normalfunctioning of the lower intestinal tract:  Dietary fiber promote peristalsis and normal movement of the food and waste products along the GI tract and prevent occurrence of diseases.  Improving the palatability of food and drink:  Sucrose is used as sweetening agent and added to foods like biscuits, soft drink, coffee, tea etc.  Texturing and preservatives:  Starch and soluble fiber are used in food industry to improve texture 39 2/7/2011 S.E.
  • 40.
     FOOD SOURCEOF CARBOHYDRATES:  FREE SUGARS: Syrups, cereal grains, dried fruits, pasta, candies, pastries/kyk/ and breads and fruits like banana and sweet potato.(high CHO density)  Oligosaccharides(medium CHO density): garlic, onions, legumes, fruits and molasses.  Polysaccharides: fruits, vegetables, cereals and legumes, whole grain cereals.  high carbohydrate sources: bread, cereals, rice, pasta, vegetables  Low sources-egg, fish, poultry/honey meat/, cheese, meat, milk, animal and vegetable fats contain CHO. 40 2/7/2011 S.E.
  • 41.
     RECOMMENDED DAILYALLOWANCE: • Daily intake from food should not contribute more than 50% of total daily requirement. • To prevent ketosis 50 – 100 gms of CHO intake is recommended. • Excess CHO consumed can be converted to lipids and get stored leading to obesity. • Dental caries is the commonest problem for frequent frank sugar consumers. • Decreased sugar intake may lead to utilization of body’s protein pool leading to cachexia. 41 2/7/2011 S.E.
  • 42.
    Proteins and AminoAcids  About 10–35% of calories should come from protein.  Proteins are needed in our diets for growth (especially important for children, teens and pregnant women) and to improve immune functions.  They also play an important role in making essential hormones and enzymes, in tissue repair, preserving lean muscle mass, and 42 2/7/2011 S.E.
  • 43.
    Cont….  Pregnant womenneed protein to build their bodies and that of the babies and placentas,  To make extra blood and for fat storage. Breastfeeding mothers need protein to make breast milk.  supplying energy in times when carbohydrates are not available. 43 2/7/2011 S.E.
  • 44.
    Classification of proteins Essential – must be consumed in the diet  Nonessential– can be synthesized in the body  Conditional Amino acids– cannot be synthesized due to illness or lack of necessary precursors ◦ Premature infants lack sufficient enzymes needed to create arginine 44 2/7/2011 S.E.
  • 45.
  • 46.
  • 47.
    Best Sources ofProtein 47 2/7/2011 S.E.
  • 48.
    Functions of protein ◦Provide structural and mechanical support ◦ Maintain body tissues ◦ Functions as enzymes and hormones ◦ Help maintain acid base balance ◦ Transport nutrients ◦ Assist the immune system ◦ Serve as a source of energy when necessary 48 2/7/2011 S.E.
  • 49.
    Nitrogen Balance Definition: Nitrogenbalance refers to the situation where nitrogen intake from food is equal to nitrogen excretion.  This occurs in a healthy non-growing adult person taking adequate amount of energy from carbohydrates.  In some situations Nitrogen excretion may be greater than nitrogen intake, this is called negative nitrogen balance.  Other situations where nitrogen excretion is less than nitrogen intake from food are called positive nitrogen balance. 49 2/7/2011 S.E.
  • 50.
    Factors affecting nitrogen equilibrium 50 Nitrogenintake = Nitrogen Excretion (nitrogen balance) ? Positive Nitrogen balance -Pregnancy -Lactation -Growth -Recovery from Illness (Convalescent stage) Negative Nitrogen balance 1. Starvation 2. Devastating illness 3. Protein energy malnutrition 2/7/2011 S.E.
  • 51.
  • 52.
    Protein requirement  Proteinintake recommendations ◦ 10–35% of total daily kilocalories ◦ Adults over 18  0.8 g/kg daily  American College of Sports Medicine, the American Dietetic Association, and other experts advocate ◦ 50–100% more protein for competitive athletes participating in endurance exercise or resistance exercise ◦ Typically this population eats more and therefore gets additional protein 52 2/7/2011 S.E.
  • 53.
    Eating Too MuchProtein  Risk of heart disease  Risk of kidney stones  Risk of calcium loss from bones  Risk of colon cancer  Displacement of other nutrient-rich, disease preventing foods 53 2/7/2011 S.E.
  • 54.
    Eating Too LittleProtein  Protein-energy malnutrition (PEM) ◦ Protein is used for energy rather than its other functions in the body ◦ Other important nutrients are in short supply ◦ More prevalent in infants and children  17,000 children die each day as a result 54 2/7/2011 S.E.
  • 55.
    Types of PEM:Kwashiorkor Severe protein deficiency ◦ Generally result of a diet high in grains and deficient in protein Symptoms range from ◦ Edema in legs, feet, and stomach ◦ Muscle tone and strength diminish ◦ Hair is brittle and easy to pull out ◦ Appear pale, sad, and apathetic ◦ Prone to infection, rapid heart rate, excess fluid in lungs, pneumonia, septicemia, and water and electrolyte imbalances (Image from http://www.thachers.org/pediatrics.htm) 55 2/7/2011 S.E.
  • 56.
    Types of PEM:Marasmus Results from a severe deficiency in kilocalories ◦ Frail, emaciated appearance ◦ Weakened and appear apathetic ◦ Many cannot stand without support ◦ Look old ◦ Hair is thin, dry, and lacks sheen ◦ Body temperature and blood pressure are low ◦ Prone to dehydration, infections, and unnecessary blood clotting 56 2/7/2011 S.E.
  • 57.
    Types of PEM:Marasmic Kwashiorkor  Chronic deficiency in kilocalories and protein ◦ Have edema in legs and arms ◦ Have a “skin and bones” appearance ◦ With treatment the edema subsides and appearance becomes more like someone with marasmus 57 2/7/2011 S.E.
  • 58.
    Fats and oils 58 Fatsand oils are concentrated sources of energy and so are important nutrients for young children who need a lot of energy-rich food.  Fats can also make meals more tasty and satisfying. Fat is found in meat, chicken, milk products, butters, creams, avocado, cooking oils and fats, cheese, fish and ground 2/7/2011 S.E.
  • 59.
    Classification of fats Fats are classified into saturated and unsaturated fats.  The classification is important to enable you to advise your community about which fats can be consumed with less risk to people’s health.  Saturated fats are not good for a person’s health. 59 2/7/2011 S.E.
  • 60.
    Saturated fats areusually solid at cool temperatures. Eating too much saturated fat is not good for a person’s health, as it can cause heart and blood vessel problems. Unsaturated fats are usually liquid at room temperature. These types of fats are healthy fats. Examples include fats from fish, oil seeds (sesame and sunflower), maize oil and ground nut oil and breast milk. NOTE - as a general rule, plant sources of fats are better for a person’s health than the animal sources, because animal fats contain more saturated fats. 60 2/7/2011 S.E.
  • 61.
    Food Sources forFats  There are three main types of fat, saturated fat, unsaturated fat, and trans fat. High Risk to CHD ◦ Saturated fat (found in foods like meat, butter, lard, and cream) and ◦ trans fat (found in baked goods, snack foods, fried foods, and margarines) have been shown to increase your risk for heart disease. Low Risk to CHD ◦ Unsaturated Fat (PUFAS & MUFAS) (found in foods like olive oil, avocados, nuts, and canola oil, vegetable oils, fish) *Replacing saturated and trans fat in your diet with unsaturated fat has been shown decrease the risk of developing heart disease. 61 2/7/2011 S.E.
  • 62.
    FUNCTIONS  Concentrated sourcesof energy i.e. 9 calories/gram  Insulator of heat under the skin  Improves the palatability of food  Helps for absorption of fat soluble vitamins  Supports the internal organs  Reserve storage form of energy  Myelin sheath of nerves 62 2/7/2011 S.E.
  • 63.
    Dietary Recommendations  Totalfatty acid intake should average 30 % of dietary energy. Of this, 10 % of total energy should be provided by saturated fatty acids,  12 % by monounsaturated fatty acids, 6 % from polyunsaturated fatty acids and 2 % from trans fatty acids. 63 2/7/2011 S.E.
  • 64.
    Cont..  Excessive intake:results in positive energy balance and obesity, complications like HTN, DM and atherosclerosis  Inadequate intake- results in EFA deficiencies manifested by itching, skin and another health problems. Decrease growth and development of infant an young children 64 2/7/2011 S.E.
  • 65.
    Water  A 50kg adult contains about 31 liters of water and a one year old, 10 kg child contains nearly 8 liters of water.  Almost every part of the body contains large amounts of water.  People can live without solid food for a few weeks, but we cannot live without water for more than a few days.  An adult needs about 2–3 litres of water each day. That is why giving drinks are so important when people lose a lot of water, such as when they have diarrhoea. 65 2/7/2011 S.E.
  • 66.
    Water is essentialfor life.  For the body to make cells and fluids such as tears, digestive juices and breast milk.  For the body to make sweat for cooling itself.  For essential body processes — most take place in water.  For keeping the lining of the mouth, intestine, eyelids and lungs wet and healthy.  For the production of urine, which carries waste from the body. 2/7/2011 S.E. 66
  • 67.
    Quiz 1. One ofthe following is major source of energy pool A. Proteins B. fats C. carbohydrates D. lipid 2. The sweetest of all sugar A. Maltose B. sucrose C. fructose D. glucose 3. Over consumption of CHO can result the following health problem EXCEPT 2/7/2011 S.E. 67
  • 68.
    Cont.. 4. Nonessential aminoacids must consumed in the diet A. True B. False 5. The most abundant source of proteins are A. Fruit B. vegetable C. meat D. cereals 6. Eating too much protein can result A. Kwashiorkor B. marasmus C. heart disease D. all 2/7/2011 S.E. 68
  • 69.
    Cont… 7. Write threefunction of carbohydrate A.------------------------- B. ------------------------- C. ------------------------ 8. Write three function of protein A.------------------------- B. ------------------------- C. ------------------------ 2/7/2011 S.E. 69
  • 70.
    cont…. 9. --------- fatsare not good for a person’s health 10. Animal sources of fats are better for a person’s health than the plant sources A. False B. True 2/7/2011 S.E. 70
  • 71.
  • 72.
    Vitamins Essential organic substances(contain carbon) ◦ Not synthesized ◦ Inadequate synthesis  Yield no energy, but facilitate energy- yielding chemical reactions  If absent from a diet, it will produce deficiency signs and symptoms 72 2/7/2011 S.E.
  • 73.
    Body Needs Vitaminsfor Normal Function Growth Maintenance Reproduction 73 2/7/2011 S.E.
  • 74.
    Vitamin Classification  Fat-soluble vitamins – Dissolve in substances such as ether and benzene but not readily in water – Include vitamins A, D, E, and K   Water-soluble vitamins – Vitamins that dissolve in water – Include B vitamins and vitamin C 74 2/7/2011 S.E.
  • 75.
    Fat vs. WaterSoluble Vitamins Characteristics Water soluble Fat soluble Examples All the eight B complexes and vitamin C Vitamins A, D, E and K Solubility Soluble in water Soluble in lipids and organic compounds (chloroform, benzene, ether, etc) Storage Not stored very much Stored in different organs Absorption Directly With lipids through the lymphatic system Transport in the blood Freely Need to be bound to carrier protein 75 2/7/2011 S.E.
  • 76.
    Cont… Deficiency Develop followingacute shortages Deficiency doesn’t develop following acute shortage of the vitamins •Slow to develop deficiency Fat mal absorption syndrome (steatorhea) Does not result in their deficiency Results in their deficiency Toxicity upon intake of mega doses (e.g. During treatment) Unlikely to occur Likely to occur 76 2/7/2011 S.E.
  • 77.
  • 78.
    Water Soluble Vitamins The B Vitamins Vitamin B1 (Thiamine) Vitamin B2 (Riboflavin) Vitamin B3 or Vitamin P (Niacin) Vitamin B5 (Pantothenic acid) Vitamin B6 (Pyridoxine and Pyridoxamine) Vitamin B7 or Vitamin H (Biotin) Vitamin B9 or Vitamin M and Vitamin B-c (Folic acid) Vitamin B12 (Cyanocobalamin) 78 2/7/2011 S.E.
  • 79.
    Functions and sourcesof vitamins.  Vitamin A Function Night vision Healing epithelial cells Normal development of teeth and bones Food sources Breast milk, tomatoes, cabbage, lettuce/selata/, pumpkins/duba/ Mangoes, papaya, carrots Liver, kidney, egg yolk, milk, butter, cheese cream Deficiency: Night blindness 79 2/7/2011 S.E.
  • 80.
    Cont….  Vitamin D Function Needed for absorption of calcium from small intestines Calcification of the skeleton Food sources  Ultra violet light from the sun Eggs, butter, fish Fortified oils, fats and cereals  Deficiency: Rickets (a childhood deficiency):  Osteomalacia (adult rickets): 80 2/7/2011 S.E.
  • 81.
    Cont….  Vitamin K Function Forblood clotting Food sources  Green leafy vegetables Fruits, cereals, meat, dairy products Deficiency: Hemorrhagic disease /bleeding disorder 81 2/7/2011 S.E.
  • 82.
    Cont…  B complex Function Metabolismof carbohydrates, proteins and fats Food sources Milk, egg yolk, liver, kidney and heart Whole grain cereals, meat, whole bread, fish, bananas Deficiency: Beriberi, Pellagra, megaloblastic anemia etc…… 82 2/7/2011 S.E.
  • 83.
    Cont….  Vitamin C Function Preventionof scurvy Aiding wound healing Assisting absorption of iron Food sources Fresh fruits (oranges, banana, mango, grapefruits, lemons, potatoes) and vegetables (cabbage, carrots, pepper, tomatoes) Breast milk Deficiency: Scurvy 83 2/7/2011 S.E.
  • 84.
    Minerals  Minerals arethe substances that people need to ensure the health and correct working of their soft tissues, fluids and their skeleton.  Examples of minerals include calcium, iron, iodine, fluorine, phosphorus, potassium, zinc, selenium, and sodium. 84 2/7/2011 S.E.
  • 85.
    Functions and sourcesof common minerals. Minerals Function Food sources Calcium Gives bones and teeth rigidity and strength Milk, cheese and dairy products Foods fortified with calcium, e.g. flour, cereals. eggs, fish cabbage Iron Formation of haemoglobin Meat and meat products Eggs, bread, green leafy vegetables, pulses, fruits Iodine For normal metabolism of cells Iodised salt, sea vegetables, yogurt, cow's milk, eggs, and cheese Fish; plants grown in iodine rich soil Zinc For children to grow and develop normally; for wound healing Maize, fish, breastmilk, meat, beans 85 2/7/2011 S.E.
  • 86.
    Sources of information Supplierproduct manuals Product labels Brochures Internet Product seminars 86 2/7/2011 S.E.
  • 87.
    Storage of healthand nutritional products  Food preservation includes a variety of techniques that allow food to be kept for extended periods of time without losing nutritional quality and avoiding the growth of unwanted microorganisms.  There are three basic objectives for the preservation of foods: 87 2/7/2011 S.E.
  • 88.
    Cont…  Prevention ofcontamination of food from damaging agents.  Delay or prevention of growth of microorganisms in the food.  Delay of enzymic spoilage, i.e. self- decomposition of the food by naturally occurring enzymes within it. 88 2/7/2011 S.E.
  • 89.
    Prevention of contamination (aseptictechnique) This technique simply means to prevent contamination of the food by spoilage agents or by contact with them. The word ‘aseptic’ means free from harmful bacteria, viruses etc. The technique requires either using an artificial covering for the food, or keeping its natural protective covering if there is one. 89 2/7/2011 S.E.
  • 90.
    Removal or reductionof microorganisms  Microorganisms can be physically removed from food, or their numbers reduced, by techniques like washing, trimming, sieving and filtration. 90 2/7/2011 S.E.
  • 91.
    The use ofhigh temperature Heat is one of the oldest methods of destroying microorganisms in food processing and preservation. . Food is also rendered safe by the application of heat because most pathogenic microorganisms are comparatively heat-sensitive. 91 2/7/2011 S.E.
  • 92.
    Cont….  Some ofthe methods of heat treatment used for food preservation are discussed below.  Cooking/boiling  Pasteurisation  Blanching  Canning 92 2/7/2011 S.E.
  • 93.
    The use oflow temperature  Unlike high temperature, cold is not an effective means of destroying pathogenic bacteria, viruses and toxins in foods, but it can retard their multiplication and metabolic activities.  No food or food product is rendered free from microorganisms by low temperature (by freezing or refrigeration). 93 2/7/2011 S.E.
  • 94.
    Cont…  Chilling  Freezing Drying Fermentationand pickling Chemical preservation Salting Sugaring Smoking 94 2/7/2011 S.E.
  • 95.
  • 96.
    HEALTH AND NUTRITION INFORMATION The parents and carers, whose children become malnourished, generally come from the poorest sections of society.  They frequently have not attended school, or have only had basic education.  Many cannot read of write.  They are often unaware of the nutritional needs of children. 96 2/7/2011 S.E.
  • 97.
    Key Message Key Message1: A young child should grow well and gain weight rapidly. From birth to age two, children should be weighed every month. If a child has not gained weight for about two months, something is wrong Key Message 2: Breast milk alone is the only food and drink an infant needs until the age of six months. After six months, the child needs a variety of other foods in addition to breast milk 97 2/7/2011 S.E.
  • 98.
    Cont…. Key Message 3: Fromthe age of six months to two years, children need to be fed five times a day, in addition to sustained breastfeeding Key Message 4: Children need vitamin A to resist illness and prevent visual impairments. Vitamin A can be found in many fruits and vegetables, oils, eggs, dairy products, fortified foods, breast milk, or vitamin A supplements 98 2/7/2011 S.E.
  • 99.
    Cont…. Key Message 5: Childrenneed iron-rich foods to protect their physical and mental abilities. The best sources of iron are liver, lean meats, fish, eggs and iron- fortified foods or iron supplements • Key Message 6: Iodized salt is essential to prevent learning disabilities and delayed development in children 99 2/7/2011 S.E.
  • 100.
    Cont…. Key Message 7: Duringan illness, children need to continue to eat regularly. After an illness, children need at least one extra meal every day for at least a week 100 2/7/2011 S.E.
  • 101.
  • 102.
    Introduction •What is nutritionalassessment? o Nutritional assessment is the interpretation of  anthropometric,  biochemical (laboratory),  clinical and  dietary data oTo determine whether a person or groups of people are well nourished or malnourished (over nourished or under- nourished).
  • 103.
     There aretwo methods of assessing Nutritional status: 1. Direct method 2. Indirect method Indirect methods - include assessment of indicators of the food and nutrition situations in the area/ region of interest by looking at certain data that are closely related to malnutrition or which are aggravated by malnutrition. - These include: - Cause specific mortality rates - Age specific mortality rates - Health service statistics - Rate of nutritionally relevant infections 103 2/7/2011 S.E.
  • 104.
    Cont’… -Meteorological data (rainfalldata ) - Production pattern and distribution pattern - Income levels - Market price of foods - Predominance of cash crops 104 2/7/2011 S.E.
  • 105.
    Direct methods  Involvethe direct measurement of body dimensions and proportions, determination of tissue or body fluid concentrations of nutrients, dietary intake, appearance of the clinical symptoms and signs related to a specific nutrient dependent functional impairment. abbreviated as the ABCDs  A=Anthropometry  B= Biochemical/Biophysical  C= Clinical  D= Dietary 105 2/7/2011 S.E.
  • 106.
    Generalized scheme fordevelopment of nutritional deficiency 106 2/7/2011 S.E.
  • 107.
    A. Anthropometric assessments Anthropometry comes from two words: - Anthropo = Human, and - Metry = measurement.  Definition: - Anthropometry refers to measurement of variations of physical dimension and gross composition of human body at different levels and degrees of nutrition (Jelliff, 1966). 107 2/7/2011 S.E.
  • 108.
    1. Head circumference(HC)  Measured using flexible measuring tape around 0.6cm wide to the nearest 1mm.  It is the circumference of the head along the supra orbital ridge anteriorly and occipital prominence posteriorly.  HC is useful in assessing chronic nutritional problems in under two children.  But after 2 years as the growth of the brain is sluggish it is not useful. 108 2/7/2011 S.E.
  • 109.
    2. Length o Awooden measuring board (also called sliding board) is used for measuring length. o It is measured in recumbent position in children <2 yrs old to the nearest 1mm. o An assistance of two people is needed in taking the measurement. o Measurement is read to the nearest mm. 109 2/7/2011 S.E.
  • 110.
    3. Height  Ismeasured in children > 2 yrs and adults in standing position to the nearest 0.1 cm.  The head should be in the Frankfurt plane during measurement, knees should be straight and the heels, buttocks and the shoulders blades, should touch the vertical surface of the stadiometer (anthropometer) or wall.  Stadiometer or portable anthropometer can be used for measuring.  There is also a plastic instrument called acustat Stadiometer that is cheaper than the conventional Stadiometer. 110 2/7/2011 S.E.
  • 111.
  • 112.
  • 113.
    4. Weight • Weighingsling (spring balance) also called salter scale is used for measurement of weight in children < 2 years. • In children < 2 years the measurement is performed to the nearest 10g. • In adults and children >2 years, beam balance is used and the measurement is performed to the nearest 0.1 kg. 113 2/7/2011 S.E.
  • 114.
  • 115.
  • 116.
  • 117.
    Indices derived fromthese measurements  What is an index? It is a combination of two measurements or a measurement plus age.  The following are few of them: - - Head circumference-for age - Weight -for-age - Height-for age - Weight for height 117 2/7/2011 S.E.
  • 118.
    Meanings of theindices derived from growth measurements 118 2/7/2011 S.E.
  • 119.
    Cont… Stunting is definedas a low height for age of the child compared to the standard child of the same age. Stunted children have decreased mental and physical productivity capacity. Wasting is defined as a low weight for the height of the child compared to the standard child of the same height. Wasted children are vulnerable to infection and stand a greater chance of dying. 2/7/2011 S.E. 119
  • 120.
    Anthropometric measurements used toassess body composition Measurements of fat-mass (fatness) Body mass index (BMI) is the weight of a person in kilogram divided by their height in meters squired. Anon pregnant adult is considered to have a normal BMI when it falls between 18.5- and 25 kg/meter squired. If an adult person has a BMI of less than 16 kg/ m2 they will not be able to do much physical work because they will have poor energy stores. 2/7/2011 S.E. 120
  • 121.
    Cont….  In additionthey will be at increased risk of infection due to low immunity. Risk of mortality and morbidity is related to the nutritional status as assessed by the BMI.  If peoples are too fat or too thin their health is suffer. 2/7/2011 S.E. 121 Bodymassindex(BMI)=Weightinkilogram Heightinmetersquired
  • 122.
    Classifications of overweight, obesityand normal BMI Body mass index Classification < 16 Sever chronic energy deficiency 16.0- 16.9 Moderate chronic energy deficiency 17.0- 18.49 Mild chronic energy deficiency 18.5- 24.9 Normal 25.0-29.9 Overweight ( pre-obese) 30.0 – 40 Obese >40 Very obese 2/7/2011 S.E. 122
  • 123.
    Measuring fat-free mass (musclemass) Mid upper arm circumference (MUAC) An accurate way to measure fat free mass is to measure the Upper arm circumference (MUAC). is the circumference of the upper arm at midway between the shoulder tip and the elbow tip on the left arm. The mid arm point is determined by measuring the distance from the shoulder tip to the elbow and dividing it by two. A low reading indicates a loss of muscle mass. 2/7/2011 S.E. 123
  • 124.
    Measure the MUACof children: A special tape is used to the MUAC of a child. The tape has three colors, with the red indicates sever acute malnutrition (SAM), the yellow indicating moderate acute malnutrition and the green indicate normal nutritional status. 2/7/2011 S.E. 124
  • 125.
    Cut-off points forscreening in the community for SAM and MAM using MUAC Target Groups MUAC (in cm) Nutritional status Children less than five years 11- 11.9 cm Moderate acute malnutrition (MAM) < 11 cm Sever acute malnutrition ( SAM) Pregnant women /adult 17-21 cm Moderate malnutrition 18-21 cm with recent weight loss < 17 cm Sever malnutrition < 18 cm with recent weight loss 2/7/2011 S.E. 125
  • 126.
    Clinical assessment method Clinicalmethod of nutritional status assessment involves checking the sign of nutritional deficiency at specific places on the body or asking the patient whether they have any symptoms that might suggest nutrient deficiency. The Clinical signs of nutrient deficiency include: pallor (on the palm of hands or the conjunctiva of the eye), Bitot’s spot on the eye, pitting edema on the leg, sever wasting and goiter on the neck. 2/7/2011 S.E. 126
  • 127.
    Checking for bilateralpitting edema in a child To determine the presence of edema, apply normal thumb pressure on both feet for three seconds (count the number 101,102,102 in order to estimate three second without using a watch). If a shallow print persists on both feet, the child has nutritional edema ( pitted edema ). 2/7/2011 S.E. 127
  • 128.
    2/7/2011 S.E. 128 Gradesof edema Depending on the presence of edema on the different levels of the body it is graded, an increase in grade indicates the severity of edema. 0 = no edema + = below the ankle (pitting pedal edema) ++ = pitting edema below the knee +++ = Generalized edema
  • 129.
    Bitot’s spot  Bitot’sspot: is a sign of vitamin A deficiency, the spots are a creamy color and appear on whit part of the eye. 2/7/2011 S.E. 129
  • 130.
    Goiter  Goiter: isswelling on the neck and is visible sign of iodine deficiency disease. 2/7/2011 S.E. 130
  • 131.
    Visible sever wasting To determine the presence of visible sever wasting for younger than six months child, you will need to ask the mother to remove all of the child’s cloth so you can look at the arms, thighs, and buttocks for loss of muscle bulk. Sagging skin and buttock indicates visible sever wasting as you can see in the figure. 2/7/2011 S.E. 131
  • 132.
    Pallor on thepalm of hands or conjunctiva  Pallor on the palm of hands or conjunctiva is a sign of Iron and folic acid deficiency is estimated to be responsible for half of all anemia cases treating Iron deficiency anemia decreases maternal and child mortality significantly. 2/7/2011 S.E. 132
  • 133.
    clinical signs andsymptoms of nutritional problems Sign or symptoms Nutritional abnormality Pale: palms, conjunctiva, tongue gets tired easily : loss of appetite, shortness of breath Anemia :may be due to the deficiency of iron, folic acid, vitamin B12, acid, copper protein or vitamin B6 Bitot’s spot ( whitish patchy triangular lesions on the side of the eye Vitamin A deficiency Goiter ( swelling on the front of the neck Iodine deficiency disorder 2/7/2011 S.E. 133
  • 134.
    Biochemical assessment method  Biochemicalassessment method: It is one of the nutritional status assessment methods. This method involves measurement of either total amount of nutrient in the body or concentration of nutrient in body fluid or organs in the body ( e.g. plasma albumin, other serum protein level and hemoglobin). 2/7/2011 S.E. 134
  • 135.
    Dietary methods ofassessing nutritional status  Dietary methods of assessment involves looking the past or current intake of nutrients from food by individuals or group to determine their nutritional status. You can ask what the family or the mother and the child have eaten over the past 24 hours and use this data to calculate the dietary diversity score.  Dietary diversity is a measure of the number of food groups consumed over a reference period, usually 24 hours. 2/7/2011 S.E. 135
  • 136.
    Interpretation of theIndices  Taking age and sex into consideration, differences in measurements can be expressed in a number of ways: ◦ Z-score ◦ Percent of the median ◦ percentiles 2/7/2011 136 S.E.
  • 137.
    Classification of nutritionalstatus based anthropometric indicators I. Gomez classification (weight-for-age) (Gomez et al, 1956) 137 2/7/2011 S.E.
  • 138.
    2. Well-come classification(weight-for- age) (Welcome trust working party 1970) 138 2/7/2011 S.E.
  • 139.
    Waterlow Classification (Waterlow JC,1972) Index % of NCHS reference Level of Malnutrition In adults Height For Age 90-94% 85-89% Mild Moderate Sever Weigh for Height 80- 89 <70% < 85% Stunting (Chronic malnutrition) Wasting (Acute Malnutrition) 70-79 Mild Moderate Sever 139 2/7/2011 S.E.
  • 140.
    Introduction  What ismalnutrition? ◦ Faulty nutrition ◦ Occurs when you take excess or do not get enough calories or nutrients  Over nutrition  Under nutrition  Excessive or inadequate intake of macronutrients and micronutrients could result in A. Over nutrition ◦ Excess intake of macronutrients  Overweight/obesity  NCDs ◦ Excess intake of micronutrients  Toxicity B. Undernutrition ◦ Inadequate intake of macronutrients  PEM/PCM ◦ Inadequate intake of micronutrients  VAD, IDA, IDD, ZiD, PEM, etc  MNDs are the world’s most prevalent and most devastating nutritional problems 2/7/2011 140 S.E.
  • 141.
     Ethiopia’s mainnutritional problems of public health importance are ◦ Protein Energy (Calorie) Malnutrition (PEM/PCM)  Clinical forms (Marasmus, Kwashiorkor, Mixed)  Milder forms (stunting, underweight, wasting) ◦ Micronutrient Deficiencies (MNDs)  Iron Deficiency Anemia (IDA)  Iodine Deficiency Disorders (IDD)  Vitamin A Deficiency (VAD)  Zinc Deficiency (ZiD) ◦ But, these are not the only nutritional disorders in our country. 2/7/2011 141 S.E.
  • 142.
    causes of malnutrition Multifactorial causes • Having a number of interwoven factors operating simultaneously • Three causes  Basic causes  Underlying causes  Immediate causes 2/7/2011 142 S.E.
  • 143.
  • 144.
    Protein Energy Malnutrition Other terms are  Multi-deficiency syndrome  Failure to thrive  The term PEM/PCM/PED has been used to describe ◦ A range of disorders primarily characterized by growth failure or retardation in children.  Growth deficit is catalogued as ◦ Clinical forms – Marasmus :- Retarded growth with wasting of subcutaneous fat – Kwashiorkor;- Growth failure with wasting of muscles and preservation of subcutaneous fat and pitting type edema – Mixed: Marasmus-Kwashiorkor (MK):- Edema of kwashiorkor with wasting of marasmus ◦ Milder forms  Wasting: Thinness using weight for height (W/H)  Stunting: Linear growth retardation using height for age (H/A)  Underweight: A result of wasting and/or stunting , Using weight for age (W/A) 2/7/2011 144 S.E.
  • 145.
    Clinical forms Marasmus • Characteristics •Occurs in children < 2 yrs of age • Severe deprivation • Develops slowly • As the stored fats and tissue proteins are used up for the production of energy, severe weight loss and severe muscle wasting are evident • Low growth (<60%), Low WAZ • No edema, no fatty liver • Anxiety, apathy • Possible good appetite • Hair thin, dry; skin dry • “Old Man“ face, wrinkled appearance • Ribs become prominent and limbs become very thin as the fat layer beneath the skin disappears. 2/7/2011 145 S.E.
  • 146.
  • 147.
  • 148.
  • 149.
  • 150.
  • 151.
    Kwashiorkor • Caused bylack of nutrients including protein in the diet • Characteristics • 1st to 3rd yrs of life • Edema; • Enlarged fatty liver • Low protein, infections • Rapid onset • Some weight loss • Some muscle wasting • Growth: 60-80% • Mod low WAZ • Apathy, misery, irritable • Loss of appetite • Hair dry • Dermatosis (skin lesions) 2/7/2011 151 S.E.
  • 152.
  • 153.
  • 154.
  • 155.
  • 156.
    2/7/2011 156 Assessment ofbilateral pitting edema S.E.
  • 157.
  • 158.
     Marasmus-Kwashiorkor ◦ Common ◦Combination of the two ◦ Characterized by bilateral edema AND the child is low weight for height ◦ This combination is often seen in HIV/AIDS. 2/7/2011 158 S.E.
  • 159.
  • 160.
  • 161.
    Supplementary Suckling Technique  Thisinfant is suckling the breast and also getting the F100diluted (130ml/kg/d) by the supplemental suckling technique.  Raising or lowering the cup determines the ease with which the infant gets the supplement: for very weak infants it can be at the level of the infant’s mouth. If it is above this level the feed can go into the child by siphonage when there is a danger of aspiration. 2/7/2011 161 S.E.
  • 162.
  • 163.
  • 164.
    (VAD) Definition • A comprehensiveterm that covers all effects of the deficiency state including those on health, survival and vision • Vitamin A deficiency (VAD) is a disease caused by lack of adequate vitamin A intake. • It is manifested by night blindness, xerophthalmia, and if deficiency is
  • 165.
  • 166.
  • 167.
    Diagnosis  Diagnosis isbased on mainly history and physical examination  The patient may have the following symptoms and signs  Symptoms: -Night blindness -Feeling of dryness in the eye -Sometimes parents may complain of whitish plaque in the child’s eye -Blindness Signs: -Poor dark adaptation -Bitot’s spots 167 2/7/2011 S.E.
  • 168.
    Prevention and Controlof Vitamin A deficiency The elimination of VAD can best be achieved through a comprehensive approach that combines strategies. There are five main types of intervention for VAD as suggested by WHO: - Promoting breast milk - Supplementation - Food fortification - Dietary modification - Infection control 168 2/7/2011 S.E.
  • 169.
    Iodine Deficiency Disorder(IDD) Definition  Iodine Deficiency Disorders refer to a spectrum of health consequences resulting from inadequate intake of iodine.  The adverse consequences of iodine deficiency lead to a wide spectrum of problems ranging from abortion and still birth to mental and physical retardation and deafness, which collectively known as Iodine Deficiency Disorders (IDDs). 169 2/7/2011 S.E.
  • 170.
    Aetiology  Iodine deficiencyoccurs when either iodine intake is inadequate or the presence of goitrogens (anti thyroid) in the diet is high.  The erosion of soils in areas with river due to loss of vegetation from clearing results in a continued and increasing loss of iodine from the soil. Groundwater and foods grown in these areas lack iodine. 170 2/7/2011 S.E.
  • 171.
    Clinical Features (Signsand Symptoms) Fetus ◦ Abortion ◦ Congenital anomalies ◦ Still birth ◦ Increased perinatal mortality ◦ Endemic cretinism (physical &mental stunting to hypothyroidism) 171 2/7/2011 S.E.
  • 172.
    Neonate ◦ Neonatal goiter ◦Neonatal hypothyroidism ◦ Endemic mental retardation Child and adolescent ◦ Goiter ◦ Impaired mental development and function ◦ Hypothyroidism ◦ Retarded physical development 172 2/7/2011 S.E.
  • 173.
    Adult ◦ Hypothyroidism ◦ Impairedmental function Most important consequences of the spectrum of IDD are: ◦ Goiter ◦ Mental retardation ◦ Hypothyroidism ◦ Cretinism ◦ Increased morbidity and mortality of infants and neonates 173 2/7/2011 S.E.
  • 174.
    Diagnosis A. History, physicalexamination -Thyroid size B . Lab Iodine level is best assessed by measurement of - Urinary iodine - Serum T3, T4, TSH and Thyroglobulin - Saliva /serum iodine ratio 174 2/7/2011 S.E.
  • 175.
    Cut off pointsfor iodine deficiency 175 2/7/2011 S.E.
  • 176.
    Prevention and Controlof IDD  The main strategies to control and eliminate iodine deficiency are: 1. Universal iodization of salt for human and animal consumption  Iodized salt is both a preventive and corrective measure for iodine deficiency and is the most effective, low cost, long- term solution to this major public health problem.  Iodized salt should be used on a daily basis in an iodine deficient environment and the daily requirement of iodine for adults is 150 micrograms. 176 2/7/2011 S.E.
  • 177.
    2. Supplementation ofiodine capsules to populations in highly endemic areas  As a short-term strategy in highly endemic areas, Lipiodol (iodized oil capsules), should be distributed on a one-time basis to individuals. Dosage is: - One capsule for pregnant women and children under 5 - Two capsules for women of reproductive age and children 5 to 14 years of age. 177 2/7/2011 S.E.
  • 178.
    Iron Deficiency Anaemia(IDA) Definition  Anaemia is defined as a reduction of the red blood cell volume or haemoglobin concentration below the level considered normal for the person's age/sex. Epidemiology  Iron deficiency anaemia is the most prevalent nutritional problem in the world today, affecting more than 700 million persons.  It is considerably more prevalent in the developing than in the developed world (36% or about 1.4 billion persons out of an estimated population of 3.8 billion in developing countries, versus 8% or just under 100 million persons out of an estimated population of 1.2 billion in developed countries). 178 2/7/2011 S.E.
  • 179.
     According toEDHS 2011 more than half (54%) of Ethiopian children age 6-59 months and 27 % of women age 15-49 are anaemic. Aetiology  Iron deficiency anaemia can be caused by: 1. Deficient iron content of the food. 2. Deficient absorption of iron. -This is due to poor dietary practice like, less consumption of diets rich in vitamin C which enhance iron absorption, drinking coffee and tea immediately after meal which inhibits iron absorption. 179 2/7/2011 S.E.
  • 180.
    3. Gastrointestinal tractoperation. It may occur also in chronic malabsorption states or diseases and consumption of antiacids, fibrous diet and heavy metals like calcium, zinc, magnesium. 4. Deficient transport: A decrease in transferrin (iron-binding protein). 5. Abnormal loss of iron: It is commonly caused by loss of circulating red cells through haemorrhage, excessively heavy menstruation or due to parasites like hookworm and schistosomiasis. 6. Increased physiologic requirements: This occurs primarily in children during active 180 2/7/2011 S.E.
  • 181.
    Clinical Features Symptoms  Tiredness,weakness or fainting, fatigue, head ache  Breathlessness (shortness of breath), nausea, poor appetite  Exercise intolerance, tinnitus (ringing in the ear)  Blurred vision , palpitation (uncomfortable awareness of ones heart beat).  Excessive desire to eat unusual substances (pica) such as clay or ice. 181 2/7/2011 S.E.
  • 182.
    Signs  Paleness (skinand mucus membranes)  Edema in chronic and sever cases  Irritability  Poor growth and development in children Diagnosis of anaemia  Anaemia can be identified using the following methods:  History: Detect clinical symptoms of anaemia, dietary history.  Physical Examination: Examine mucous membrane (mouth, conjunctiva), palm and finger nails. 182 2/7/2011 S.E.
  • 183.
     Laboratory Examination:Measure haemoglobin or hematocrit.  The haemoglobin levels indicating anaemia are shown in the following table. 183 2/7/2011 S.E.
  • 184.
    Assessment of IronNutritional Status • Iron nutritional status can be assessed by the following biochemical and hematological tests – Hemoglobin – Hematocrit – Serum iron concentration – Total iron binding capacity – Transferrin saturation – Protoporphyrin – Serum ferritin – Transferrin receptors 2/7/2011 S.E. 184
  • 185.
    Public health implicationsof IDA ◦ IDA is associated with  Poor reproductive performance  High proportion of maternal death (10 – 20% of total deaths)  High incidence of LBW (< 2500 g at birth)  Intrauterine malnutrition  Impaired scholastic performance (impaired psychomotor development and intellectual performance)  Decreased resistance to infection  Reduction of work capacity/productivity 2/7/2011 S.E. 185
  • 186.
    Prevention and Control Early detection and treatment of underlying causes  Assessment and appropriate management of high risk groups: E.g. - Pregnant women - Pre-term infants - Lactating mothers - People with malnutrition 186 2/7/2011 S.E.
  • 187.
    Preventing the underlyingcauses of anaemia Prevention of malaria Prevention of parasites like hook worm infestation Prevention of chemical poisoning, like lead poisoning. Safety measures for the prevention of trauma causing blood loss. Other public health measures such as: Birth spacing, immunization, improved water supply and sanitation, dietary improvement, food fortification, supplementation with iron tablets. 187 2/7/2011 S.E.
  • 188.
    Nutritional intervention Definition- Itis a corrective measure that is undertaken to reduce or avoid the occurrence of over all malnutrition or specific nutrient deficiency or excess. Based on the underlying cause of the nutritional problem, the nutritional interventions can vary.
  • 189.
    1. Nutrition educationand promotion of horticultural activities (dietary diversification)  It promotes consumption of different varieties of foods.  Nutritional education needs to focus on the promotion of consumption of different diversities of foods.  Problems that may face this approach  The food promoted must be - Culturally accepted - Consumed by the vulnerable - Target nutrients must be absorbed from 189 2/7/2011 S.E.
  • 190.
    2. Dietary modification Aimed at modifying the energy, protein, and micronutrient content of foods especially weaning foods, and other infant formulas.  e.g. – The energy and protein content of a food can be improved by fermenting or germinating adding a powder flour.  Other methods employed to improve the micronutrient contents of a food include.  Enrichment- addition of a nutrient, which is originally present in the food, above the level found naturally.  Restoration- Replacement of a nutrient lost during harvest, storage or processing. 190 2/7/2011 S.E.
  • 191.
    Cont’…  Standardization- tocompensate for the natural variation of foods grown in different geographic areas in their contents of a nutrient.  Fortification- an addition of a nutrient in a food that is not naturally present in order to enhance the consumption of the target nutrient.  Supplementation- administration of nutrients in the form of tablets, capsule, or injection. 191 2/7/2011 S.E.
  • 192.
    3. Economic approaches A.Food-For-Work (FFW) Projects  In these projects, food is given as full or partial payment of wages to people working in land improvement or community development projects.  This strategy is very effective during food shortages, particularly when it targets the poor.  It allows able -bodied individuals to earn food rather than become reliant on food handouts. 192 2/7/2011 S.E.
  • 193.
    B. Food stamps A sort of officially stamped ticket will be given to the poor which they could use for buying food from restaurant etc and this will be paid later on by the government. Advantage - They are preventive. Disadvantage  They are highly targeted to urban people.  They have high administrative cost.  The system can be abused. 193 2/7/2011 S.E.
  • 194.
    C. Income-Generating Projects(IGP)  Relief agencies may issue small loans and training to the most affected families in order to provide them with alternative sources of income once food aid is phased out.  These projects should have a direct impact on improving food production, e.g., digging wells, raising poultry and small livestock, fishing or milling projects. 194 2/7/2011 S.E.
  • 195.
    4. ENA (EssentialNutrition Actions)  Over past 30-40 years nutrition interventions were often… not integrated viewed as separate vertical programs in competition with one another not action oriented(non-specific) focused only on GM/P activities 195 2/7/2011 S.E.
  • 196.
    ENA…  In thepast 10 years growing consensus is that nutrition interventions need to be…  integrated conceptually& programatically - infant & young child feeding - maternal nutrition - micronutrients  based on proven impact  action oriented with clear guidance « Who should take what action when »  7 action areas 196 2/7/2011 S.E.
  • 197.
  • 198.
  • 199.
  • 200.
  • 201.
  • 202.
  • 203.
  • 204.
  • 205.
  • 206.
  • 207.
  • 208.
    Infant feeding optionsin the context of HIV/AIDS Group1: Pregnant women whose HIV status is unknown or who have been tested and are HIV negative:  As before… - Exclusive breastfeeding 0 to 6 months - Introduction of Complementary Feeding at 6 months - Continued breastfeeding to 24months+ 208 2/7/2011 S.E.
  • 209.
    Group 2: Pregnantwomen who have been tested and are HIV positive:  Ideally a woman should be supported through counseling to make an informed choice on how to feed her infant to reduce risk of HIV transmission.  Provision of ARVs to reduce transmission 209 2/7/2011 S.E.
  • 210.
  • 211.
    When replacement feedingIS NOT acceptable, feasible, affordable, sustainable and safe… Option 1: Safer breastfeeding Option 2: Heat treating breast milk Option 3: Wet nursing by HIV negative woman Option 4: Early cessation of breastfeeding 211 2/7/2011 S.E.
  • 212.
  • 213.
  • 214.

Editor's Notes

  • #54 The skeleton supplies buffer by active resorption of bone. Decrease colonic mucosal thickness and reduce the height of the colonocyte brushborder membrane
  • #62 Lard; Yasam choma Baked goods ; betasa yetashegu Fried ; yedoro tebese Margarine; yedabo kibe
  • #65 EFA Lipoprotein , phospholipid , steriole . Cholsteriole