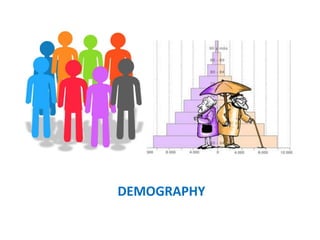
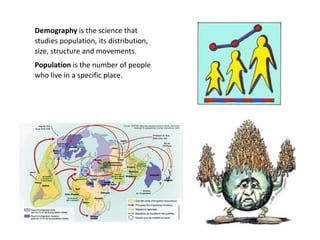
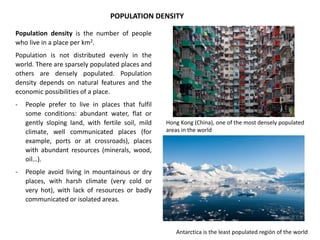
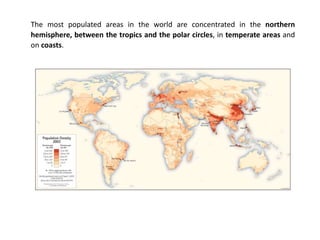
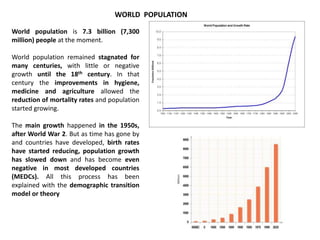
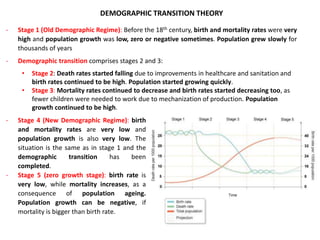
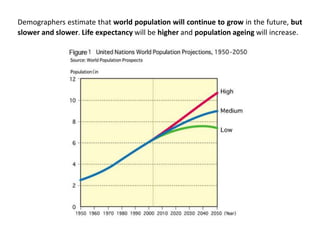
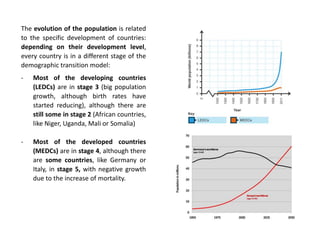
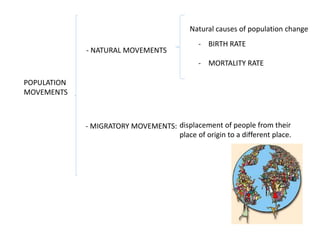
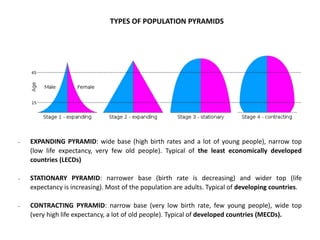
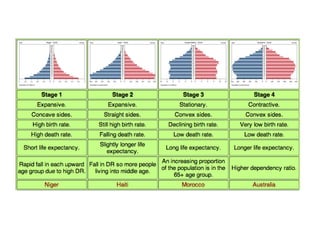
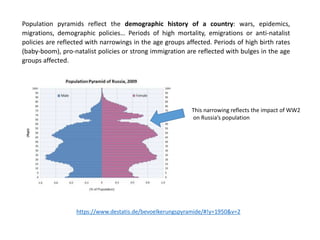
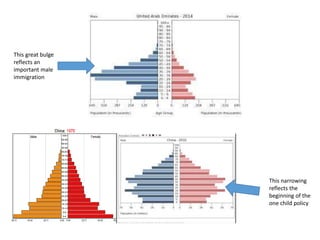
2. Demography is the science that
studies population, its distribution,
size, structure and movements.
Population is the number of people
who live in a specific place.
3. POPULATION DENSITY
Population density is the number of people
who live in a place per km2.
Population is not distributed evenly in the
world. There are sparsely populated places and
others are densely populated. Population
density depends on natural features and the
economic possibilities of a place.
- People prefer to live in places that fulfil
some conditions: abundant water, flat or
gently sloping land, with fertile soil, mild
climate, well communicated places (for
example, ports or at crossroads), places
with abundant resources (minerals, wood,
oil…).
- People avoid living in mountainous or dry
places, with harsh climate (very cold or
very hot), with lack of resources or badly
communicated or isolated areas.
Hong Kong (China), one of the most densely populated
areas in the world
Antarctica is the least populated región of the world
4. The most populated areas in the world are concentrated in the northern
hemisphere, between the tropics and the polar circles, in temperate areas and
on coasts.
5. WORLD POPULATION
World population is 7.3 billion (7,300
million) people at the moment.
World population remained stagnated for
many centuries, with little or negative
growth until the 18th century. In that
century the improvements in hygiene,
medicine and agriculture allowed the
reduction of mortality rates and population
started growing.
The main growth happened in the 1950s,
after World War 2. But as time has gone by
and countries have developed, birth rates
have started reducing, population growth
has slowed down and has become even
negative in most developed countries
(MEDCs). All this process has been
explained with the demographic transition
model or theory
6. DEMOGRAPHIC TRANSITION THEORY
- Stage 1 (Old Demographic Regime): Before the 18th century, birth and mortality rates were very
high and population growth was low, zero or negative sometimes. Population grew slowly for
thousands of years
- Demographic transition comprises stages 2 and 3:
• Stage 2: Death rates started falling due to improvements in healthcare and sanitation and
birth rates continued to be high. Population started growing quickly.
• Stage 3: Mortality rates continued to decrease and birth rates started decreasing too, as
fewer children were needed to work due to mechanization of production. Population
growth continued to be high.
- Stage 4 (New Demographic Regime): birth
and mortality rates are very low and
population growth is also very low. The
situation is the same as in stage 1 and the
demographic transition has been
completed.
- Stage 5 (zero growth stage): birth rate is
very low, while mortality increases, as a
consequence of population ageing.
Population growth can be negative, if
mortality is bigger than birth rate.
7. Demographers estimate that world population will continue to grow in the future, but
slower and slower. Life expectancy will be higher and population ageing will increase.
8. The evolution of the population is related
to the specific development of countries:
depending on their development level,
every country is in a different stage of the
demographic transition model:
- Most of the developing countries
(LEDCs) are in stage 3 (big population
growth, although birth rates have
started reducing), although there are
still some in stage 2 (African countries,
like Niger, Uganda, Mali or Somalia)
- Most of the developed countries
(MEDCs) are in stage 4, although there
are some countries, like Germany or
Italy, in stage 5, with negative growth
due to the increase of mortality.
9. POPULATION
MOVEMENTS
- NATURAL MOVEMENTS
- MIGRATORY MOVEMENTS:
- BIRTH RATE
- MORTALITY RATE
Natural causes of population change
displacement of people from their
place of origin to a different place.
10. BIRTH RATE
Number of children born in a place during a year. It is calculated with
the following formula:
Birth rate= Number of children born in one year x 1,000= ‰ (per mille)
Total population
BIRTH
RATES
PER MILLE
HIGH more than 30 ‰
MEDIUM between 15 and 30 ‰
LOW less than 15 ‰
11. TOTAL FERTILITY RATE (TFR)
Number of children born to
a woman over her lifetime.
In order to assure
generation replacement,
every woman should have
2.1 children. If every
woman has less than 2
children, replacement is not
assured and the next
generation will be smaller.
12. In the developing countries birth and
fertility rates are high for different
reasons:
o Children are a valuable source of
income for the families. They
can work on the land from a
young age and as they get older
they can earn money in other
jobs. They can help to care for
younger children and elderly
family members.
o High infant mortality rates make
women have many children in
order to ensure that some will
survive and reach adulthood.
o Religious reasons are also
important: many religions
encourage large families and
oppose contraception.
13. As societies develop, birth rates reduce for several reasons:
o The incorporation of women to work
o Later marriages and delayed motherhood
o The use of contraceptives
o As the improvements in hygiene and medicine reduced child mortality, more
children survive and families prefer having less children and taking better care of
them, so that they can have more opportunities
o Religion determines to a lesser extent people’s behaviour.
14. DEMOGRAPHIC POLICIES
PRO-NATALIST POLICY: adopted by
countries with low fertility, few births and
an ageing population, with the purpose of
encouraging people to have more
children. Governments give economic
help, tax reduction, long parental leaves
and numerous social benefits to the
families with children.
Depending on the situation of a country, governments can adopt different demographic
policies in order to change people’s attitude towards births:
“’Love for the Motherland begins with family’—F. Bacon.”
“The country needs our records. Every
minute, three people are born in
Russia”
16. ANTI-NATALIST POLICY: adopted by countries with overpopulation, which puts the
relation between population and resources in danger, in order to slow population growth.
Governments promote family planning services and contraceptives, give incentives to
reduce the number of births or fine the families who have more children than the
allowed number.
Anti-natalist campaign in Singapore
17. CHINA’S ONE CHILD POLICY
Established in 1979, it
meant that each couple was
allowed just one child.
Benefits included increased
access to education for all,
plus childcare and
healthcare offered to
families that followed this
rule. Those who didn’t do it
were fined.
This policy was successful:
birth rate and population
growth reduced, but it also
had negative impacts.
18. Negative impacts:
- due to a traditional preference for
boys, large numbers of female
babies have ended up homeless or
in orphanages, and in some cases
killed. In 2000, 90 per cent of
foetuses aborted in China were
female.
- the gender balance has become
distorted. Men outnumber women
by more than 60 million.
China's one-child policy relaxed in
recent years. Couples could apply
to have a second child if their first
child is a girl, or if both parents are
themselves only-children.
In October 2015 the Chinese
government announced the end of
this policy: all couples will be
allowed to have two children
19. MORTALITY RATE
Number of deaths in a place during a year. It is calculated with the following
formula:
Mortality rate= Number of deaths in one year x 1,000 = ‰
Total population
MORTALITY
RATES
PER MILLE
HIGH more than 30 ‰
MEDIUM between 15 and 30 ‰
LOW less than 15 ‰
Mortality rates started reducing with the improvements in medicine and hygiene. The
lower the death rate in a country, the better its healthcare system is.
20. Infant mortality rate is considered to be a better indicator than mortality rate
because it reflects the advances in the healthcare system of a country. The formula
to calculate is:
Infant Mortality Rate= Number of child deaths under 1 year x 1,000= ‰
Total number of children born in a year
http://chartsbin.com/view/1353
21. LIFE EXPECTANCY
Number of years a person is
expected to live in a specific
place. It is higher in the richest
countries and lower in the
poorer ones.
23. There are differences in life expectancy between
men and women (gender imbalance):
- At birth, there are more boys than girls. For
every 100 baby girls 106 boys are born. This
is because female foetuses have more risks
of miscarriage.
- As time goes by the difference between the
number of men and women starts
reducing, due to biological differences,
men’s riskier and less healthy lifestyle and
the development of richer networks of
personal relations from women. At
adulthood the number of men and women
is more or less equal.
- In the old age there are more women than
men and women live an average of 5 years
more than men.
Life expectancy differences in the UK
24. According to the World Health
Organization (WHO), the main causes of
death in the world are:
- In developing countries infectious
illnesses like HIV, diarrhea, tuberculosis,
lung infections and malaria cause more
deaths. Pregnancy and labour
complications also cause many deaths
among women and babies. Life
expectancy is low and less than ¼ of the
population lives more than 70 years.
- In most developed countries most of
the population die as a consequence of
chronic illnesses: cardiovascular and
lung illnesses, cancer, diabetes and
dementia. Many of these illnesses are
related to sedentary lifestyle. More
than 2/3 of the population live more
than 70 years.
CAUSES OF DEATH
25. NATURAL GROWTH
It’s the difference between the birth rate and the death rate of a country or place. It’s calculated
by subtracting the death rate from the birth rate and expressed in %
Natural increase rate= Birth rate – Mortality Rate= %
10
Natural increase can be positive (if there are more births than deaths), zero (if birth and
mortality rate are similar) or negative (if there are more deaths than births). Natural increase is
high when it is more than 2% per year, medium between 1 and 2 % and low if it’s less than 1%.
26. Natural increase is low in most developed countries, although there are some countries
with close to zero growth, like Spain or Italy, or with negative growth, like Germany or
Bulgaria. Natural increase is medium in developing countries, like Iran, Colombia or
Mexico, and high in the least developed countries, like most of the African countries (Niger
has the highest natural increase: 3.6%).
27. Overall population growth includes crude birth and mortality rates and the
migration balance (difference between the immigrants arrived in a place and
the emigrants gone). The formula to calculate it is the following:
Overall growth rate= Births- Deaths + Immigrants- Emigrants
28. MIGRATORY MOVEMENTS
Displacement of people or animals from their
place of origin to a different place. Animals
migrate in search of better conditions of living
(milder climate, more food). People also
migrate to improve their lives.
- Emigration is the act of leaving the place
where one lives for a different place. An
emigrant is a person who leaves the place
he/she comes from and goes to a different
place.
- Immigration is the arrival of population to a
place from a different one. An immigrant is
a person who arrives to a place from a
different place.
Migrants are immigrants and emigrants at the
same time. They are emigrants in the place
they leave and immigrants in the place they
arrive.
29. People decide to migrate for different reasons.
The reasons why people leave a place are
called the push factors (wars, few jobs, natural
disasters) and the reasons why people are
attracted to new places to live are called
the pull factors (job opportunities, safety,
education…). These reasons can be classified
into:
- Economic reasons: to get better jobs, to
earn more money. This is the most
important reason to decide to move to
another place.
- Political reasons: people who are
persecuted by their ideology have to
migrate to save their lives. People also
migrate from places where wars are
developing to peaceful places (refugees).
- Other reasons: health, love…
CAUSES OF MIGRATORY MOVEMENTS
30. TYPES OF
MIGRATORY
MOVEMENTS
-Depending on
destination
- Depending on
duration
- Internal migrations
rural to urban areas
urban to rural areas
- International migrations
- from poor to rich countries
- from countries in conflicto to
countries in peace
- Temporary migrations: for the day, for a season…
- Permanent migrations
31. CONSEQUENCES OF MIGRATIONS
IN THE COUNTRIES THAT LOSE POPULATION
POSITIVE EFFECTS NEGATIVE EFFECTS
- Migrants send remittances home
that help improve the lives of their
families
- pressure over jobs and resources
reduces
- the emigrants who return can bring
new ideas and skills
- those who migrate are people of
working age and this reduces their
potential workforce
- gender imbalance increases,
because more men than women
migrate.
- brain drain if many skilled workers
migrate
32. IN THE COUNTRIES THAT RECEIVE POPULATION
POSITIVE EFFECTS NEGATIVE EFFECTS
- richer and more diverse culture
- abundant workforce willing to work
for lower salaries and in less skilled
jobs
- adaptation of foreign population can
be difficult due to the clash between
different cultures or religions.
- In periods of economic crisis and
unemployment immigrants can be
seen by the population as
competitors for jobs.
33. Immigrants face a lot of challenges: they have
to adapt to a different culture, often learn a
new language, get the documents to work,
cope with the suspicions of local population,
loneliness, as many immigrants arrive alone...
All these facts can be dramatic. The feeling of
estrangement can become a psychological
illness called Ulysses Syndrome.
Queue to get the documents at a police station
Racist agression
Immigration Detention Center (CIE).
Undocumented immigrants are treated
as criminals and held prisoners until they
are expelled from the country.
34.
35. POPULATION STRUCTURE
Population can be classified:
- By sex: men and women (sex
ratio)
- By age: young people (0-15
years old), adults (15-64 years
old) and old people (more
than 65 years old)
Human sex ratio: in pink, more women than men, in blue, more men than
women and in green, same number of men and women
World population by age
Population ageing will increase in the future
36. - By economic activity:
o Working population: people who
are able to work (they are more
than 16 years old and less than 65
years old). Working population
includes all the people who are
able to work, whether they have
work (workers) or not
(unemployed). Working
population can work in three
economic sectors (primary,
secondary and tertiary sector)
o Non-working population: people
who are not able to work (they are
less than 16 years old or more
than 65 years old, they are
seriously ill or have a disability)
Working population in Spain: around 24 million
people, including workers and unemployed
Evolution of Spanish population per economic sectors
37. The age dependency ratio is the relationship between the working and non-working
population. It is higher in the least developed countries with high unemployment rates
38. POPULATION PYRAMIDS
The structure of a population is usually shown with a population pyramid, a type of
graph that includes data about the population of a place by sex and by age. With
population pyramids we can have a complete view of the population of a certain
place.
BASE (Young population)
CENTRAL PART
(adult population)
TOP (old population)
39. - EXPANDING PYRAMID: wide base (high birth rates and a lot of young people), narrow top
(low life expectancy, very few old people). Typical of the least economically developed
countries (LECDs)
- STATIONARY PYRAMID: narrower base (birth rate is decreasing) and wider top (life
expectancy is increasing). Most of the population are adults. Typical of developing countries.
- CONTRACTING PYRAMID: narrow base (very low birth rate, few young people), wide top
(very high life expectancy, a lot of old people). Typical of developed countries (MECDs).
TYPES OF POPULATION PYRAMIDS
40.
41. Population pyramids reflect the demographic history of a country: wars, epidemics,
migrations, demographic policies… Periods of high mortality, emigrations or anti-natalist
policies are reflected with narrowings in the age groups affected. Periods of high birth rates
(baby-boom), pro-natalist policies or strong immigration are reflected with bulges in the age
groups affected.
https://www.destatis.de/bevoelkerungspyramide/#!y=1950&v=2
This narrowing reflects the impact of WW2
on Russia’s population
42. This great bulge
reflects an
important male
immigration
This narrowing
reflects the
beginning of the
one child policy
43. POPULATION OF SPAIN
Spain is a developed country and so are its demographic features.
- Population in Spain has finished the demographic transition
- Birth and mortality rates are very low
44. - Spain has lost population during the
last years: the economic crisis has
made many immigrants and also an
increasing number of Spaniards has left
the country in the last year.
- At the beginning of 2015 Spain
population was 46,439,864
inhabitants, 4,447,852 of which are of
foreign origin (9.57%).
45. Origin of foreign population in Spain in 2015
Beginning 2015
BIRTH RATE 9.11 ‰
NUMBER OF CHILDREN PER WOMAN 1.27 children
AVERAGE MATERNAL AGE 31.7 years
CHILDREN BORN TO A FOREIGN MOTHER 18.4% children
MORTALITY RATE 8.34 ‰
INFANT MORTALITY RATE 2.71‰
NATURAL GROWTH 0.077%
LIFE EXPECTANCY 82.82 years (79.97 in men and
85.60 in women
PERCENTAGE OF OLD POPULATION 18.1%
IMMIGRATION 307,035 (265,757 of foreign
origin and 41,278 Spaniards)
EMIGRATION 409,343 (330, 559 of foreign
origin and 78,785 Spaniards)
MIGRATION BALANCE -102,309 people
POPULATION DENSITY 93.51 inhabitants/km2 (2011)
Very low rate
Very high rate
Negative rate
46. Spain’s density is low with
respect to other European
countries and uneven. The
most populated areas are
located on the coasts and
Madrid.
48. Spain’s population pyramid is
contracting and shows an increasing
ageing population, which will need
increasing attention.
The solutions for the problems
derived from population ageing are
a pro-natalist policy and the
promotion of immigration.
http://www.abc.es/familia-padres-hijos/20130701/abci-medidas-fomentar-
natalidad-201306251225.html
http://www.20minutos.es/noticia/2442886/0/gobierno-aprueba-1-8-millones-
ayudas-para-fomento-natalidad/
http://www.expansion.com/2013/06/21/economia/1371809249.html
http://elpais.com/diario/2000/01/07/sociedad/947199608_850215.html