Download to read offline
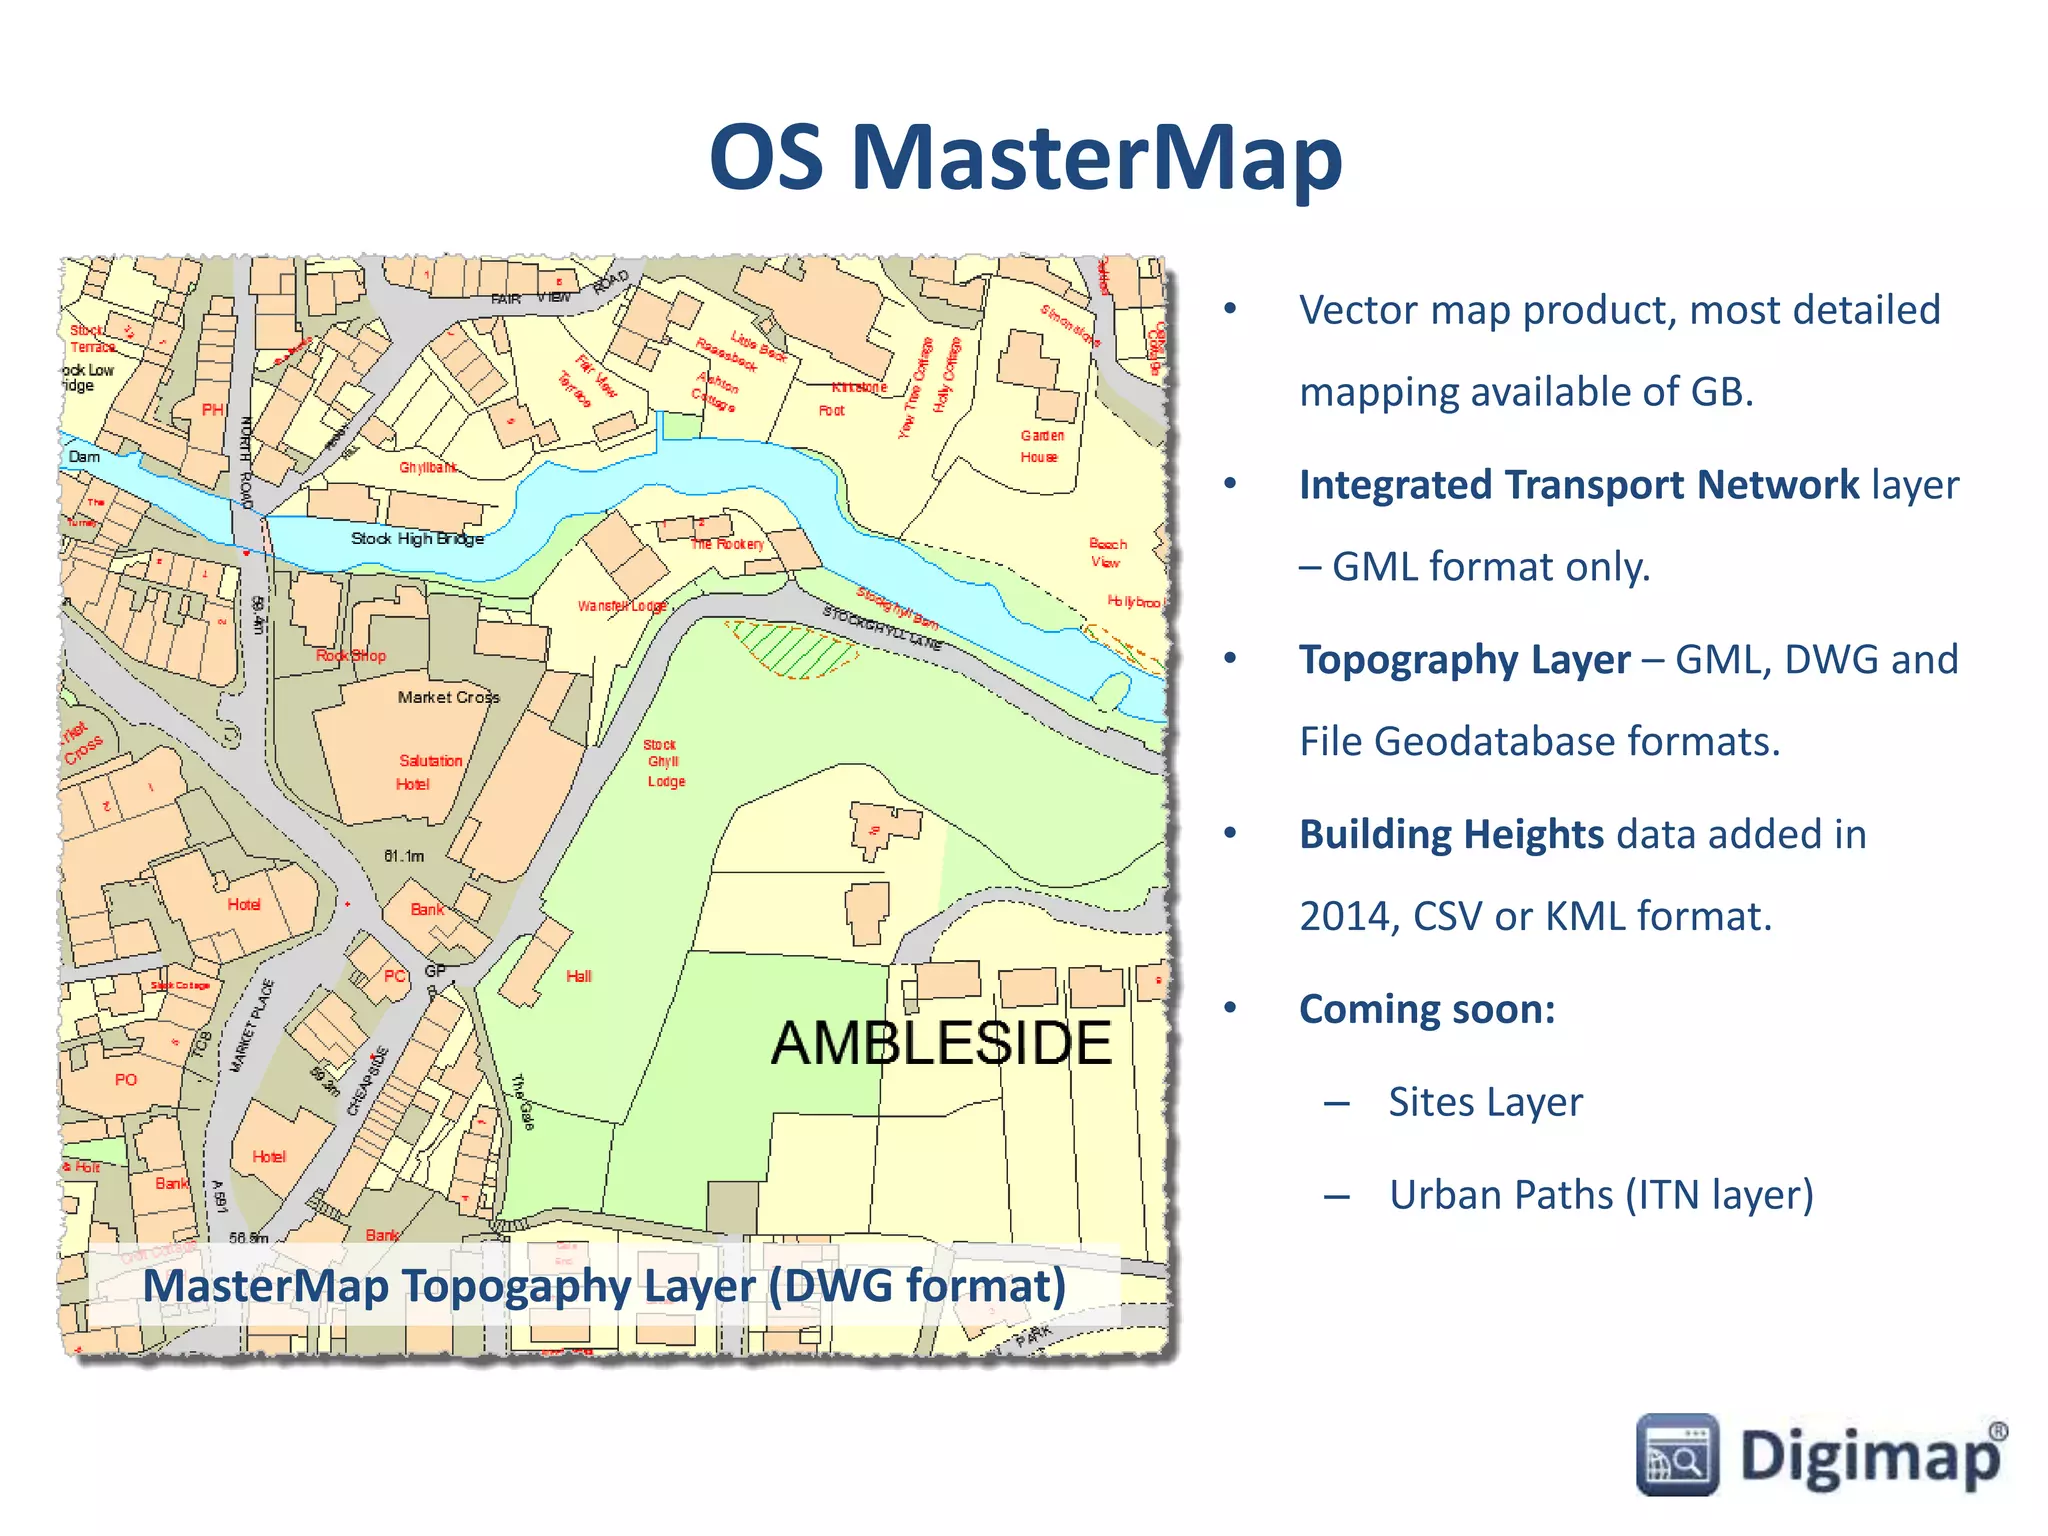
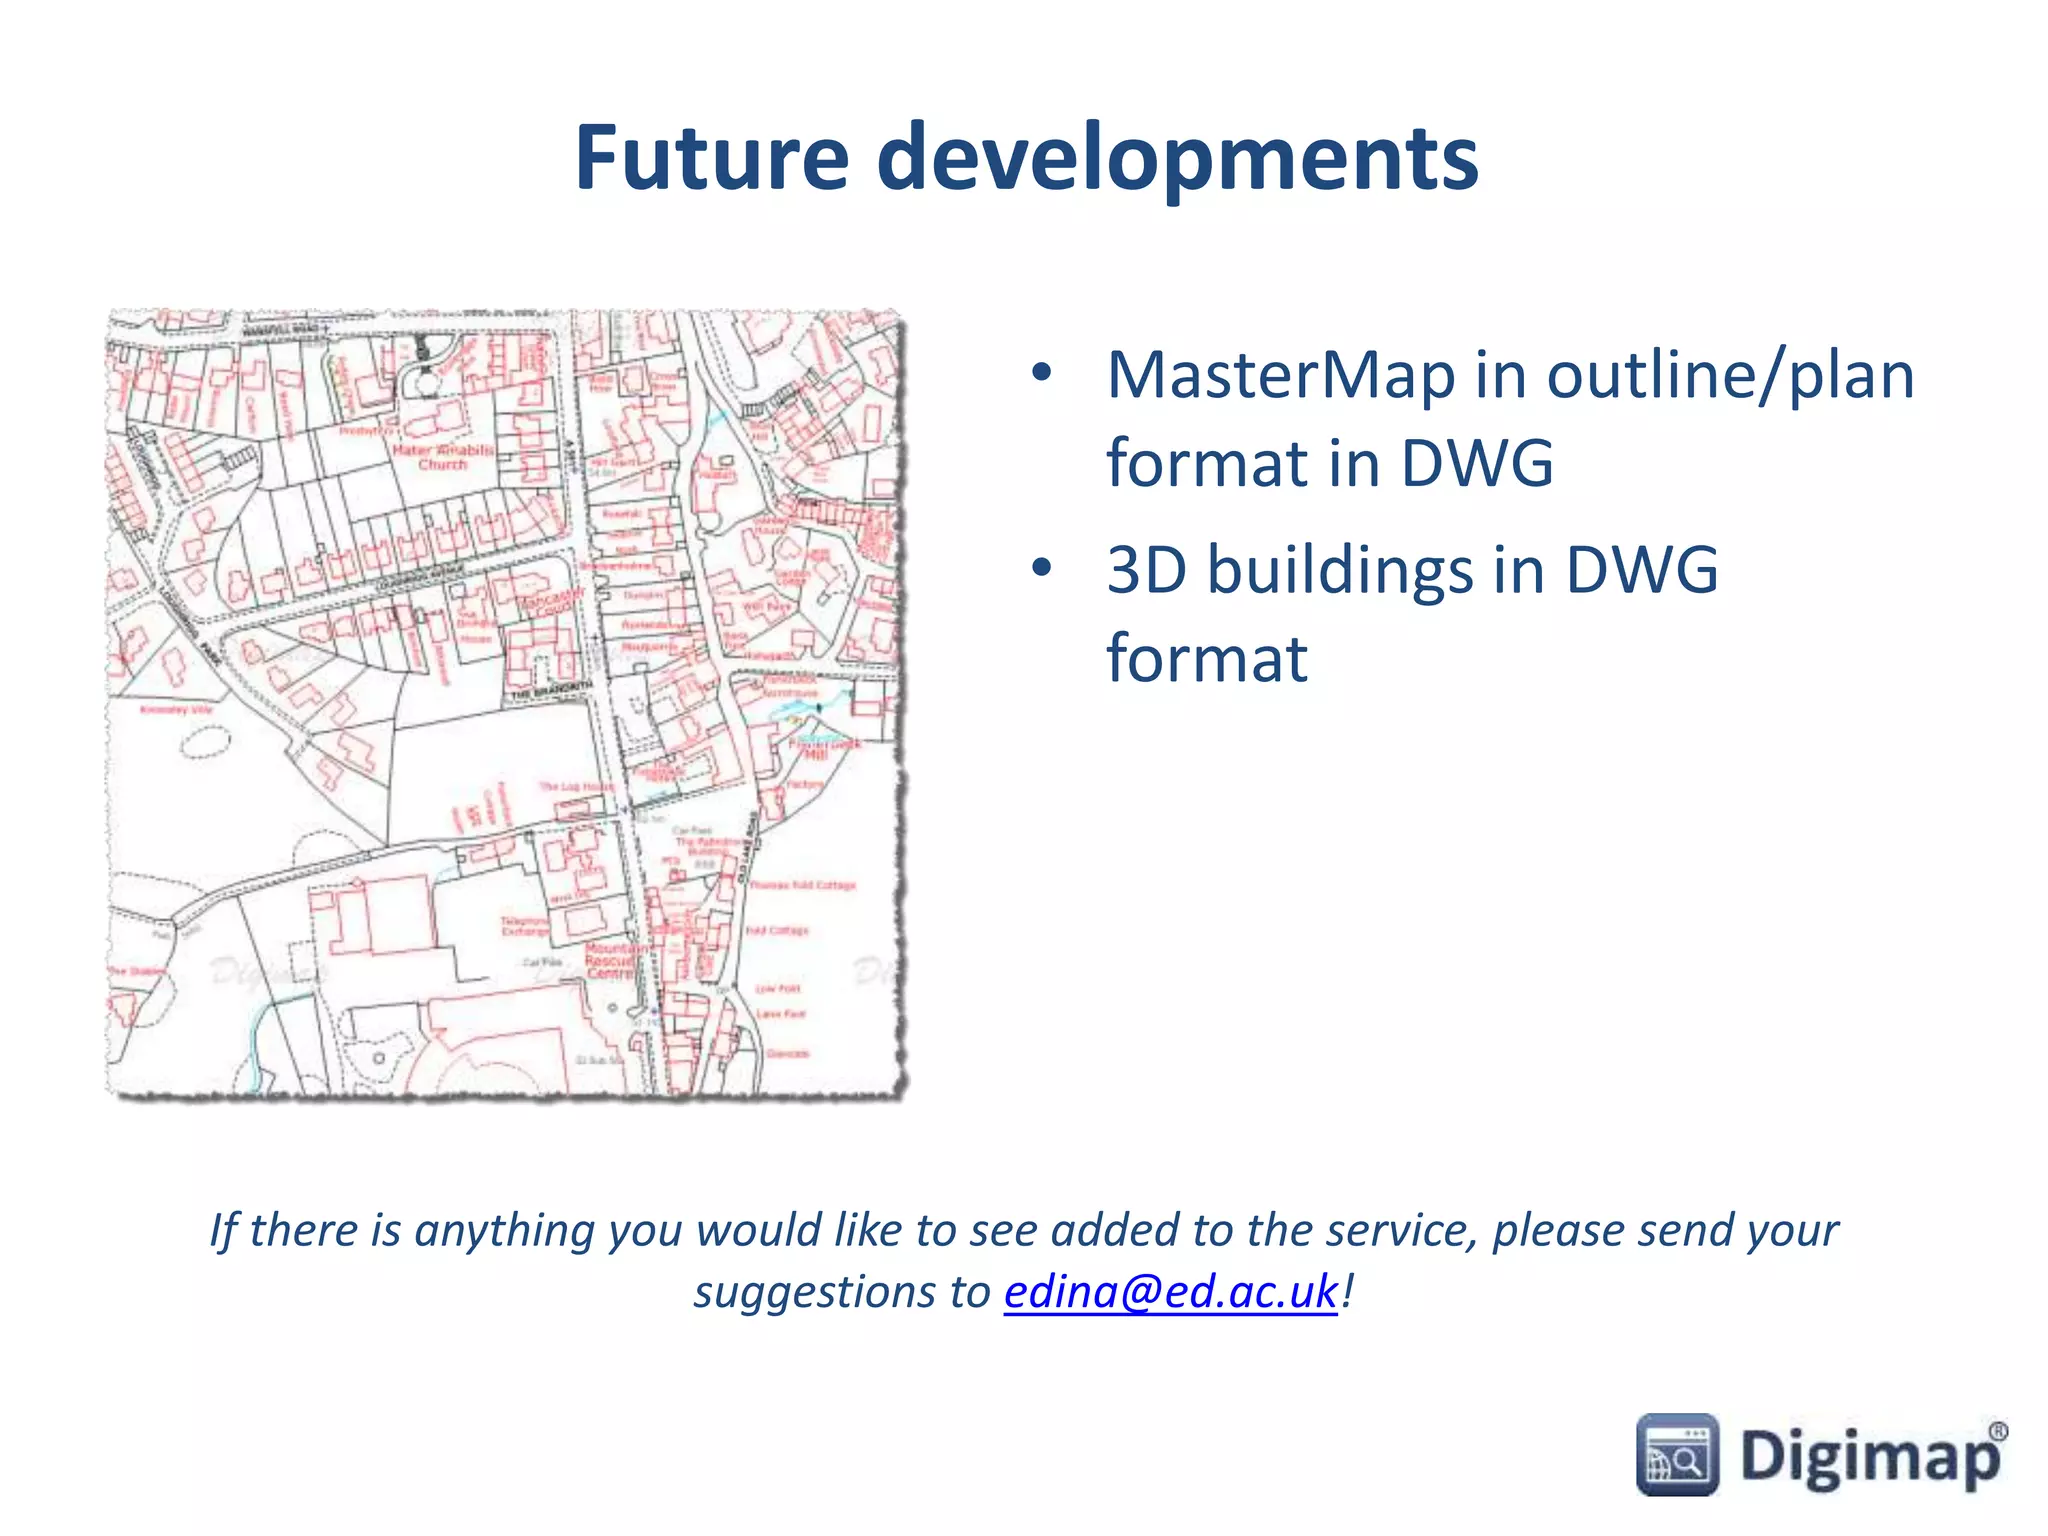
![What data is available in CAD format?
• Vector datasets:
– VectorMap Local [DWG]
– MasterMap Topography Layer [DWG]
• Height datasets:
– Terrain 50 DTM and contours [ASCII, Shape, GML]
– Land-Form PROFILE DTM and contours [DXF]
– Land-Form PANORAMA DTM and contours [DXF]
• Backdrop mapping [TIFF]
– Various products e.g. 1:50,000 raster, all in TIFF format
• Other
– Building Height Attribute: extension to MasterMap Topography
Layer [CSV]](https://image.slidesharecdn.com/26nov2014digimapurbanmapdatacad-141126113152-conversion-gate01/75/Digimap-webinar-Urban-Map-data-for-CAD-3-2048.jpg)
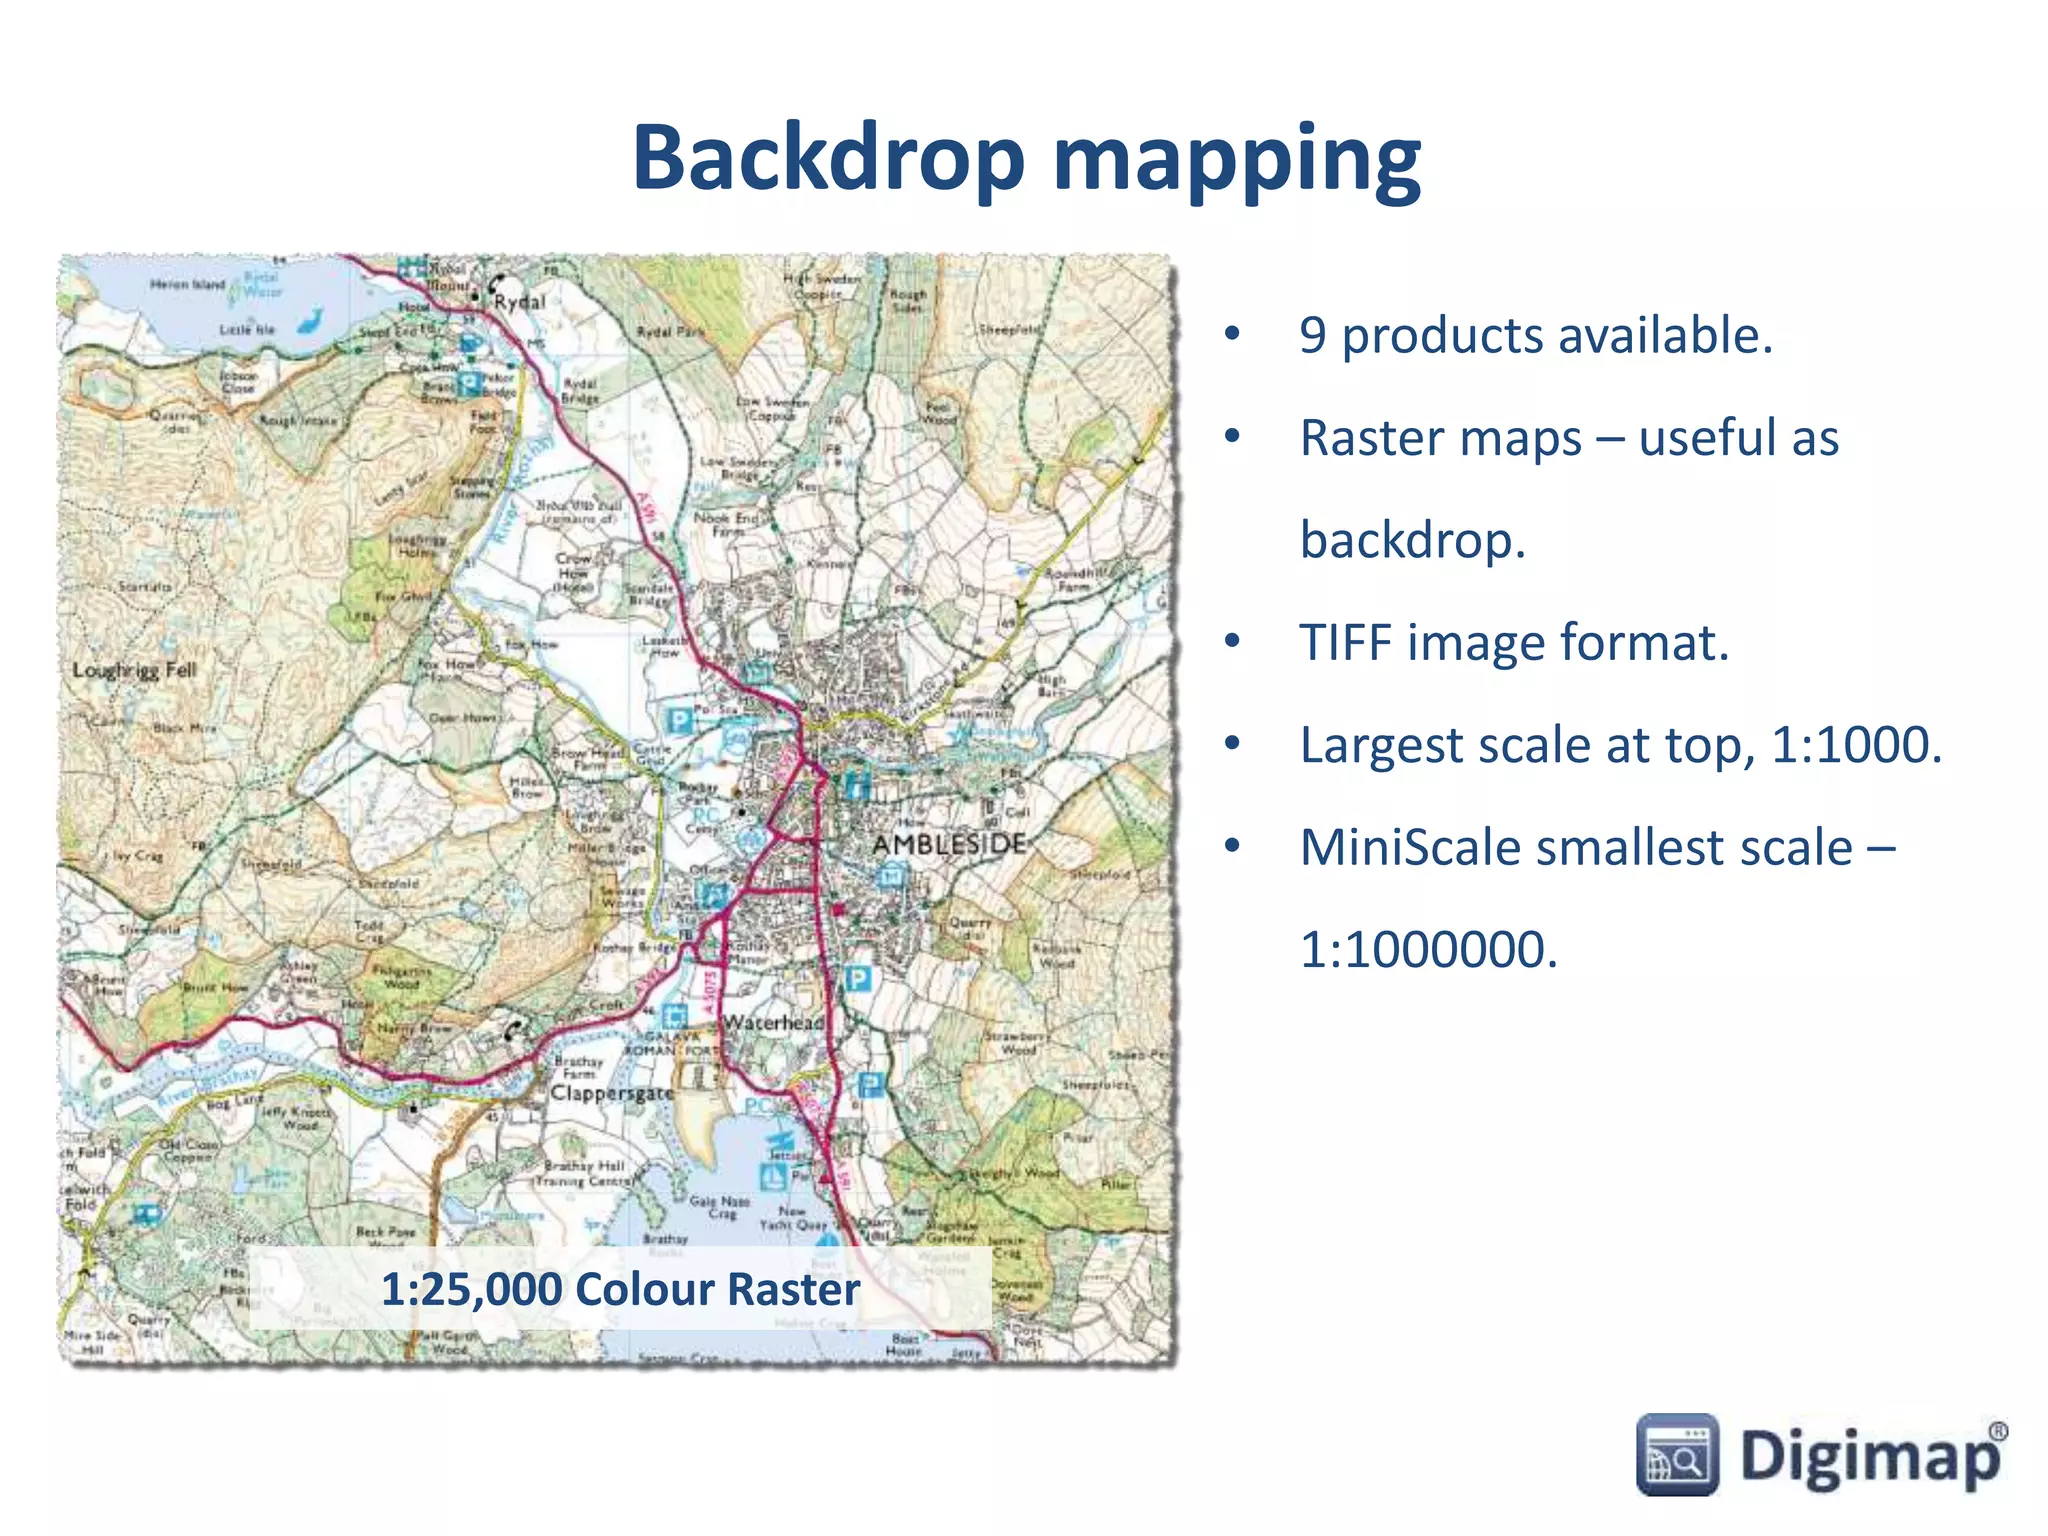
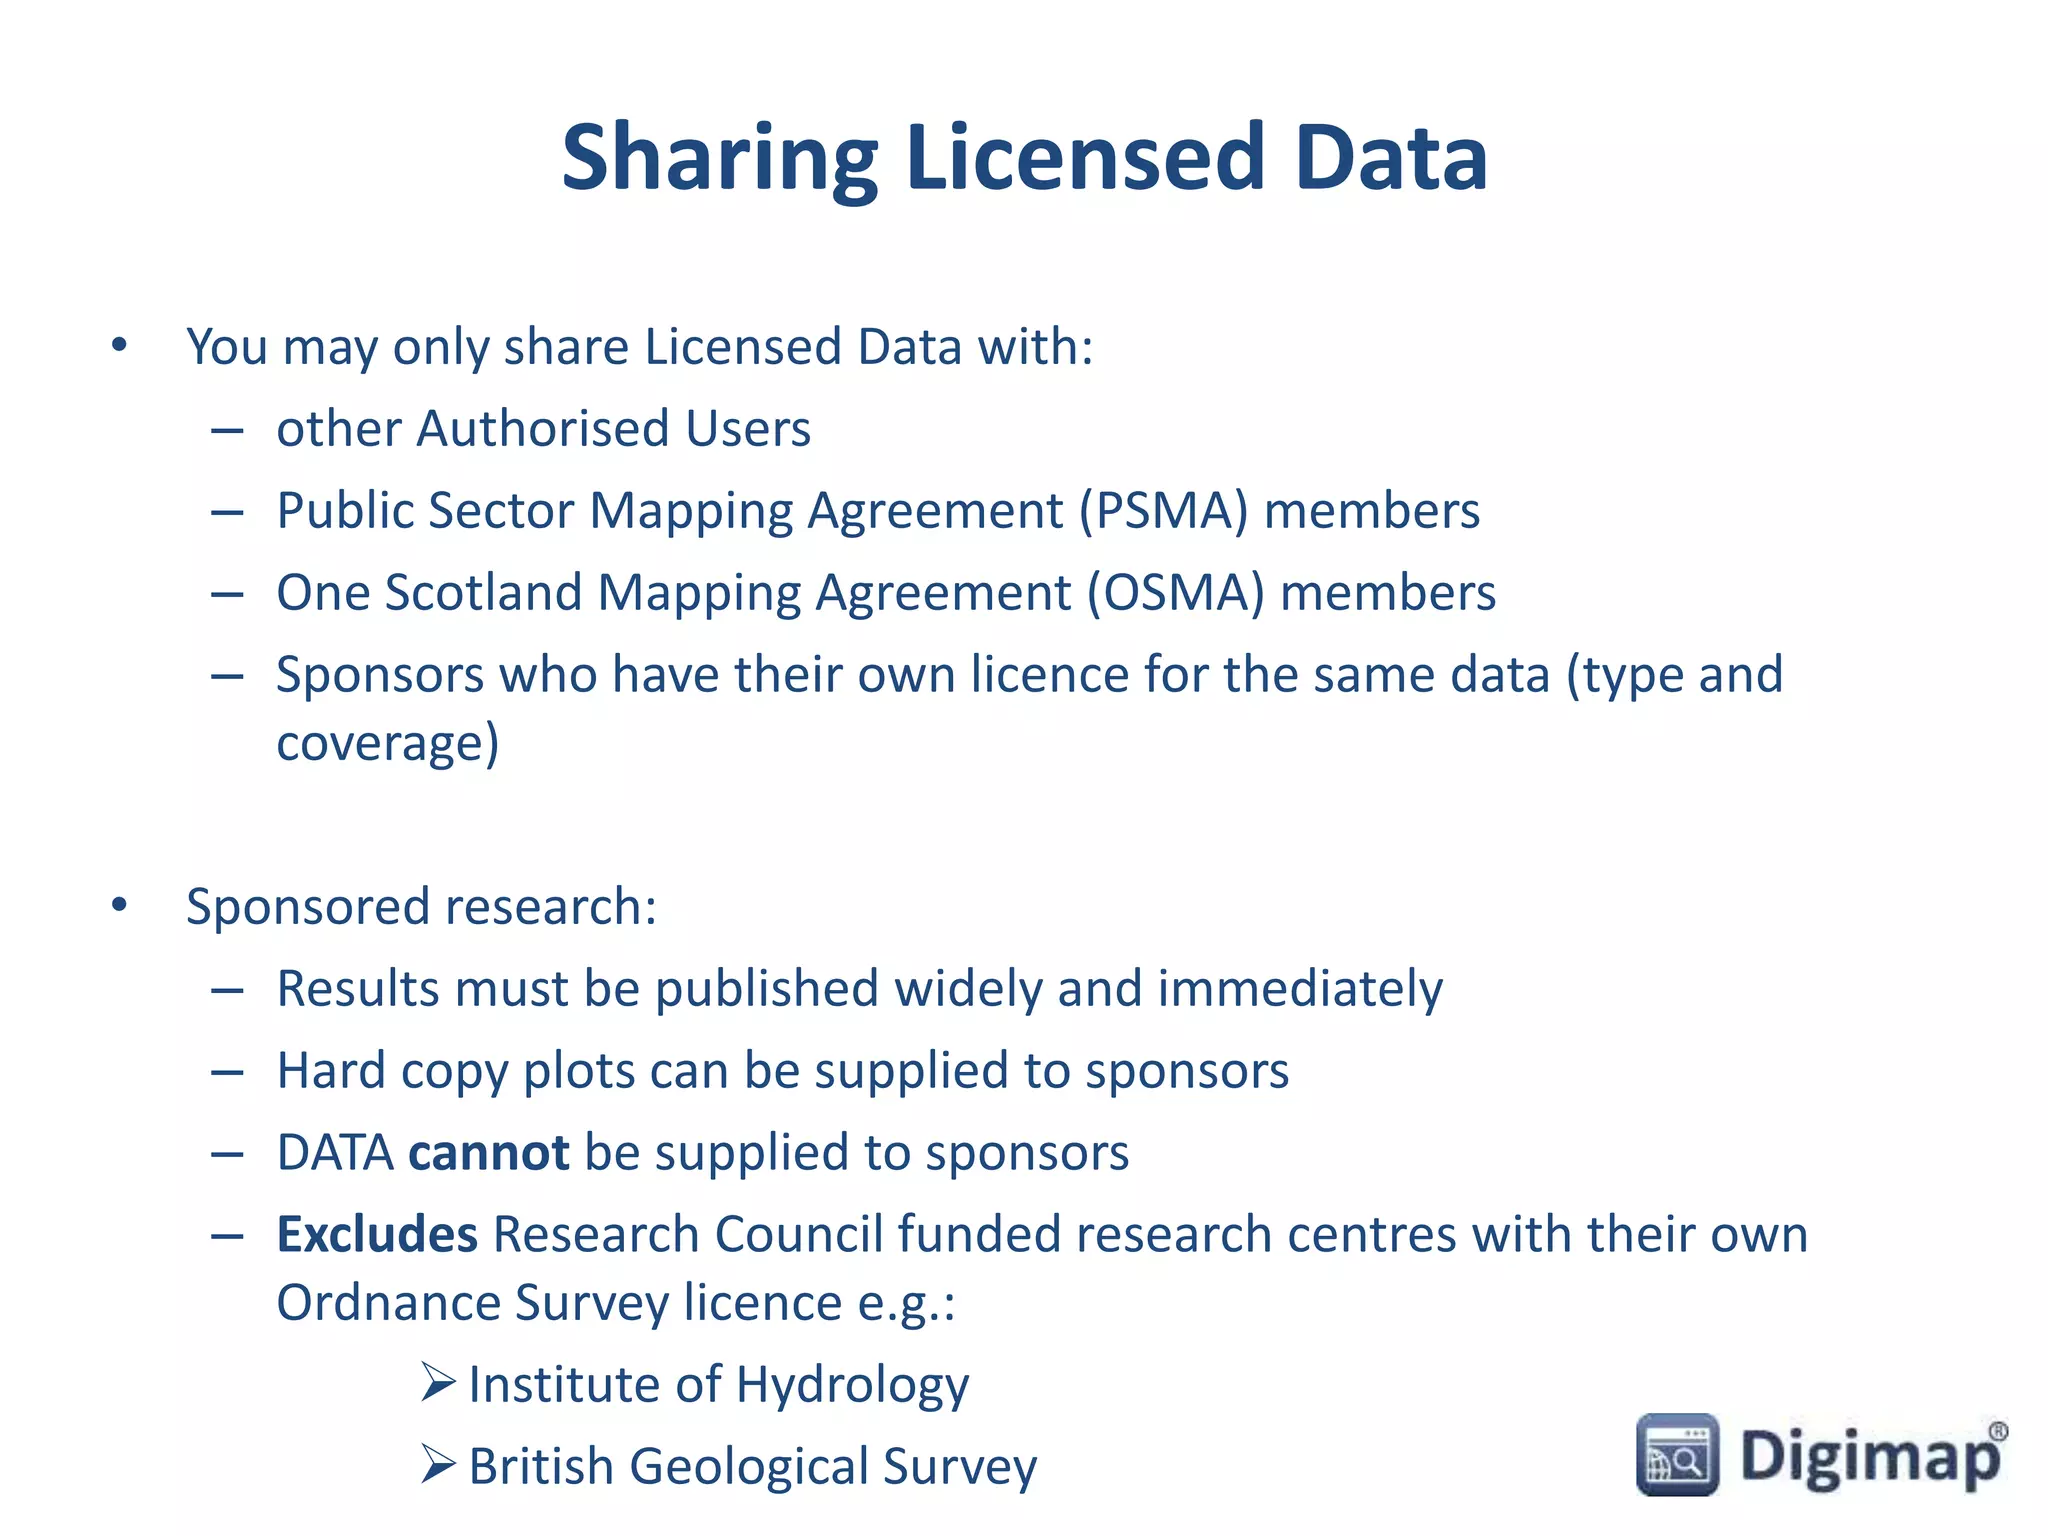
![Height Data
• Various Raster (DTM)
and Vector (contour)
datasets available:
– Terrain 50 [ASCII, Shape,
GML] – replacement for
Land-Form PANORAMA
– Land-Form PROFILE [DXF]
– withdrawn by OS
– Land-Form PANORAMA
[DXF] – withdrawn by OS
• Coming soon:
– OS Terrain 5 –
replacement for Land-
Form PROFILE
Terrain 50 DTM
Terrain 50 Contours](https://image.slidesharecdn.com/26nov2014digimapurbanmapdatacad-141126113152-conversion-gate01/75/Digimap-webinar-Urban-Map-data-for-CAD-6-2048.jpg)
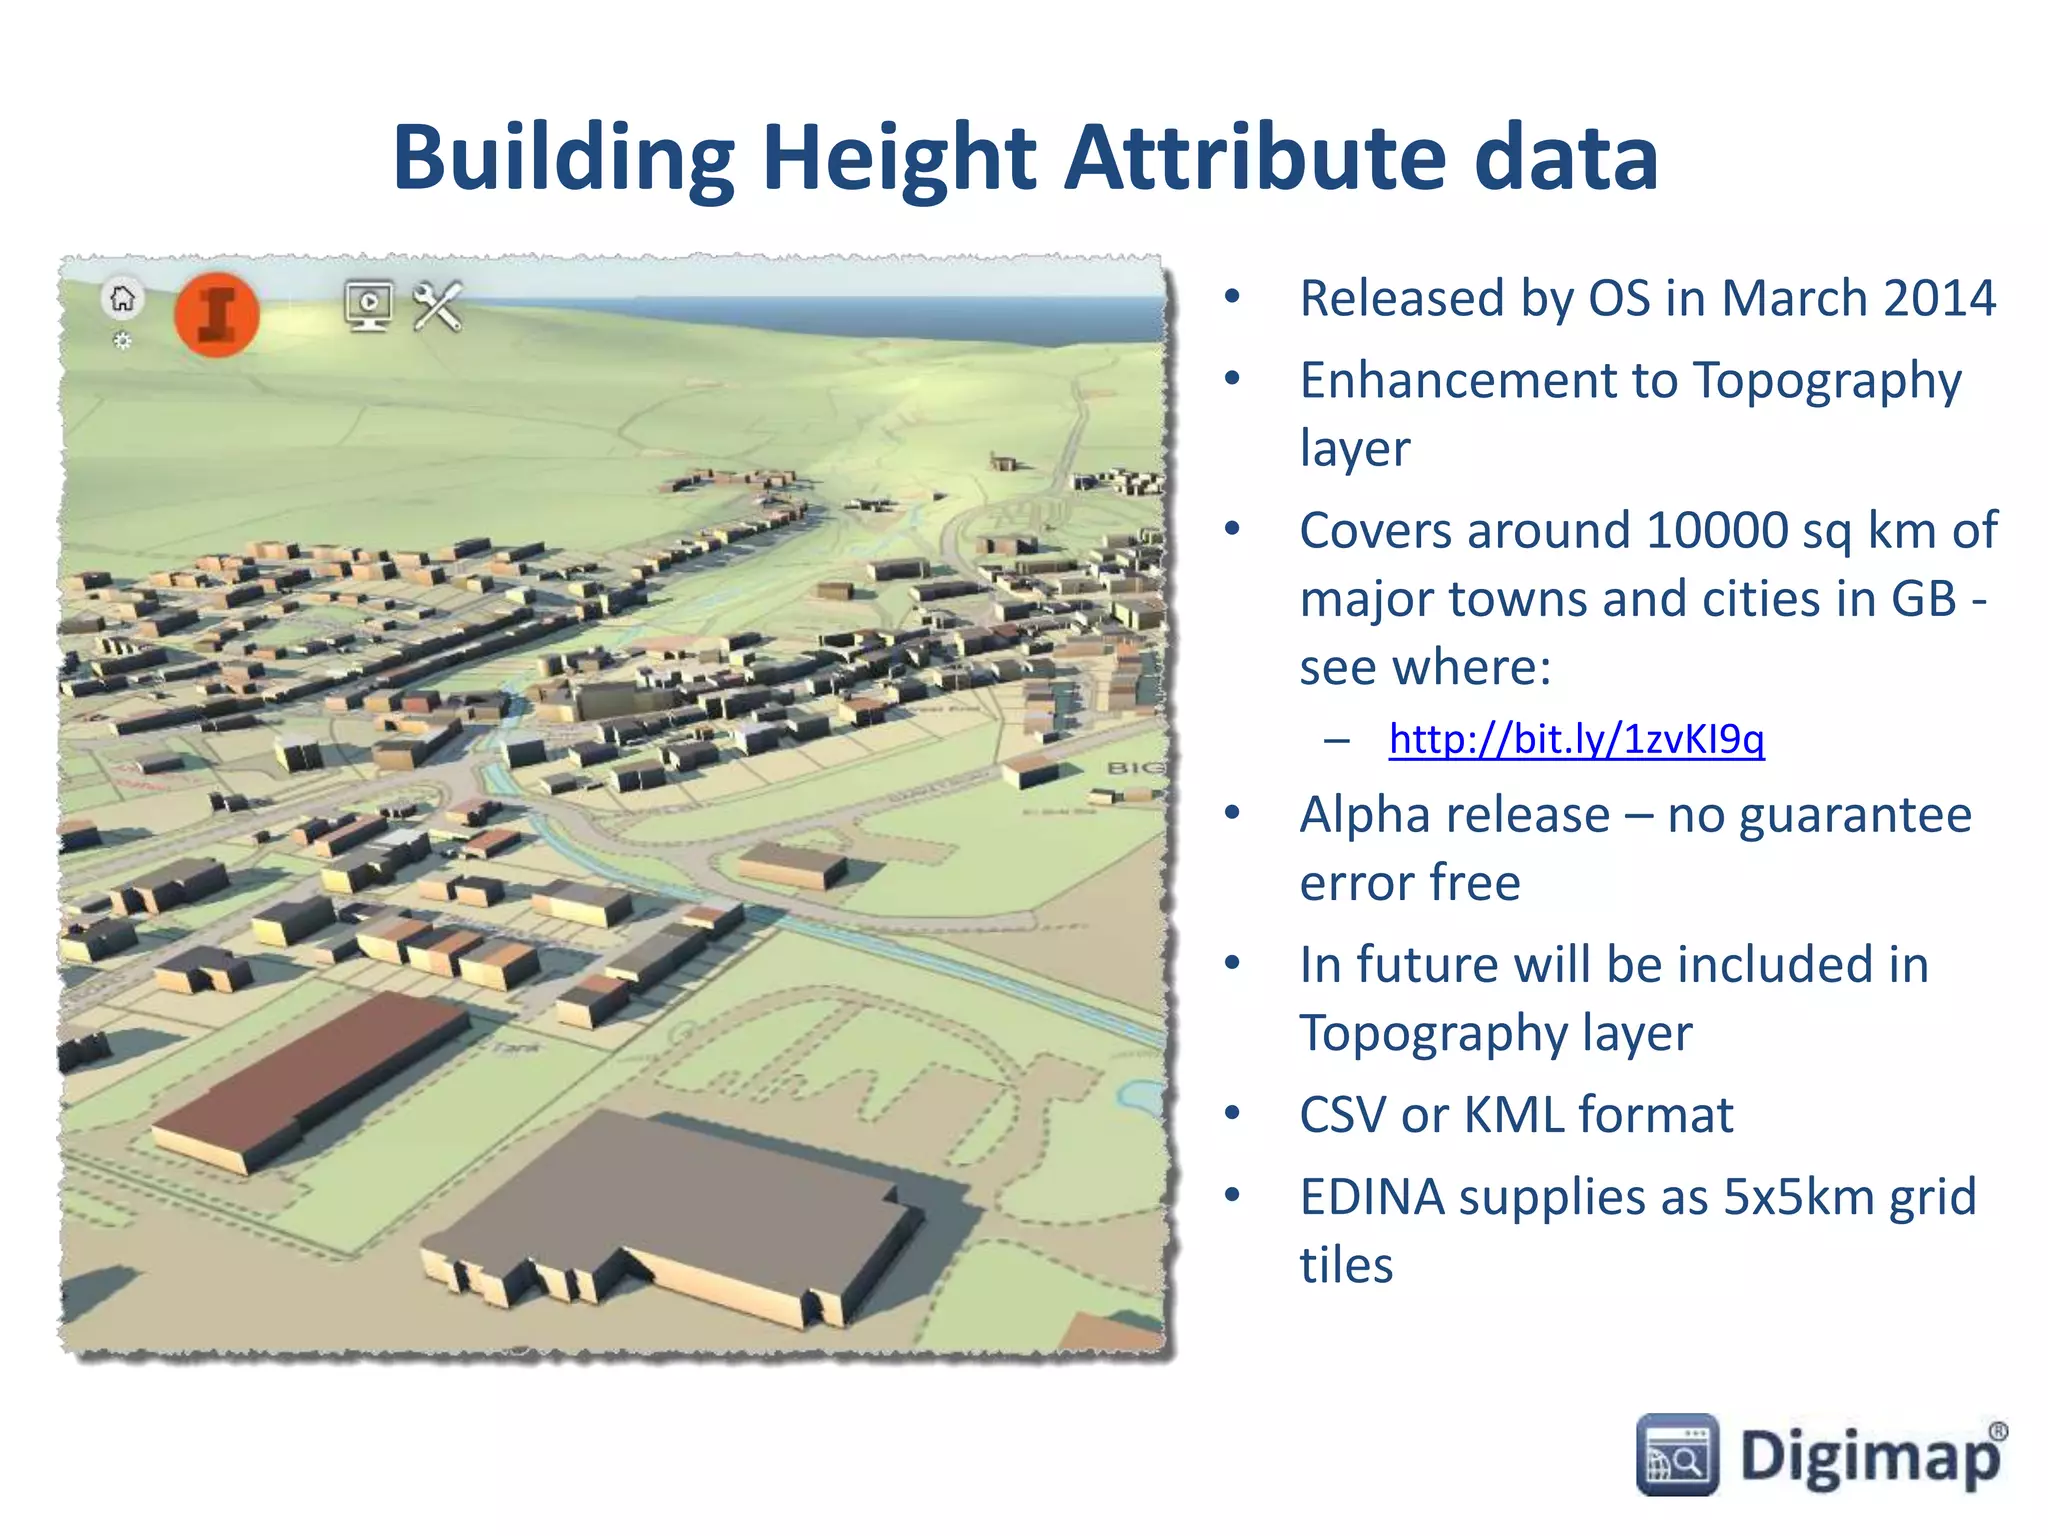
![New datasets – coming soon
PointX [points of interest] OS MasterMap ITN - Urban Paths Theme
OS MasterMap Sites Layer
OS Terrain 5](https://image.slidesharecdn.com/26nov2014digimapurbanmapdatacad-141126113152-conversion-gate01/75/Digimap-webinar-Urban-Map-data-for-CAD-18-2048.jpg)
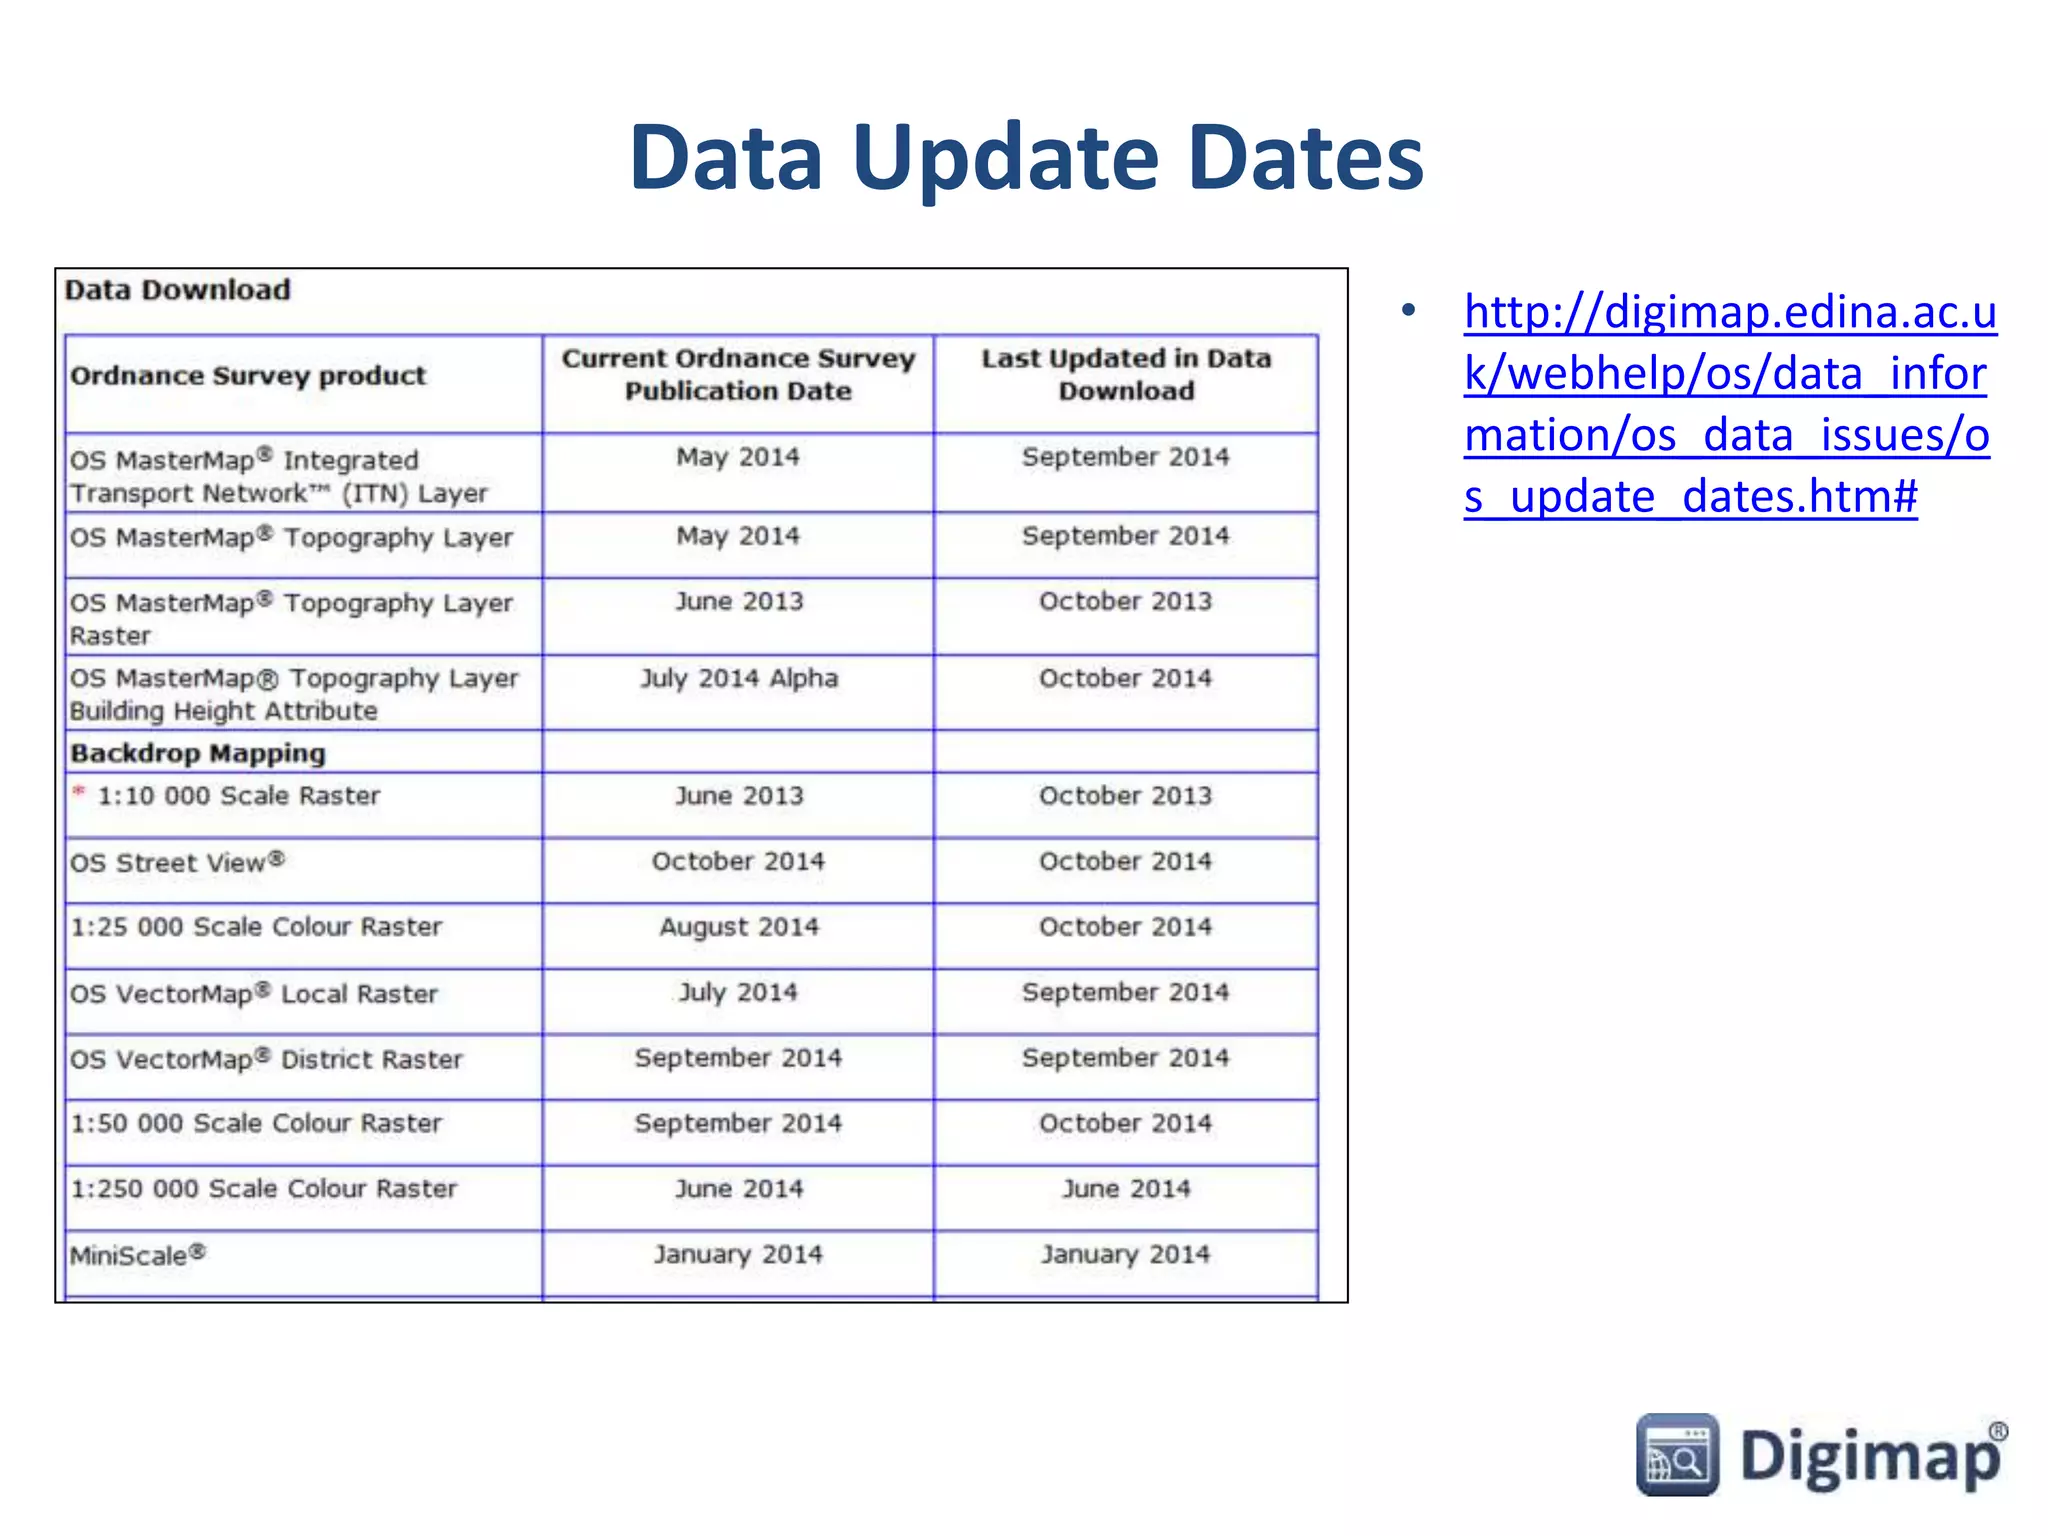
![Publication
• You can publish Licensed Data and materials which contain
Licensed Data
• Subject to some restrictions which are detailed in the Licence
• Includes various publications
• Copyright acknowledgement required:
© Crown Copyright and Database Right [insert date]. Ordnance
Survey (Digimap Licence)
– Copyright acknowledgement is included on all maps printed from Digimap
Collections.
– Remember to include copyright acknowledgement if you download data
from Digimap and create maps!](https://image.slidesharecdn.com/26nov2014digimapurbanmapdatacad-141126113152-conversion-gate01/75/Digimap-webinar-Urban-Map-data-for-CAD-20-2048.jpg)

The document provides detailed information about urban map data available in CAD format, including various vector and height datasets, as well as backdrop mapping options. It outlines how to download and utilize the data in GIS/CAD environments, while also discussing copyright considerations and sharing restrictions for licensed data. Future developments and available support resources are also mentioned.