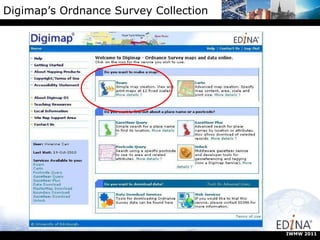
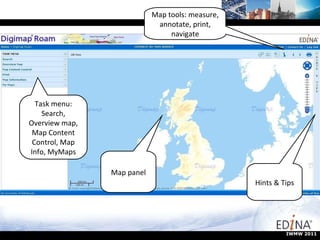
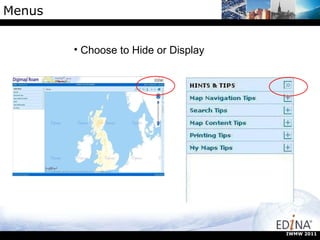
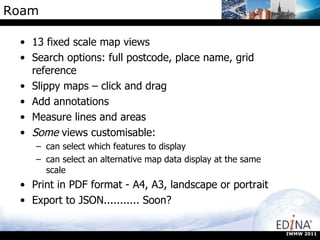
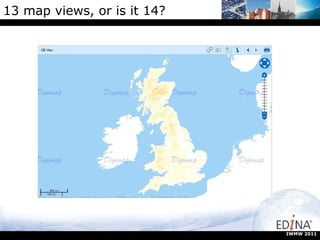
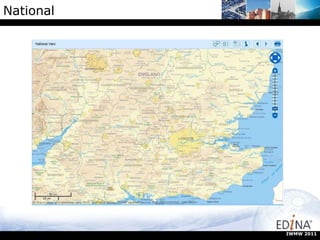
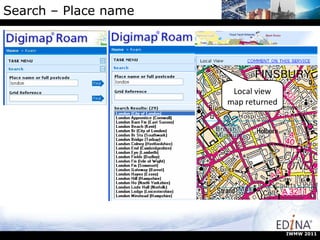
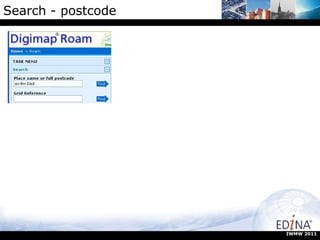
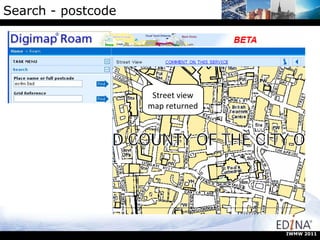
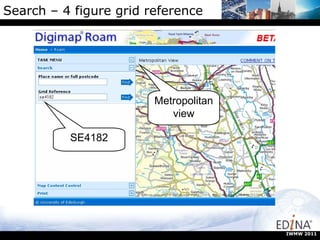
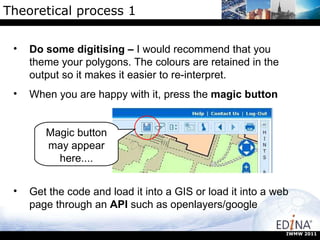
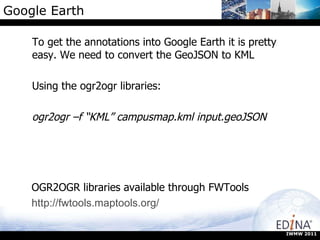
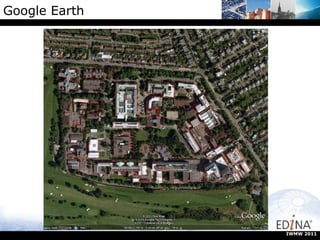
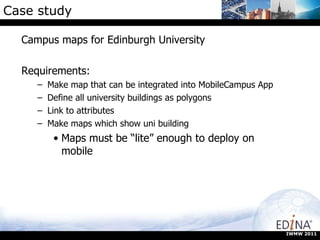
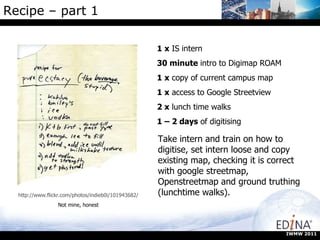
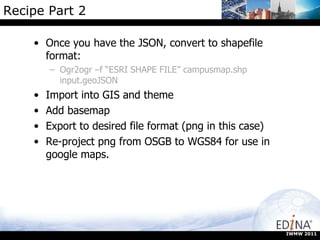
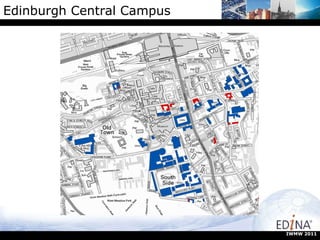
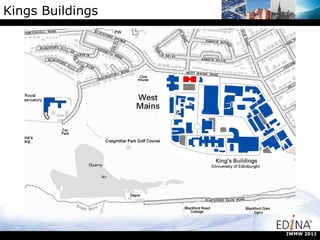
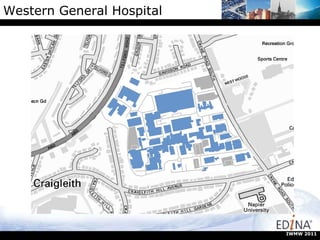
Campus Maps - Plan A IWMW 2011 Who Digimap ROAM Questions Conclusions 0 90 Confession Next Steps Practical
Digimap’s Ordnance Survey Collection IWMW 2011
Map panel Map tools: measure, annotate, print, navigate Hints & Tips Task menu: Search, Overview map, Map Content Control, Map Info, MyMaps IWMW 2011
Menus Choose to Hide or Display IWMW 2011
Roam 13 fixed scale map views Search options: full postcode, place name, grid reference Slippy maps – click and drag Add annotations Measure lines and areas Some  views customisable: can select which features to display can select an alternative map data display at the same scale Print in PDF format - A4, A3, landscape or portrait Export to JSON........... Soon? IWMW 2011
13 map views, or is it 14? IWMW 2011
National IWMW 2011
Regional IWMW 2011
County IWMW 2011
Metropolitan IWMW 2011
City IWMW 2011
District IWMW 2011
Local Plus IWMW 2011
Local IWMW 2011
Neighbourhood IWMW 2011
Street IWMW 2011
Detailed IWMW 2011
Plan Digimap Training Workshops
Search – Place name IWMW 2011
Search – Place name London is not a unique search term, you get to select the instance that you want to view IWMW 2011
Search – Place name IWMW 2011 Local view map returned
Search - postcode IWMW 2011
Search - postcode  Street view map returned IWMW 2011
Search – 4 figure grid reference Metropolitanview SE4182 IWMW 2011
Map Information Map product, Coordinates, Print scale IWMW 2011
Navigation Zoom in/out Fishbone Double click to zoom in Scroll wheel on mouse Drag zoom Pan Click and drag the map Compass Full extent / Previous / Next views IWMW 2011
Map Content Control Feature selection available in 7 views: Plan Detailed Street Neighbourhood District City Metropolitan 2 types of mapping types  RASTER  and  VECTOR List of layers IWMW 2011
Map Content Control Uncheck boxes to remove layers IWMW 2011
Map Content Control Alternative representation is available in 4 views, style the map for a specific purpose You can select alternative themes here IWMW 2011
Map Information Map product, Coordinates, Print scale IWMW 2011
Measurement Tools Tools to measure distance/area of map features available  IWMW 2011
Measurement tools Click the distance tool to activate Click at each point on the map – a pink line is added Double click at last point Distance given in tools box IWMW 2011
Measurement tools Click the area tool to activate Click at each point of your area – a pink shaded area is added Double click at last point Area given in tools box IWMW 2011
Annotations tools Tools to add lines, shapes, text and labels to your maps available IWMW 2011
Annotation tools Toolbar appears at the top of the screen – can be moved around Main options to add annotations in the Draw & Create area - add:  Add   symbols, text, lines, polygons, pre-defined shapes Annotations remain on your map at the same scale as you zoom in and out Annotations appear on your PDF map print IWMW 2011
Sample of annotations IWMW 2011
Print Print icon available at top right Opens in new window IWMW 2011
Print add gridlines, title option to include annotations move map around in preview print A3/A4 landscape or portrait IWMW 2011
PDF print IWMW 2011
Saving maps Click Save current map, enter a Map title, Click Ok Available whenever you login Saving annotations – soon...... IWMW 2011
Making a Campus Map Confession time  – at the present you cant actually do what I am about to demonstrate, but we hope to implement this soon and welcome feedback on what would be useful to web. IWMW 2011
Theoretical process 1 Magic button may appear here.... IWMW 2011 Do some digitising –  I would recommend that you theme your polygons. The colours are retained in the output so it makes it easier to re-interpret. When you are happy with it, press the  magic button Get the code and load it into a GIS or load it into a web page through an  API  such as openlayers/google
Practical Onto the practical exercise Familiarising yourself with Digimap ROAM This should take around 30 minutes Then we will look at what we can do with the output. IWMW 2011
After the magic button? Well, this is the bit has still to be decided and we want your help. IWMW 2011
Theoretical process 1 Magic button may appear here.... IWMW 2011 Do some digitising –  I would recommend that you theme your polygons. The colours are retained in the output so it makes it easier to re-interpret. When you are happy with it, press the  magic button Get the code and load it into a GIS or load it into a web page through an  API  such as openlayers/google
What to do next? Now we have digitised the buildings and grabbed the GeoJSON through the “magic button” what options are there? Here we will outline 3 options: Google Earth Image files as output (for print or Google Earth) OpenLayers dynamic map There may be other options/needs. If you have any thoughts, we would like to hear them. IWMW 2011
Google Earth To get the annotations into Google Earth it is pretty easy. We need to convert the GeoJSON to KML Using the ogr2ogr libraries: ogr2ogr –f “KML” campusmap.kml input.geoJSON IWMW 2011 OGR2OGR libraries available through FWTools http://fwtools.maptools.org/
Google Earth IWMW 2011
Case study Campus maps for Edinburgh University Requirements: Make map that can be integrated into MobileCampus App Define all university buildings as polygons Link to attributes Make maps which show uni building Maps must be “lite” enough to deploy on mobile IWMW 2011
Recipe – part 1  1 x  IS intern 30 minute  intro to Digimap ROAM 1 x  copy of current campus map 1 x  access to Google Streetview 2 x  lunch time walks 1 – 2 days  of digitising http://www.flickr.com/photos/indieb0i/101943682/ Not mine, honest Take intern and train on how to digitise, set intern loose and copy existing map, checking it is correct with google streetmap, Openstreetmap and ground truthing (lunchtime walks). IWMW 2011
Recipe Part 2 Once you have the JSON, convert to shapefile format:  Ogr2ogr –f “ESRI SHAPE FILE” campusmap.shp input.geoJSON Import into GIS and theme Add basemap Export to desired file format (png in this case) Re-project png from OSGB to WGS84 for use in google maps. IWMW 2011
Edinburgh Central Campus IWMW 2011
Kings Buildings IWMW 2011
Western General Hospital IWMW 2011
Easter Bush Issue with the buildings here, they are new and don’t appear on OS maps yet. IWMW 2011
Doing more with GIS/OpenLayers QGIS  is a free, open source piece of software that is easy to use and well documented We will try to get our  shapefile  loaded and then export it in some  openlayers  code that can be dropped into a webpage to give an  interactive map . http://www.qgis.org IWMW 2011
QGIS main screen Add  vector layer Layer list Map  Window IWMW 2011
Plugins IWMW 2011
OGR2Layer Set an output folder Set map size IWMW 2011
OpenLayers Code <script src=&quot;http://www.openlayers.org/api/OpenLayers.js&quot;></script> <script type=&quot;text/javascript&quot;> var map, selectsControls function init(){ var option = { projection: new OpenLayers.Projection(&quot;EPSG:900913&quot;), displayProjection: new OpenLayers.Projection(&quot;EPSG:4326&quot;) }; map = new OpenLayers.Map('map', option); olmapnik = new OpenLayers.Layer.OSM(&quot;OpenStreetMap&quot;, &quot;http://tile.openstreetmap.org/${z}/${x}/${y}.png&quot;); map.addLayer(olmapnik); map.setBaseLayer(olmapnik); var ls= new OpenLayers.Control.LayerSwitcher(); map.addControl(ls); ls.maximizeControl(); map.addControl(new OpenLayers.Control.Scale()); var OGRGeoJSON_style = new OpenLayers.Style( OpenLayers.Util.applyDefaults({ strokeColor: &quot;${getStrokeColor}&quot;, strokeOpacity: 1, strokeWidth: &quot;${getLineWidth}&quot;, fillColor: &quot;${getFillColor}&quot;, fillOpacity: 1 } //START QUERY OGRGeoJSON function onPopupCloseOGRGeoJSON(evt) { selectControl.unselect(selectedFeature); } function onFeatureSelectOGRGeoJSON(feature){ selectedFeature = feature; tableOGRGeoJSON=&quot;<html><meta http-equiv='Content-Type' content='text/html; charset=UTF-8'><body><table><tr><td><b>alignment:</b></td><td><i>&quot;+feature.attributes.alignment+&quot;</i></td></tr><tr><td><b>fcode:</b></td><td><i>&quot;+feature.attributes.fcode+&quot;</i></td></tr><tr><td><b>fillColor:</b></td><td><i>&quot;+feature.attributes.fillColor+&quot;</i></td></tr><tr><td><b>fillOpacity:</b></td><td><i>&quot;+feature.attributes.fillOpacity+&quot;</i></td></tr><tr><td><b>fontColor:</b></td><td><i>&quot;+feature.attributes.fontColor+&quot;</i></td></tr><tr><td><b>fontFamily:</b></td><td><i>&quot;+feature.attributes.fontFamily+&quot;</i></td></tr><tr><td><b>fontSize:</b></td><td><i>&quot;+feature.attributes.fontSize+&quot;</i></td></tr><tr><td><b>fontWeight:</b></td><td><i>&quot;+feature.attributes.fontWeight+&quot;</i></td></tr><tr><td><b>internal:</b></td><td><i>&quot;+feature.attributes.internal+&quot;</i></td></tr><tr><td><..........></td></tr></table></body></html>&quot;; popup = new OpenLayers.Popup.FramedCloud(&quot;chicken&quot;, feature.geometry.getBounds().getCenterLonLat(), new OpenLayers.Size(1000,500), tableOGRGeoJSON, null, true, onPopupCloseOGRGeoJSON ); feature.popup = popup; map.addPopup(popup); } function onFeatureUnselectOGRGeoJSON(feature) { map.removePopup(feature.popup); feature.popup.destroy(); feature.popup = null; } //STOP QUERY OGRGeoJSON IWMW 2011
Output (OSM) No coded written Can add in attributes Can apply styles to data in QGIS Works in all good browsers (so not IE) IWMW 2011
Output (Digimap OpenStream) Grab the example code from OpenStream site Copy the variables to the beginning of the script Add a new OpenLayer.map to the index.html Discover the projections dont match Panic! Find someone clever Copy their code (function proj2.js) IWMW 2011
Useful Links http://edina.ac.uk http://edina.ac.uk/digimap/ http://www.gogeo.ac.uk/ http://openstream.edina.ac.uk/registration/ http://www.qgis.org http://fwtools.maptools.org/ IWMW 2011

IWMW Campus Maps Workshop

  • 1.
    Campus Maps -Plan A IWMW 2011 Who Digimap ROAM Questions Conclusions 0 90 Confession Next Steps Practical
  • 2.
    Digimap’s Ordnance SurveyCollection IWMW 2011
  • 3.
    Map panel Maptools: measure, annotate, print, navigate Hints & Tips Task menu: Search, Overview map, Map Content Control, Map Info, MyMaps IWMW 2011
  • 4.
    Menus Choose toHide or Display IWMW 2011
  • 5.
    Roam 13 fixedscale map views Search options: full postcode, place name, grid reference Slippy maps – click and drag Add annotations Measure lines and areas Some views customisable: can select which features to display can select an alternative map data display at the same scale Print in PDF format - A4, A3, landscape or portrait Export to JSON........... Soon? IWMW 2011
  • 6.
    13 map views,or is it 14? IWMW 2011
  • 7.
  • 8.
  • 9.
  • 10.
  • 11.
  • 12.
  • 13.
  • 14.
  • 15.
  • 16.
  • 17.
  • 18.
  • 19.
    Search – Placename IWMW 2011
  • 20.
    Search – Placename London is not a unique search term, you get to select the instance that you want to view IWMW 2011
  • 21.
    Search – Placename IWMW 2011 Local view map returned
  • 22.
  • 23.
    Search - postcode Street view map returned IWMW 2011
  • 24.
    Search – 4figure grid reference Metropolitanview SE4182 IWMW 2011
  • 25.
    Map Information Mapproduct, Coordinates, Print scale IWMW 2011
  • 26.
    Navigation Zoom in/outFishbone Double click to zoom in Scroll wheel on mouse Drag zoom Pan Click and drag the map Compass Full extent / Previous / Next views IWMW 2011
  • 27.
    Map Content ControlFeature selection available in 7 views: Plan Detailed Street Neighbourhood District City Metropolitan 2 types of mapping types RASTER and VECTOR List of layers IWMW 2011
  • 28.
    Map Content ControlUncheck boxes to remove layers IWMW 2011
  • 29.
    Map Content ControlAlternative representation is available in 4 views, style the map for a specific purpose You can select alternative themes here IWMW 2011
  • 30.
    Map Information Mapproduct, Coordinates, Print scale IWMW 2011
  • 31.
    Measurement Tools Toolsto measure distance/area of map features available IWMW 2011
  • 32.
    Measurement tools Clickthe distance tool to activate Click at each point on the map – a pink line is added Double click at last point Distance given in tools box IWMW 2011
  • 33.
    Measurement tools Clickthe area tool to activate Click at each point of your area – a pink shaded area is added Double click at last point Area given in tools box IWMW 2011
  • 34.
    Annotations tools Toolsto add lines, shapes, text and labels to your maps available IWMW 2011
  • 35.
    Annotation tools Toolbarappears at the top of the screen – can be moved around Main options to add annotations in the Draw & Create area - add: Add symbols, text, lines, polygons, pre-defined shapes Annotations remain on your map at the same scale as you zoom in and out Annotations appear on your PDF map print IWMW 2011
  • 36.
  • 37.
    Print Print iconavailable at top right Opens in new window IWMW 2011
  • 38.
    Print add gridlines,title option to include annotations move map around in preview print A3/A4 landscape or portrait IWMW 2011
  • 39.
  • 40.
    Saving maps ClickSave current map, enter a Map title, Click Ok Available whenever you login Saving annotations – soon...... IWMW 2011
  • 41.
    Making a CampusMap Confession time – at the present you cant actually do what I am about to demonstrate, but we hope to implement this soon and welcome feedback on what would be useful to web. IWMW 2011
  • 42.
    Theoretical process 1Magic button may appear here.... IWMW 2011 Do some digitising – I would recommend that you theme your polygons. The colours are retained in the output so it makes it easier to re-interpret. When you are happy with it, press the magic button Get the code and load it into a GIS or load it into a web page through an API such as openlayers/google
  • 43.
    Practical Onto thepractical exercise Familiarising yourself with Digimap ROAM This should take around 30 minutes Then we will look at what we can do with the output. IWMW 2011
  • 44.
    After the magicbutton? Well, this is the bit has still to be decided and we want your help. IWMW 2011
  • 45.
    Theoretical process 1Magic button may appear here.... IWMW 2011 Do some digitising – I would recommend that you theme your polygons. The colours are retained in the output so it makes it easier to re-interpret. When you are happy with it, press the magic button Get the code and load it into a GIS or load it into a web page through an API such as openlayers/google
  • 46.
    What to donext? Now we have digitised the buildings and grabbed the GeoJSON through the “magic button” what options are there? Here we will outline 3 options: Google Earth Image files as output (for print or Google Earth) OpenLayers dynamic map There may be other options/needs. If you have any thoughts, we would like to hear them. IWMW 2011
  • 47.
    Google Earth Toget the annotations into Google Earth it is pretty easy. We need to convert the GeoJSON to KML Using the ogr2ogr libraries: ogr2ogr –f “KML” campusmap.kml input.geoJSON IWMW 2011 OGR2OGR libraries available through FWTools http://fwtools.maptools.org/
  • 48.
  • 49.
    Case study Campusmaps for Edinburgh University Requirements: Make map that can be integrated into MobileCampus App Define all university buildings as polygons Link to attributes Make maps which show uni building Maps must be “lite” enough to deploy on mobile IWMW 2011
  • 50.
    Recipe – part1 1 x IS intern 30 minute intro to Digimap ROAM 1 x copy of current campus map 1 x access to Google Streetview 2 x lunch time walks 1 – 2 days of digitising http://www.flickr.com/photos/indieb0i/101943682/ Not mine, honest Take intern and train on how to digitise, set intern loose and copy existing map, checking it is correct with google streetmap, Openstreetmap and ground truthing (lunchtime walks). IWMW 2011
  • 51.
    Recipe Part 2Once you have the JSON, convert to shapefile format: Ogr2ogr –f “ESRI SHAPE FILE” campusmap.shp input.geoJSON Import into GIS and theme Add basemap Export to desired file format (png in this case) Re-project png from OSGB to WGS84 for use in google maps. IWMW 2011
  • 52.
  • 53.
  • 54.
  • 55.
    Easter Bush Issuewith the buildings here, they are new and don’t appear on OS maps yet. IWMW 2011
  • 56.
    Doing more withGIS/OpenLayers QGIS is a free, open source piece of software that is easy to use and well documented We will try to get our shapefile loaded and then export it in some openlayers code that can be dropped into a webpage to give an interactive map . http://www.qgis.org IWMW 2011
  • 57.
    QGIS main screenAdd vector layer Layer list Map Window IWMW 2011
  • 58.
  • 59.
    OGR2Layer Set anoutput folder Set map size IWMW 2011
  • 60.
    OpenLayers Code <scriptsrc=&quot;http://www.openlayers.org/api/OpenLayers.js&quot;></script> <script type=&quot;text/javascript&quot;> var map, selectsControls function init(){ var option = { projection: new OpenLayers.Projection(&quot;EPSG:900913&quot;), displayProjection: new OpenLayers.Projection(&quot;EPSG:4326&quot;) }; map = new OpenLayers.Map('map', option); olmapnik = new OpenLayers.Layer.OSM(&quot;OpenStreetMap&quot;, &quot;http://tile.openstreetmap.org/${z}/${x}/${y}.png&quot;); map.addLayer(olmapnik); map.setBaseLayer(olmapnik); var ls= new OpenLayers.Control.LayerSwitcher(); map.addControl(ls); ls.maximizeControl(); map.addControl(new OpenLayers.Control.Scale()); var OGRGeoJSON_style = new OpenLayers.Style( OpenLayers.Util.applyDefaults({ strokeColor: &quot;${getStrokeColor}&quot;, strokeOpacity: 1, strokeWidth: &quot;${getLineWidth}&quot;, fillColor: &quot;${getFillColor}&quot;, fillOpacity: 1 } //START QUERY OGRGeoJSON function onPopupCloseOGRGeoJSON(evt) { selectControl.unselect(selectedFeature); } function onFeatureSelectOGRGeoJSON(feature){ selectedFeature = feature; tableOGRGeoJSON=&quot;<html><meta http-equiv='Content-Type' content='text/html; charset=UTF-8'><body><table><tr><td><b>alignment:</b></td><td><i>&quot;+feature.attributes.alignment+&quot;</i></td></tr><tr><td><b>fcode:</b></td><td><i>&quot;+feature.attributes.fcode+&quot;</i></td></tr><tr><td><b>fillColor:</b></td><td><i>&quot;+feature.attributes.fillColor+&quot;</i></td></tr><tr><td><b>fillOpacity:</b></td><td><i>&quot;+feature.attributes.fillOpacity+&quot;</i></td></tr><tr><td><b>fontColor:</b></td><td><i>&quot;+feature.attributes.fontColor+&quot;</i></td></tr><tr><td><b>fontFamily:</b></td><td><i>&quot;+feature.attributes.fontFamily+&quot;</i></td></tr><tr><td><b>fontSize:</b></td><td><i>&quot;+feature.attributes.fontSize+&quot;</i></td></tr><tr><td><b>fontWeight:</b></td><td><i>&quot;+feature.attributes.fontWeight+&quot;</i></td></tr><tr><td><b>internal:</b></td><td><i>&quot;+feature.attributes.internal+&quot;</i></td></tr><tr><td><..........></td></tr></table></body></html>&quot;; popup = new OpenLayers.Popup.FramedCloud(&quot;chicken&quot;, feature.geometry.getBounds().getCenterLonLat(), new OpenLayers.Size(1000,500), tableOGRGeoJSON, null, true, onPopupCloseOGRGeoJSON ); feature.popup = popup; map.addPopup(popup); } function onFeatureUnselectOGRGeoJSON(feature) { map.removePopup(feature.popup); feature.popup.destroy(); feature.popup = null; } //STOP QUERY OGRGeoJSON IWMW 2011
  • 61.
    Output (OSM) Nocoded written Can add in attributes Can apply styles to data in QGIS Works in all good browsers (so not IE) IWMW 2011
  • 62.
    Output (Digimap OpenStream)Grab the example code from OpenStream site Copy the variables to the beginning of the script Add a new OpenLayer.map to the index.html Discover the projections dont match Panic! Find someone clever Copy their code (function proj2.js) IWMW 2011
  • 63.
    Useful Links http://edina.ac.ukhttp://edina.ac.uk/digimap/ http://www.gogeo.ac.uk/ http://openstream.edina.ac.uk/registration/ http://www.qgis.org http://fwtools.maptools.org/ IWMW 2011