Download to read offline
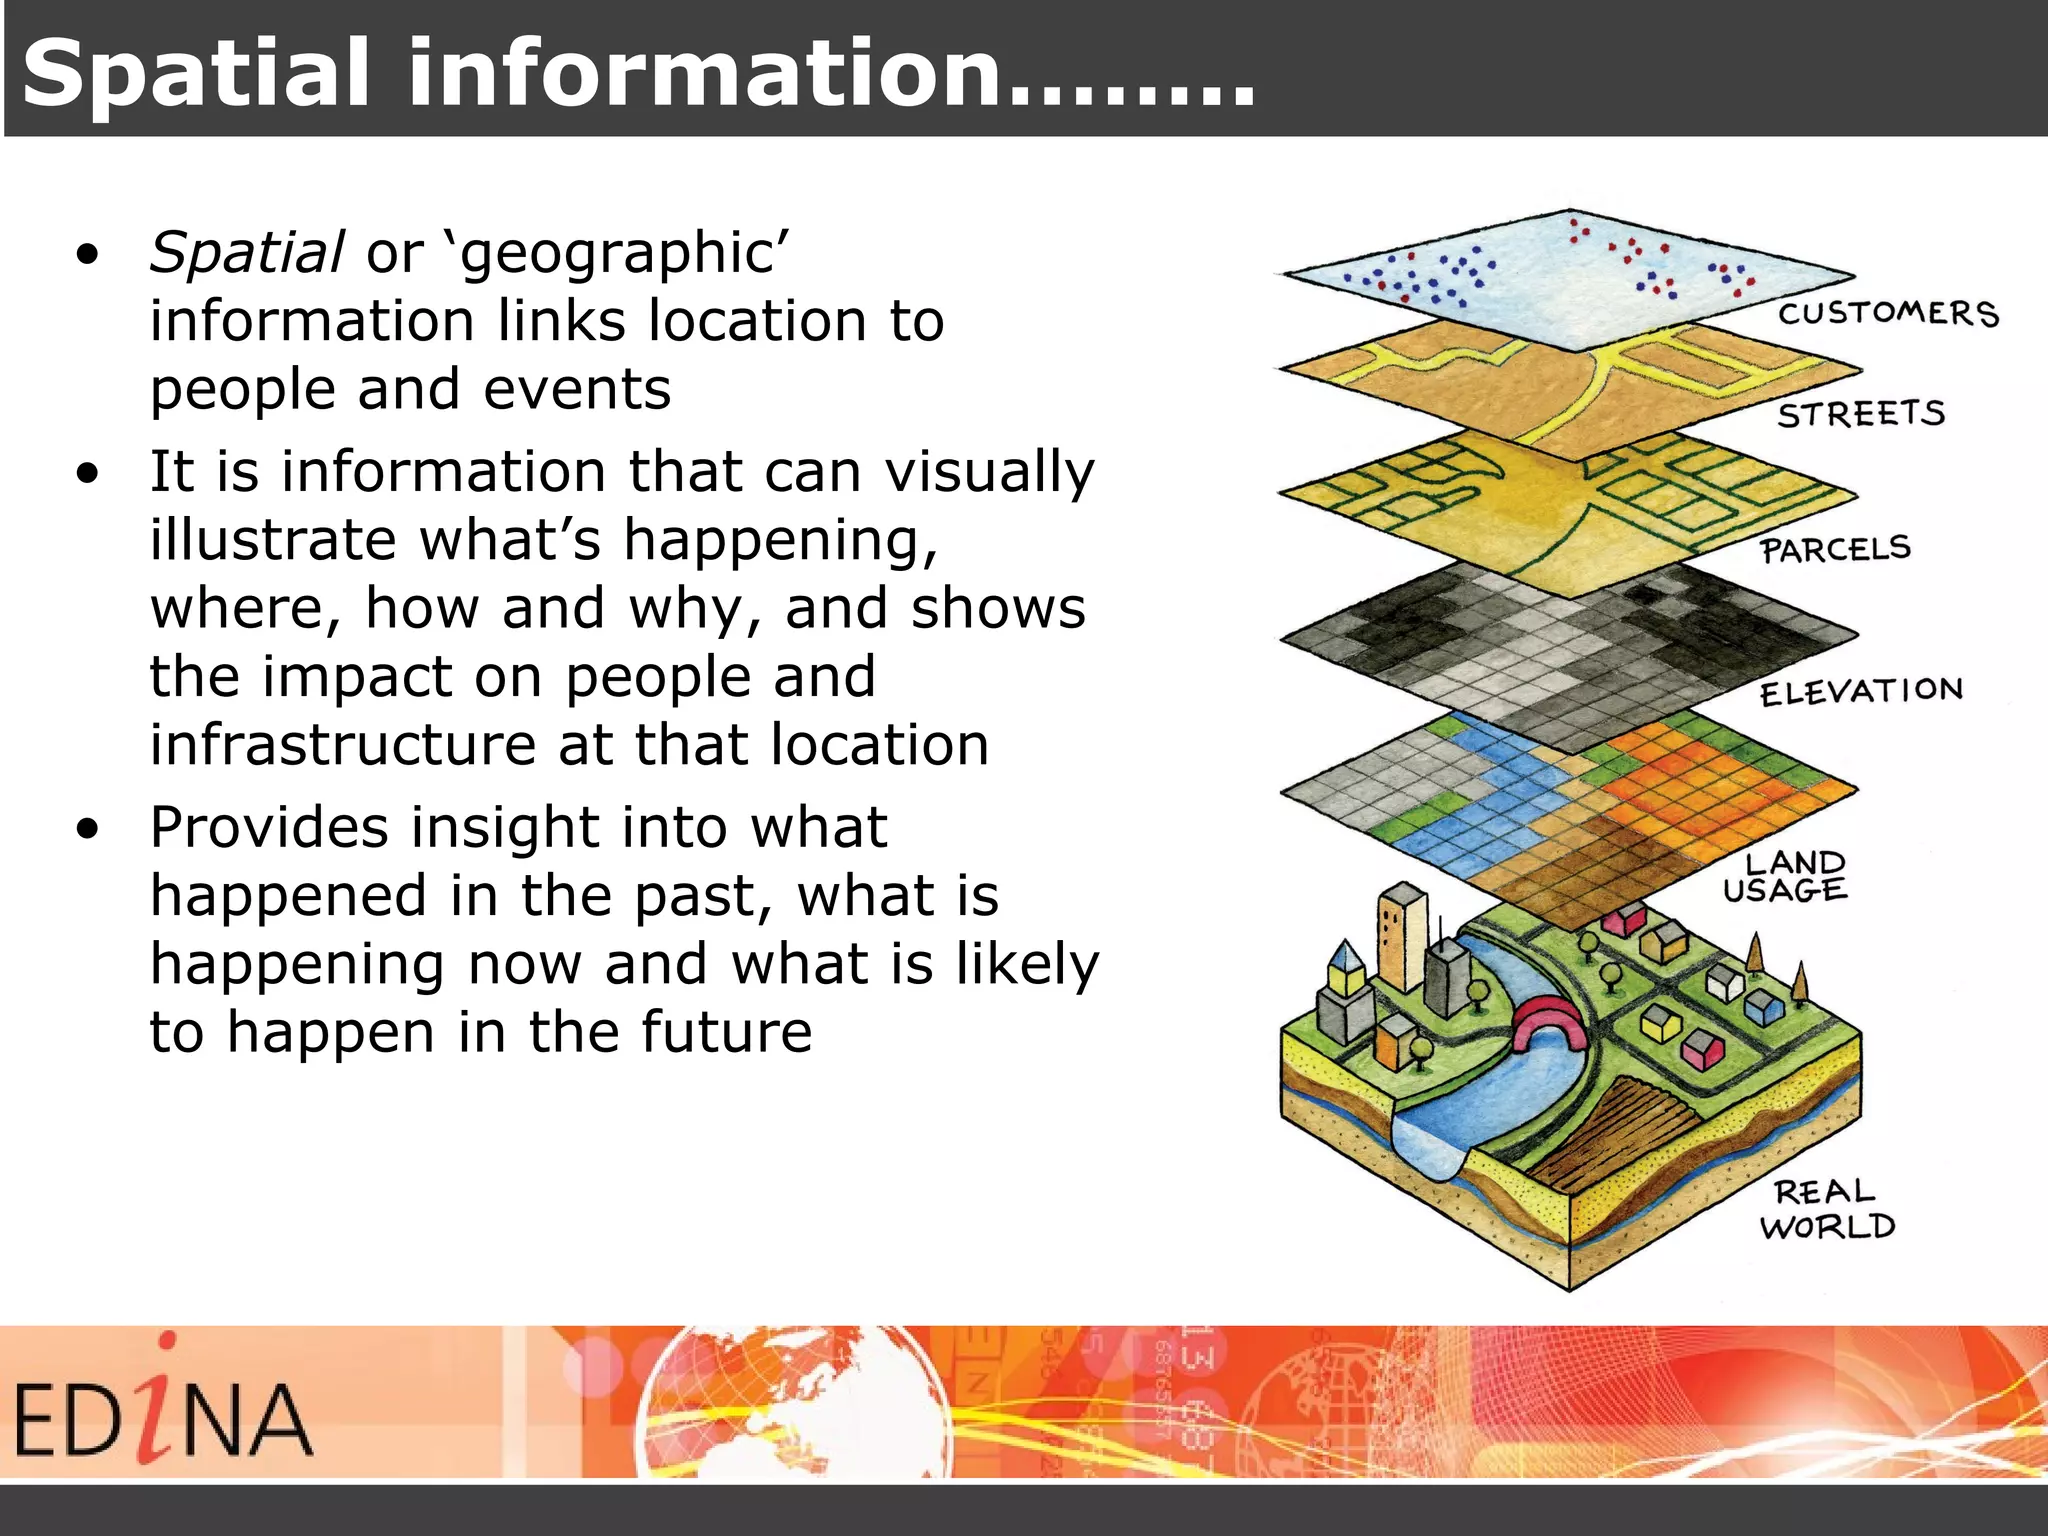
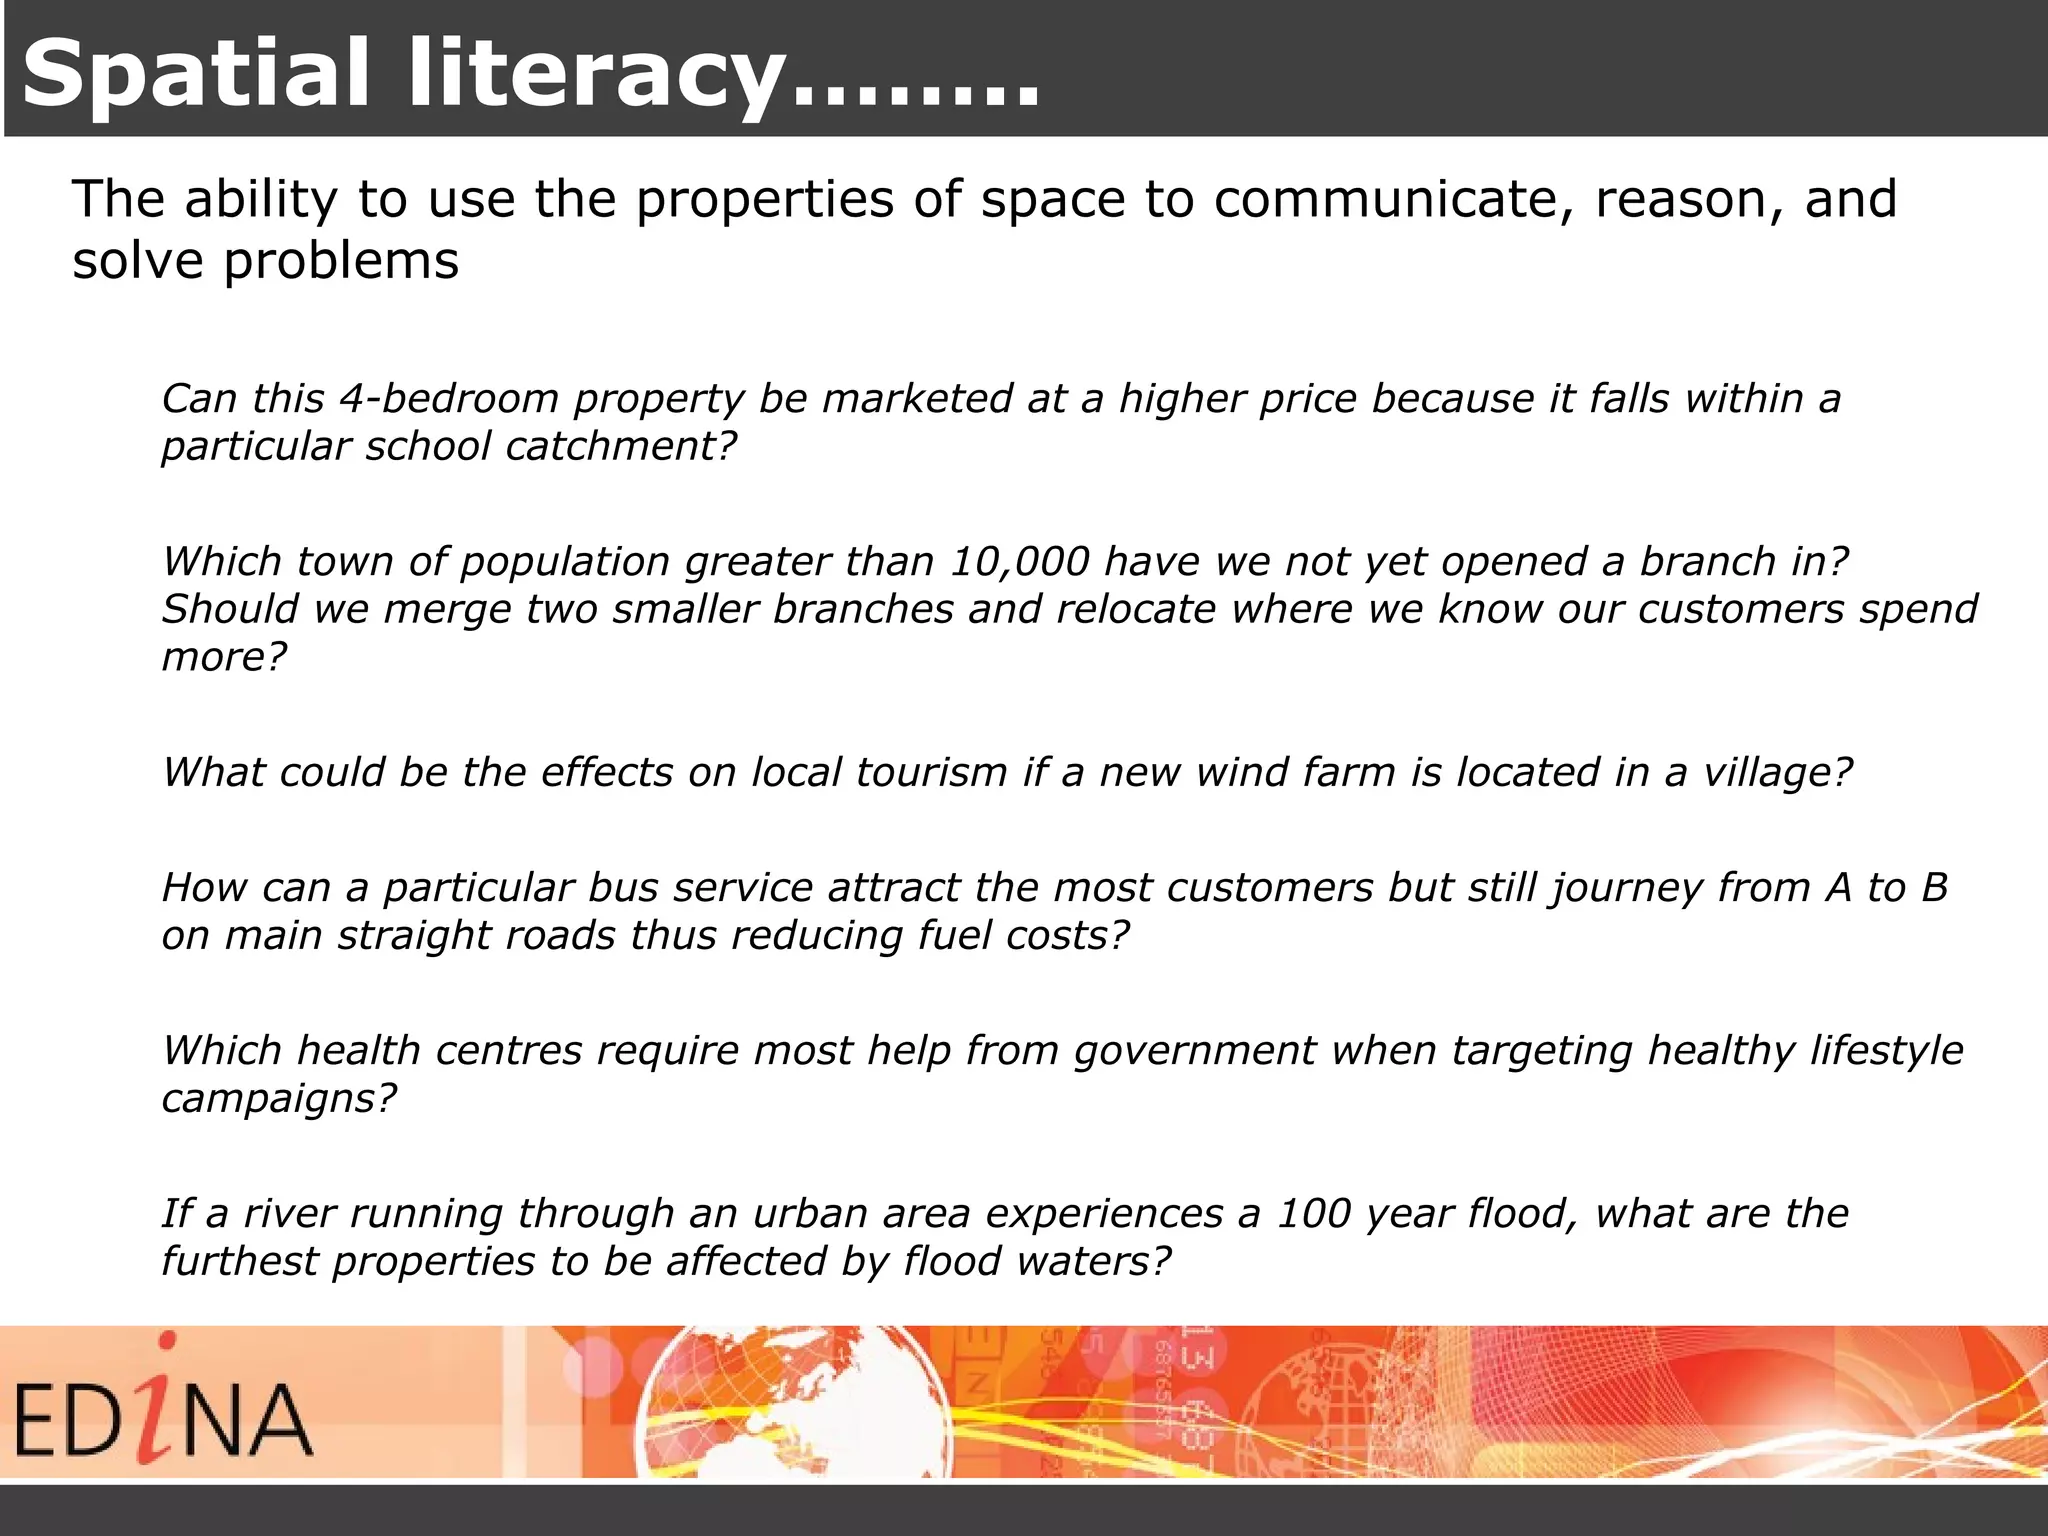
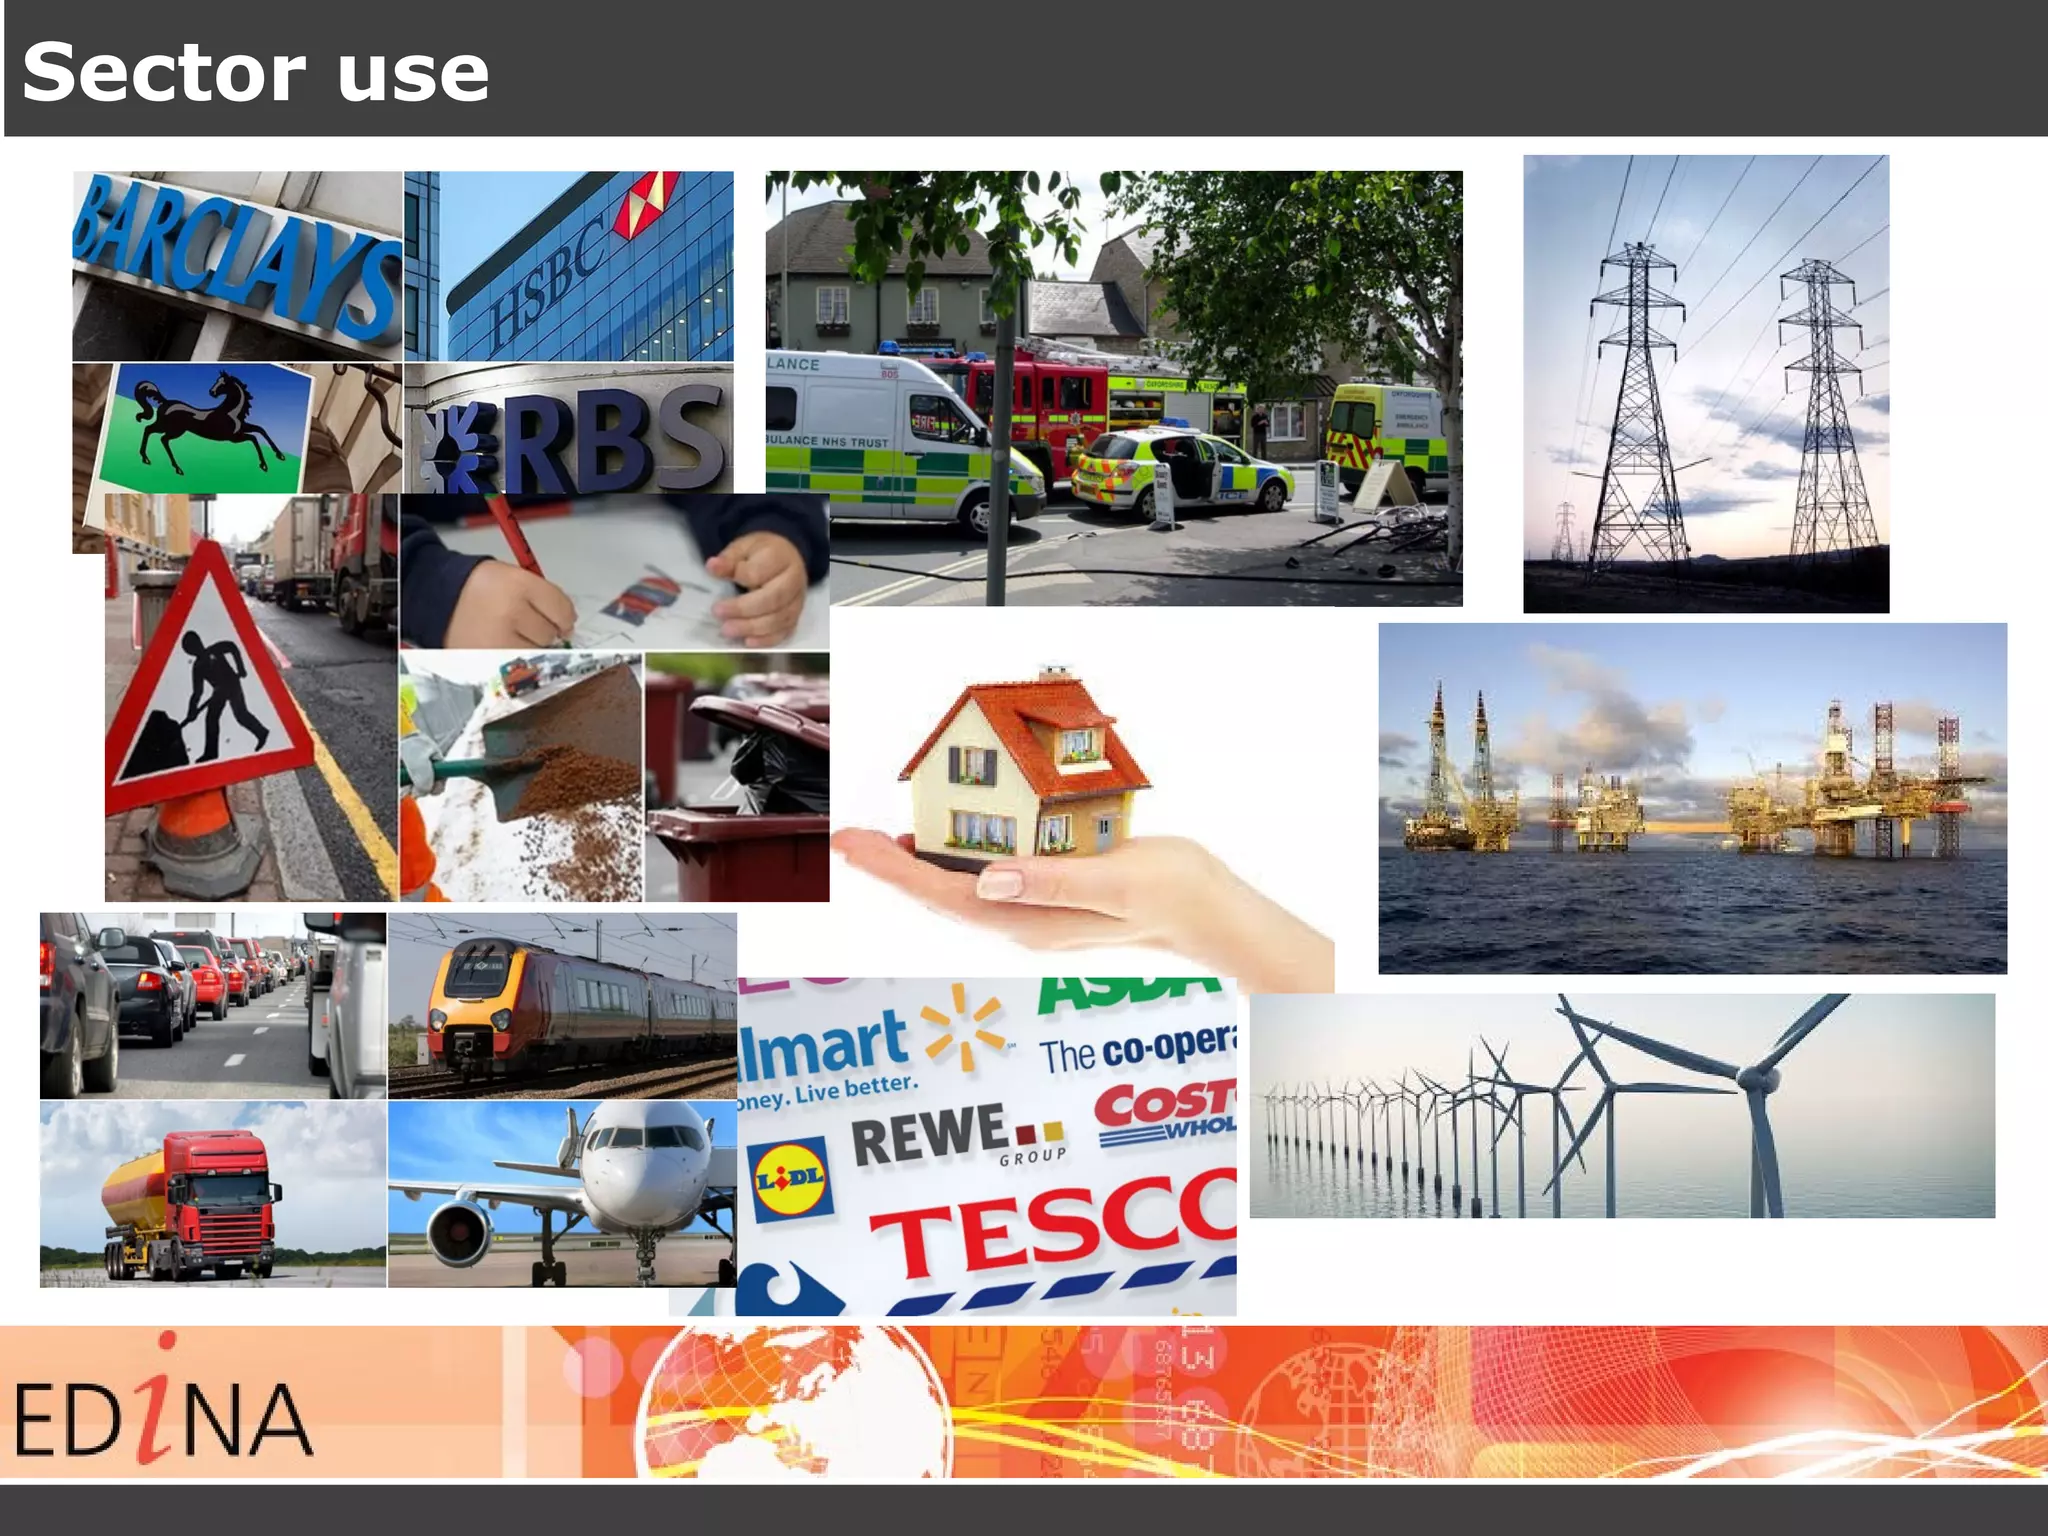
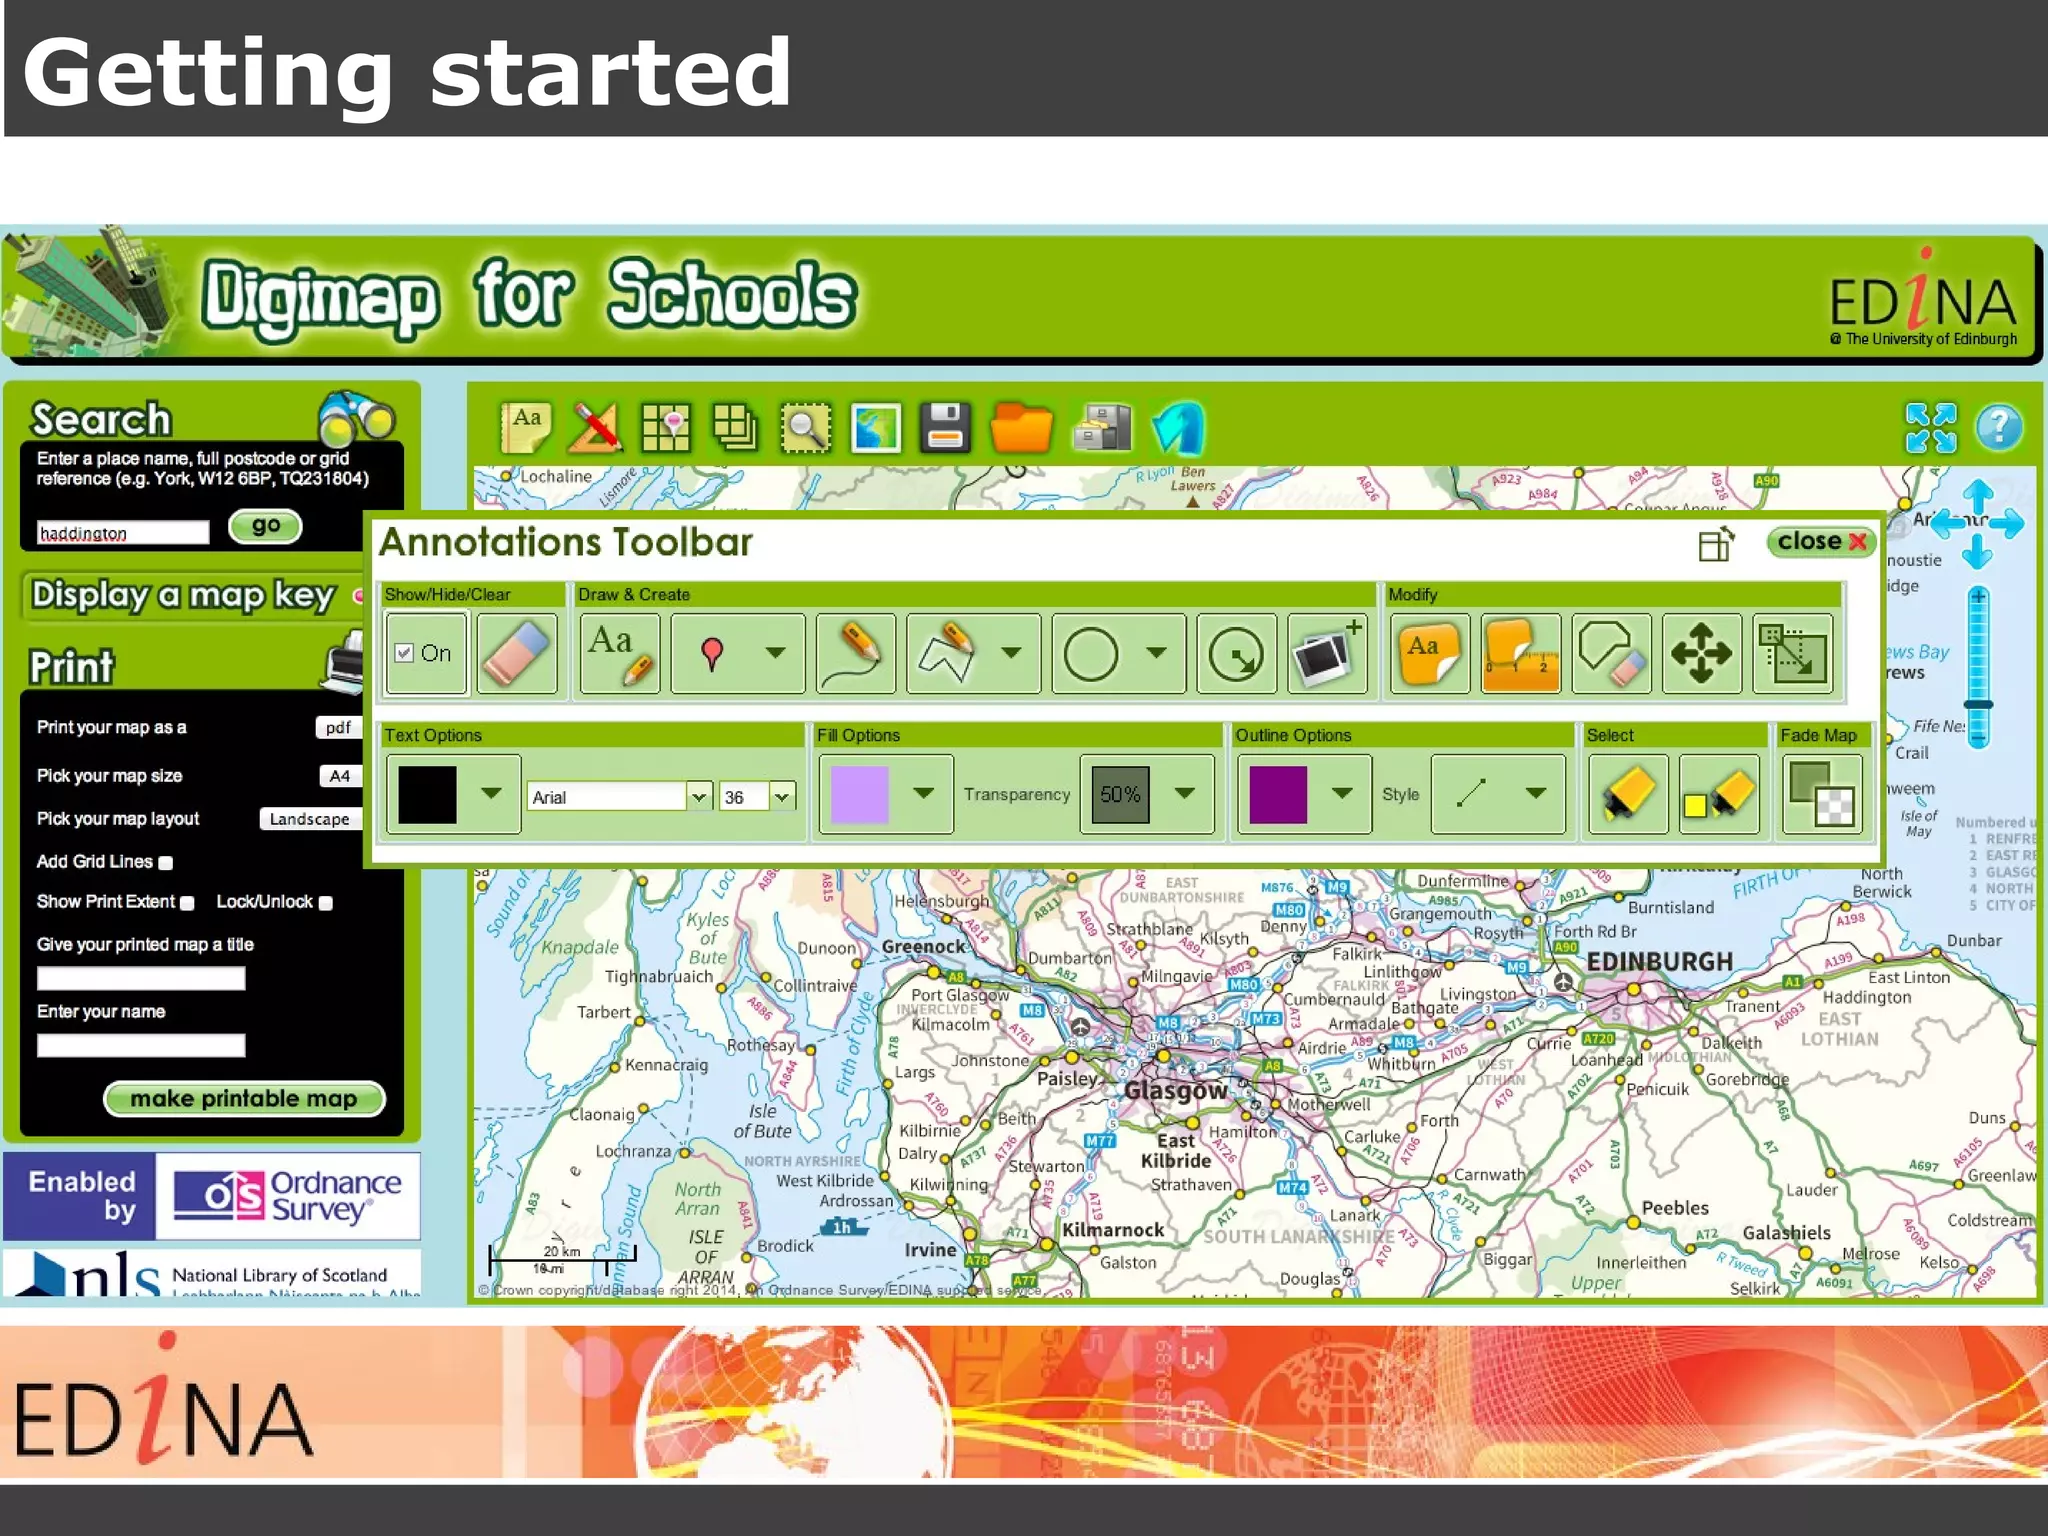
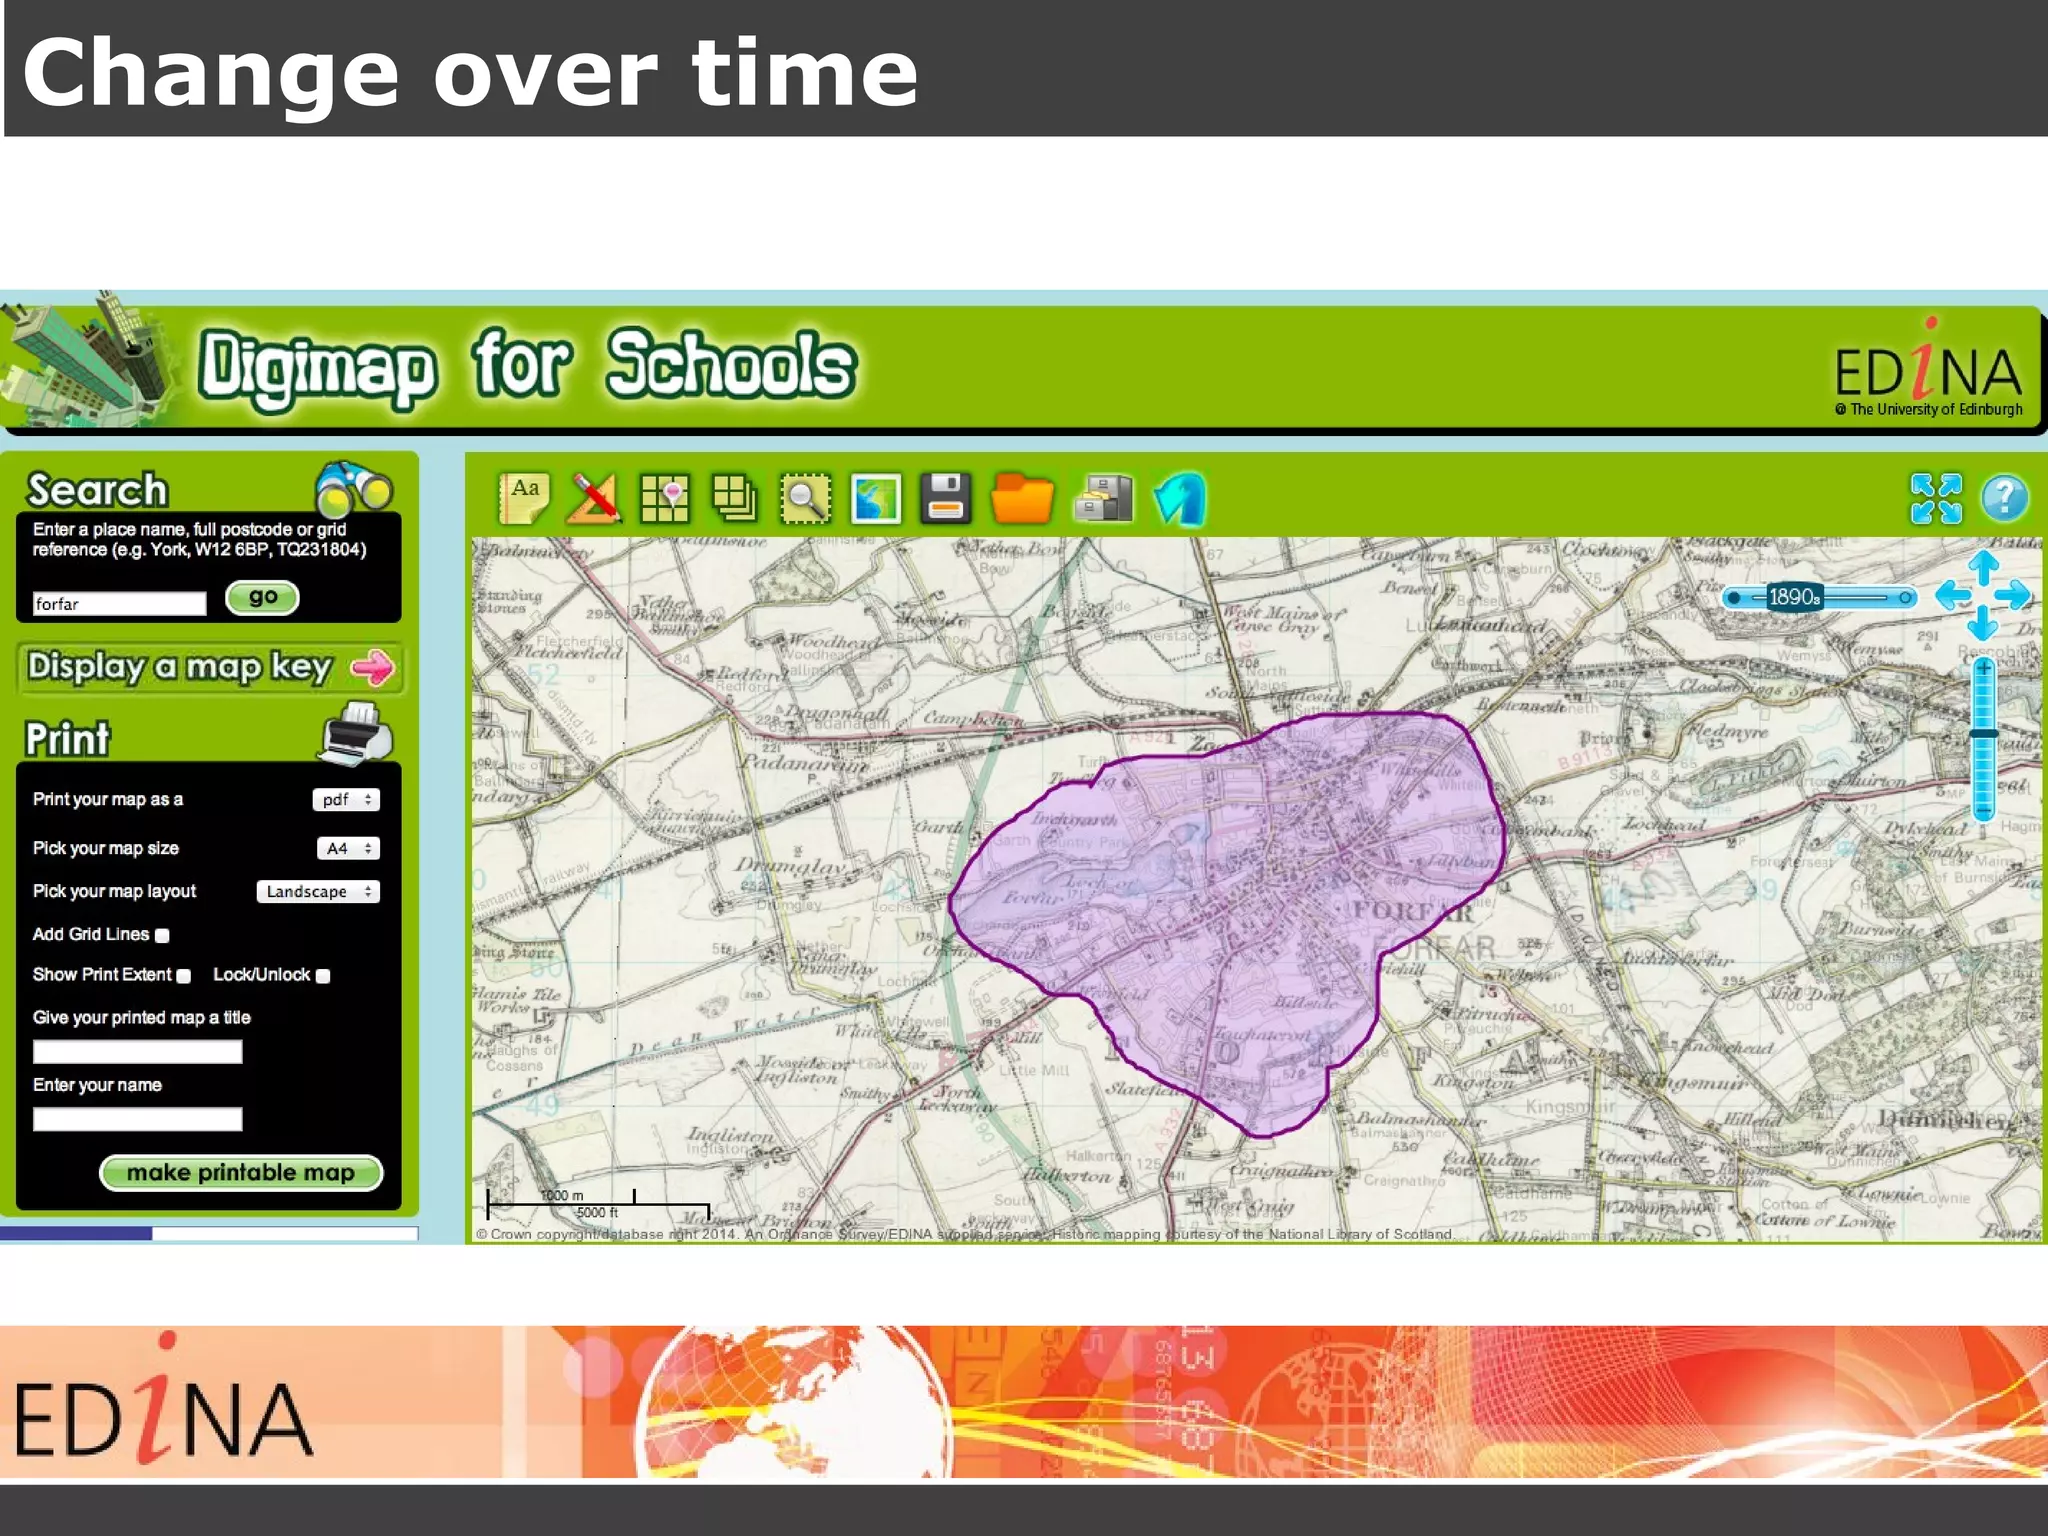
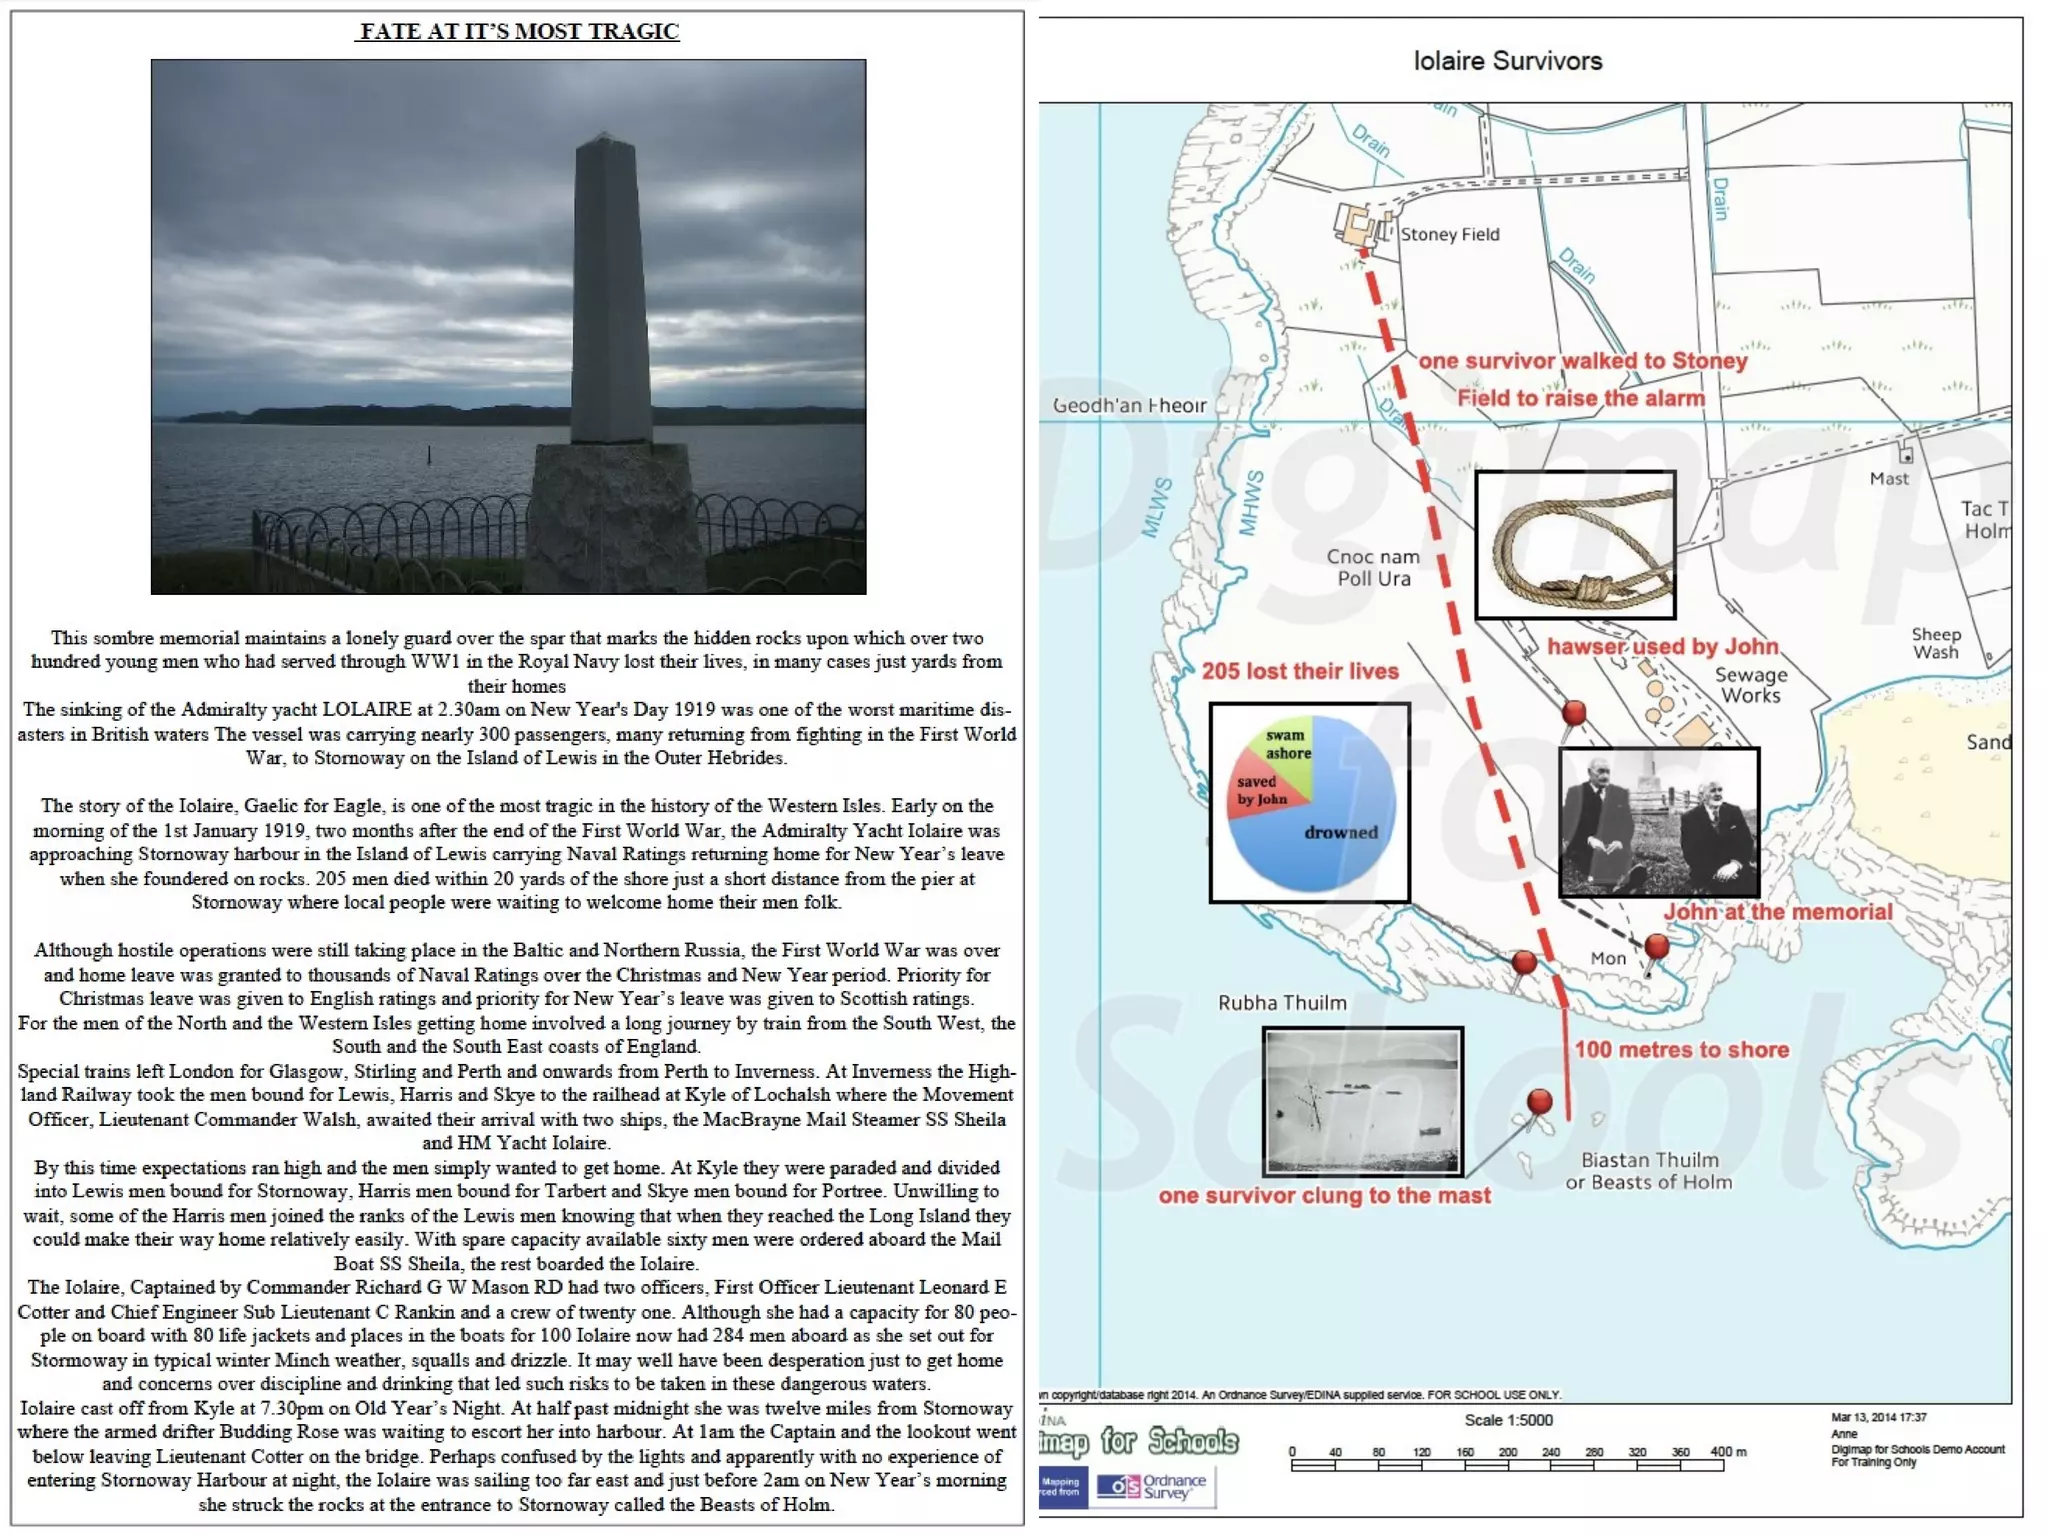
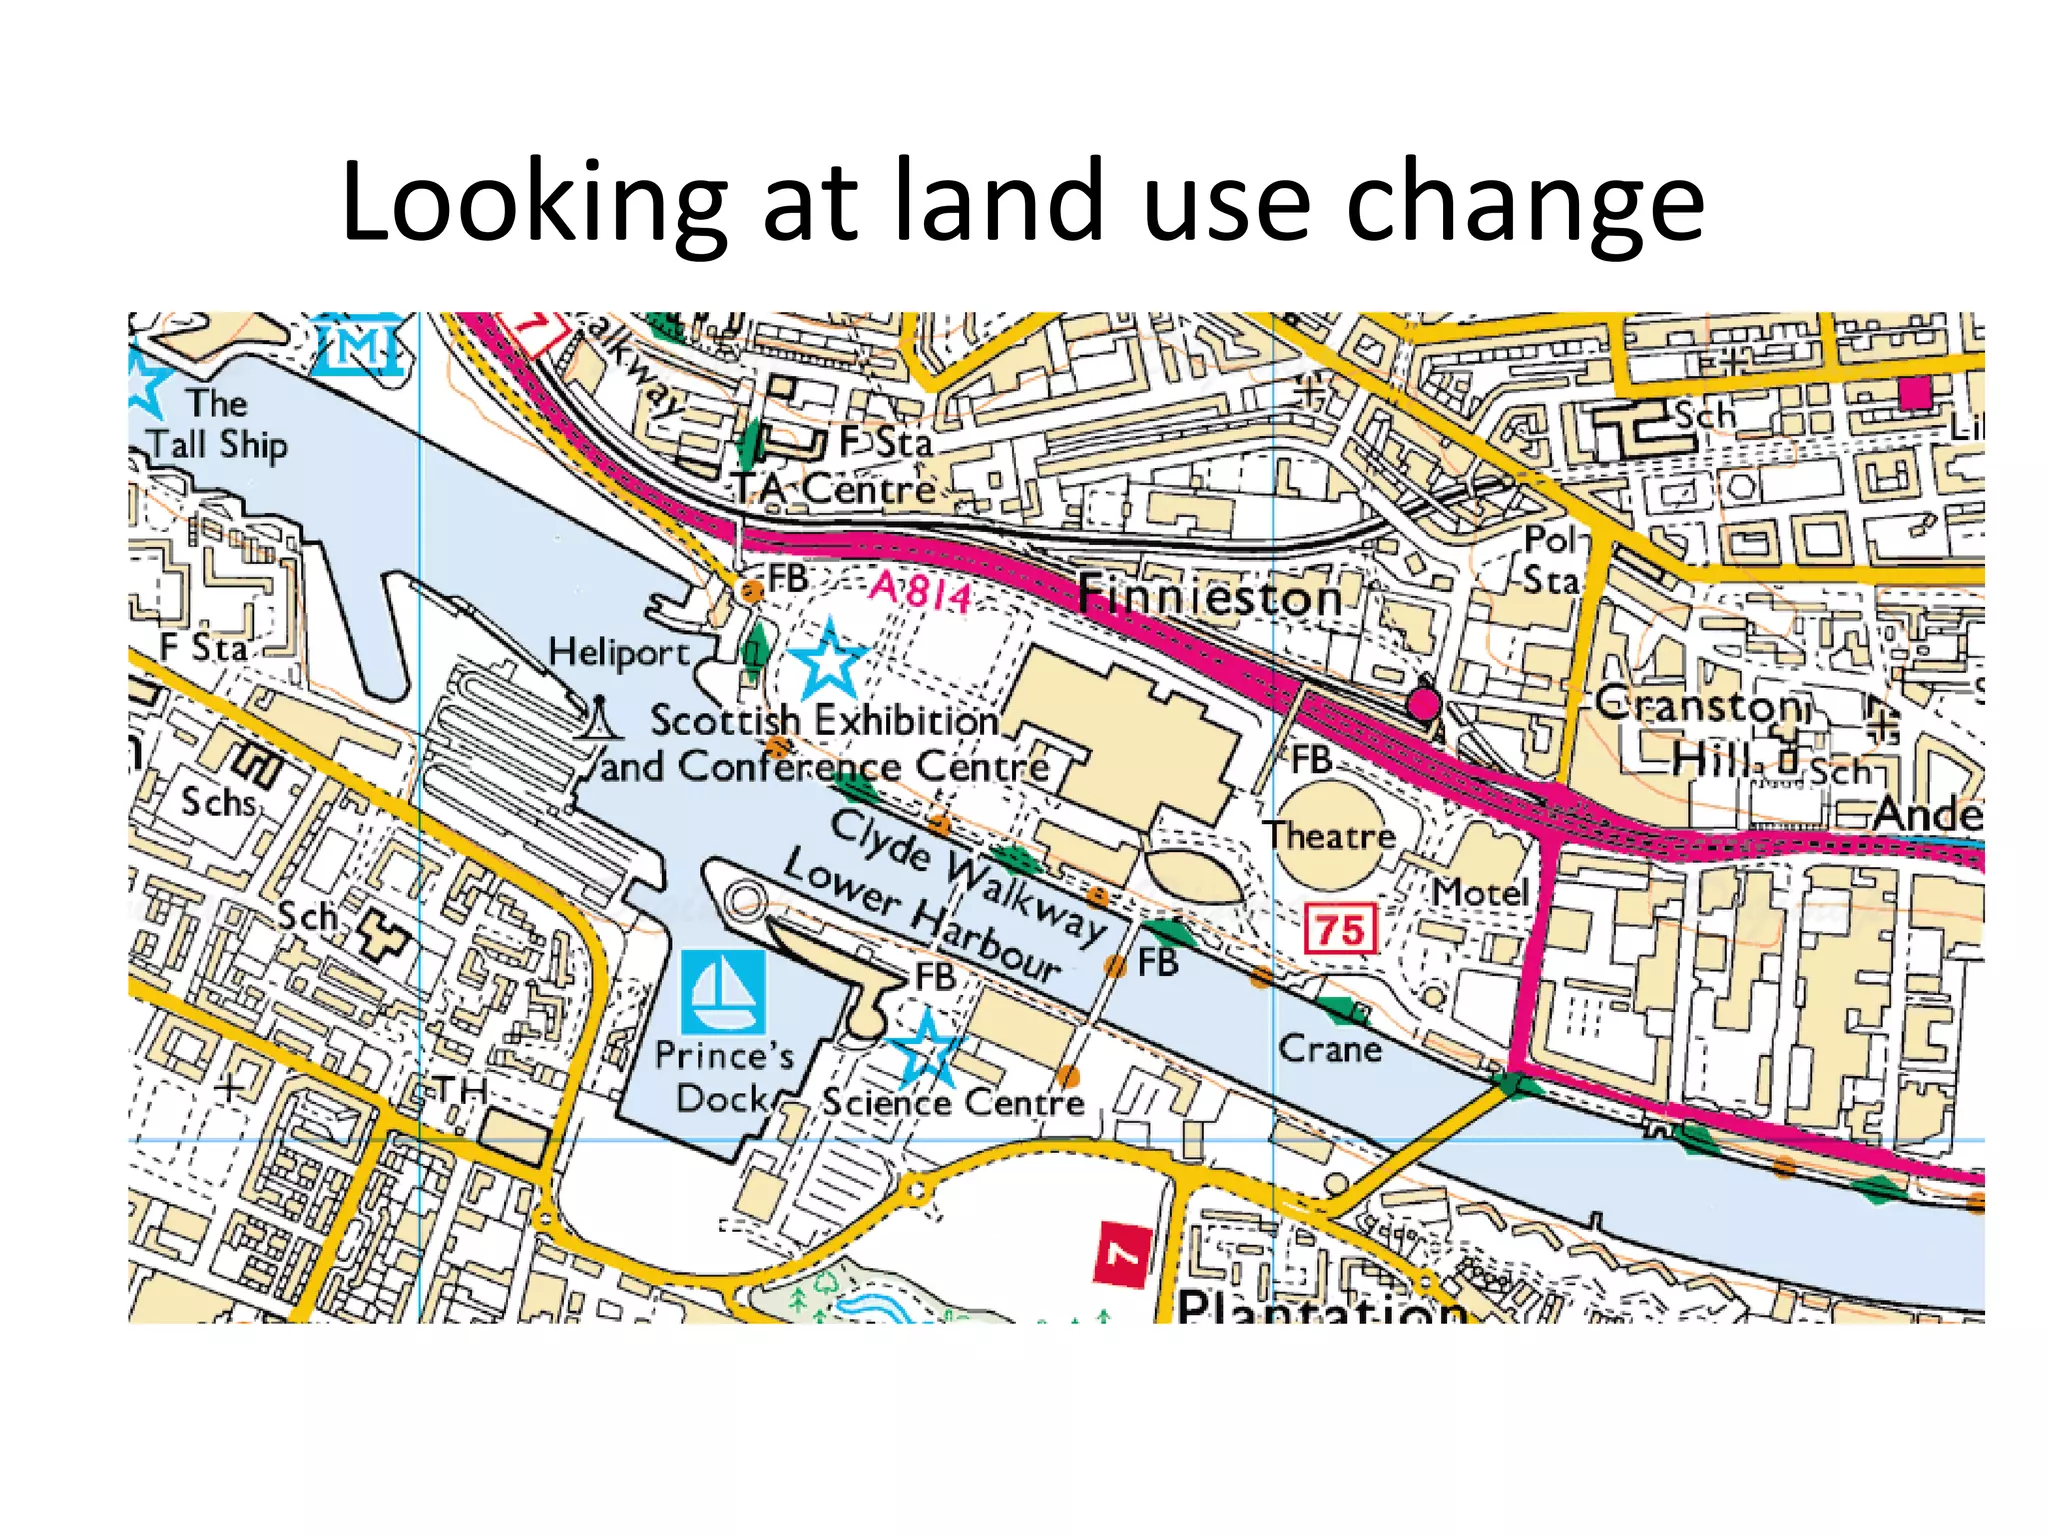
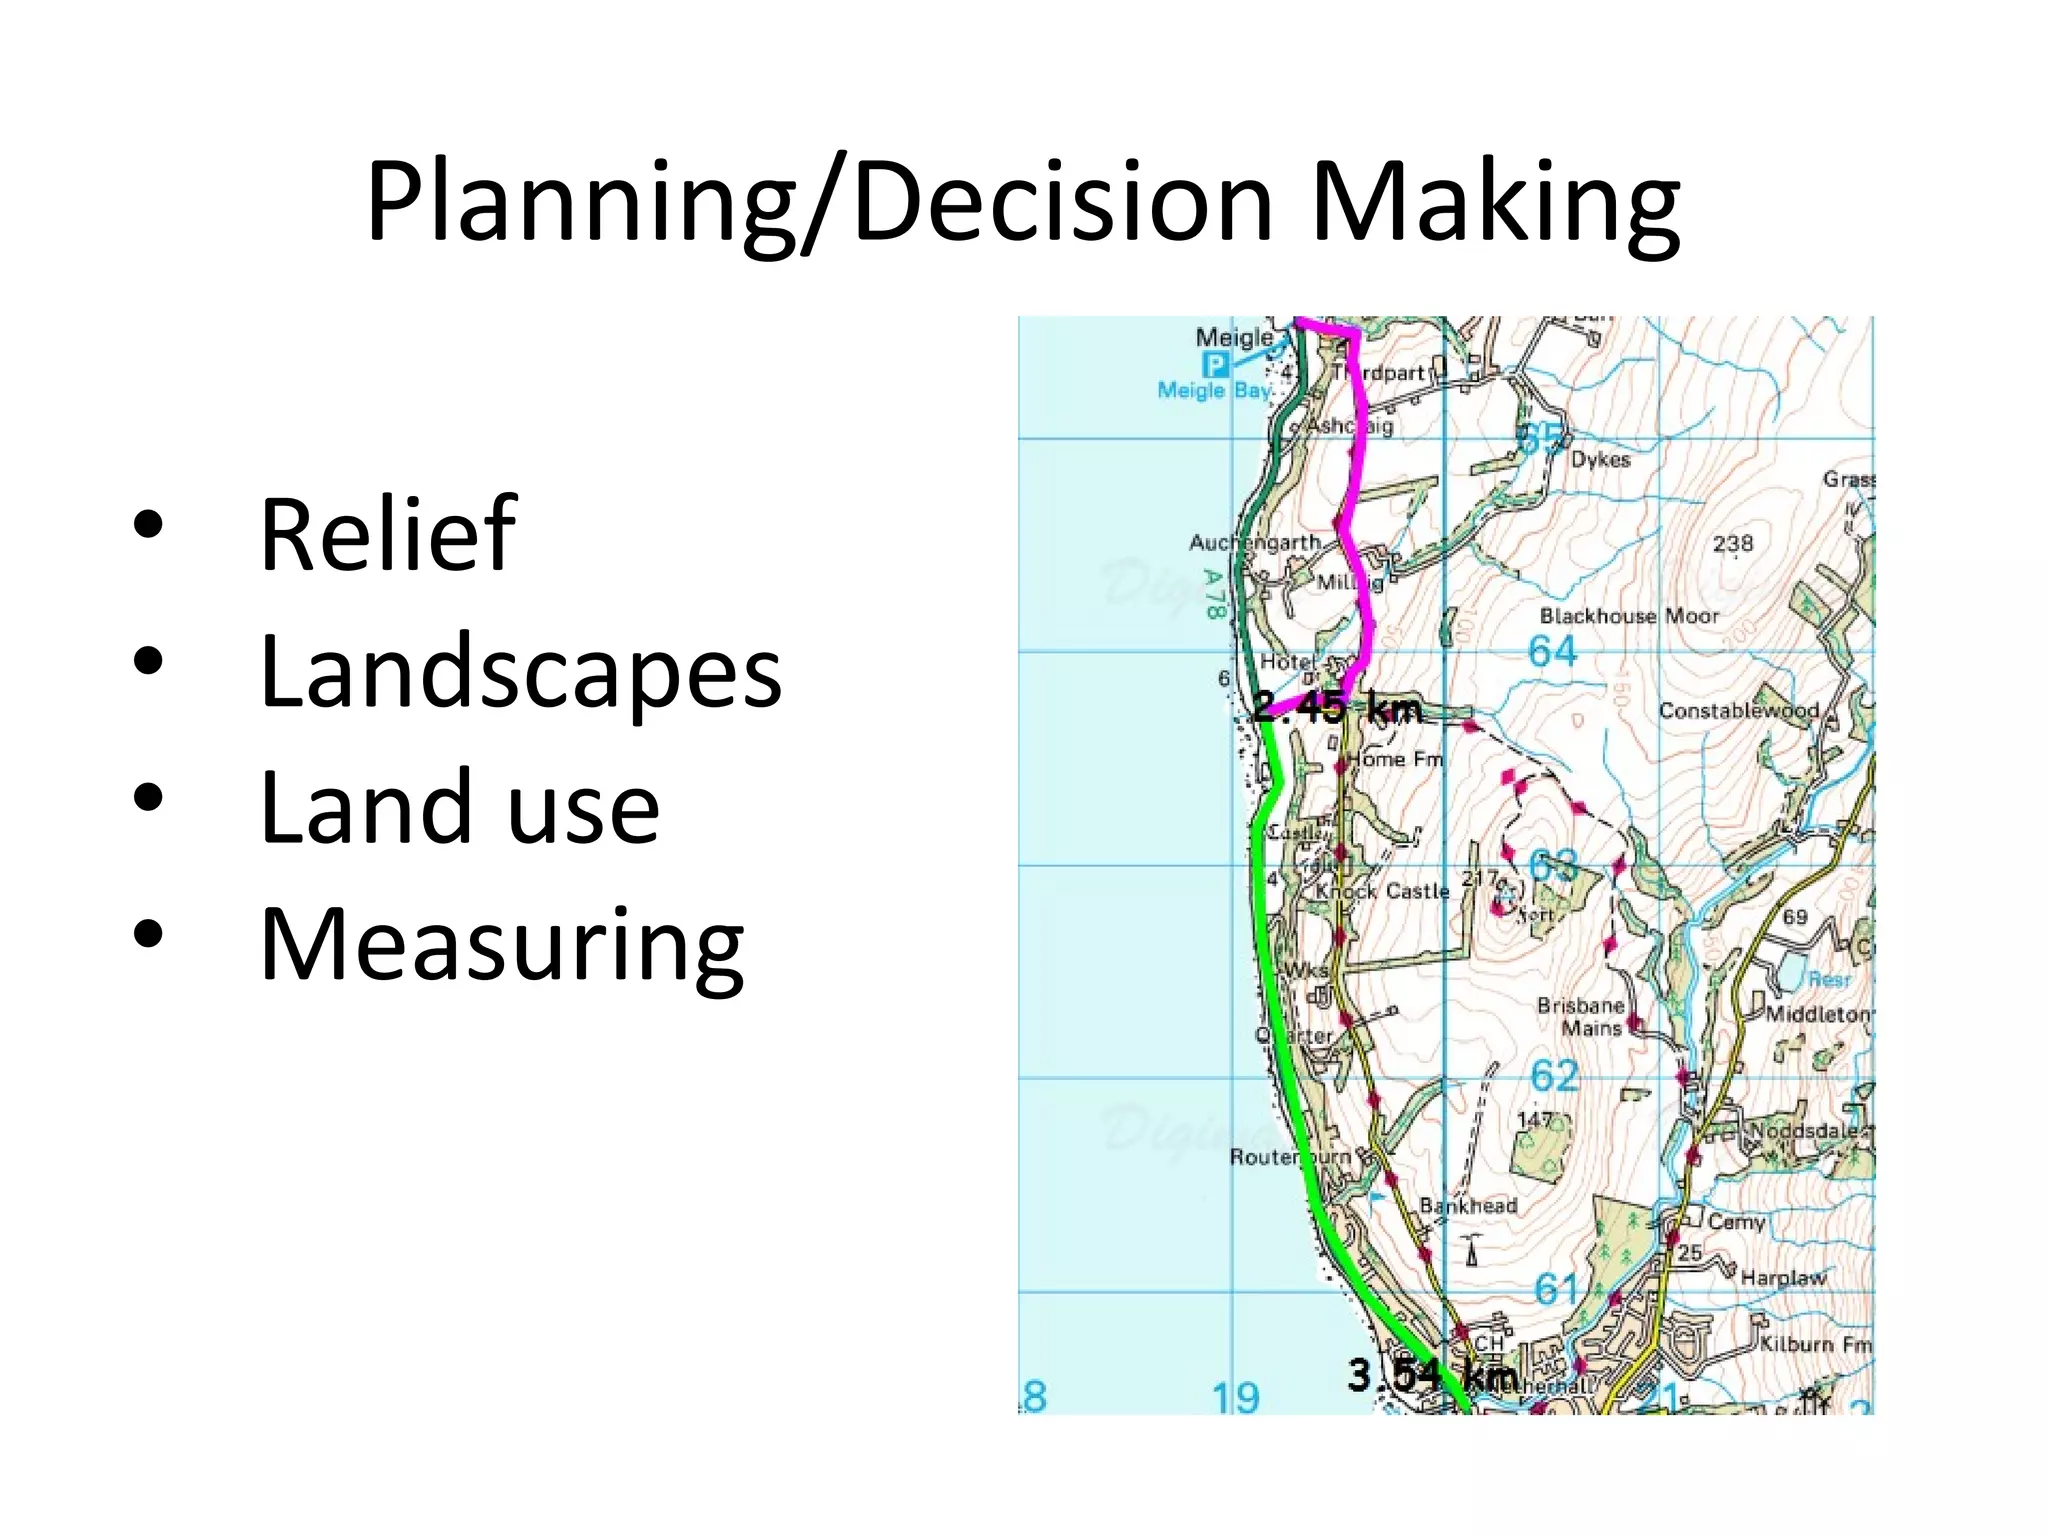
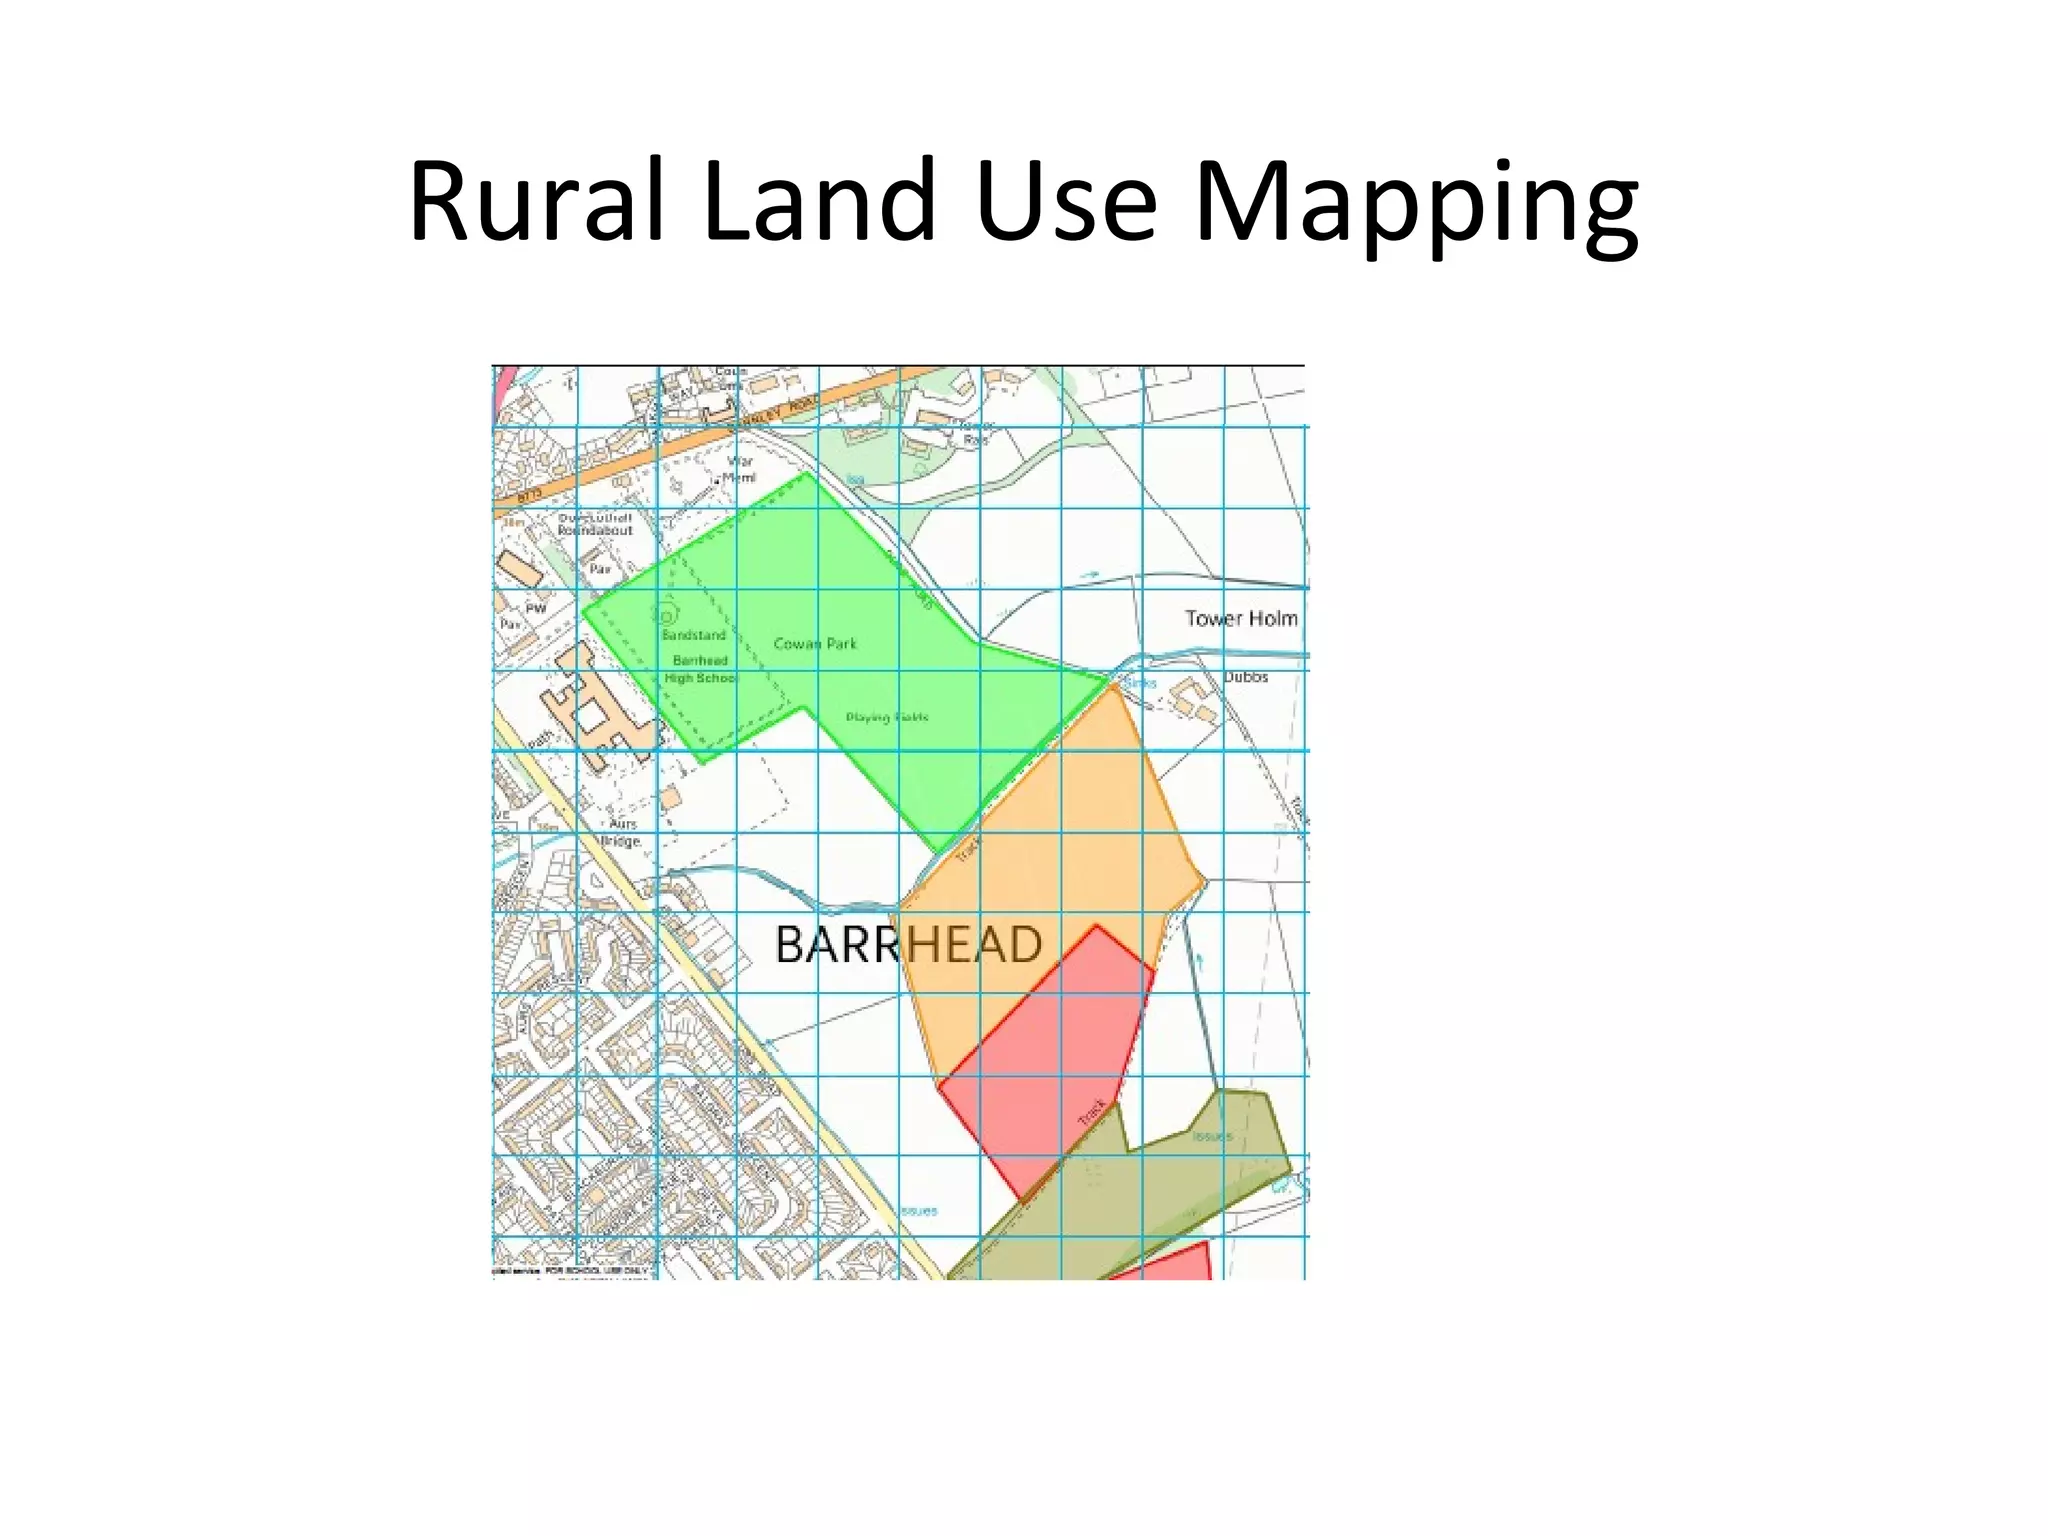
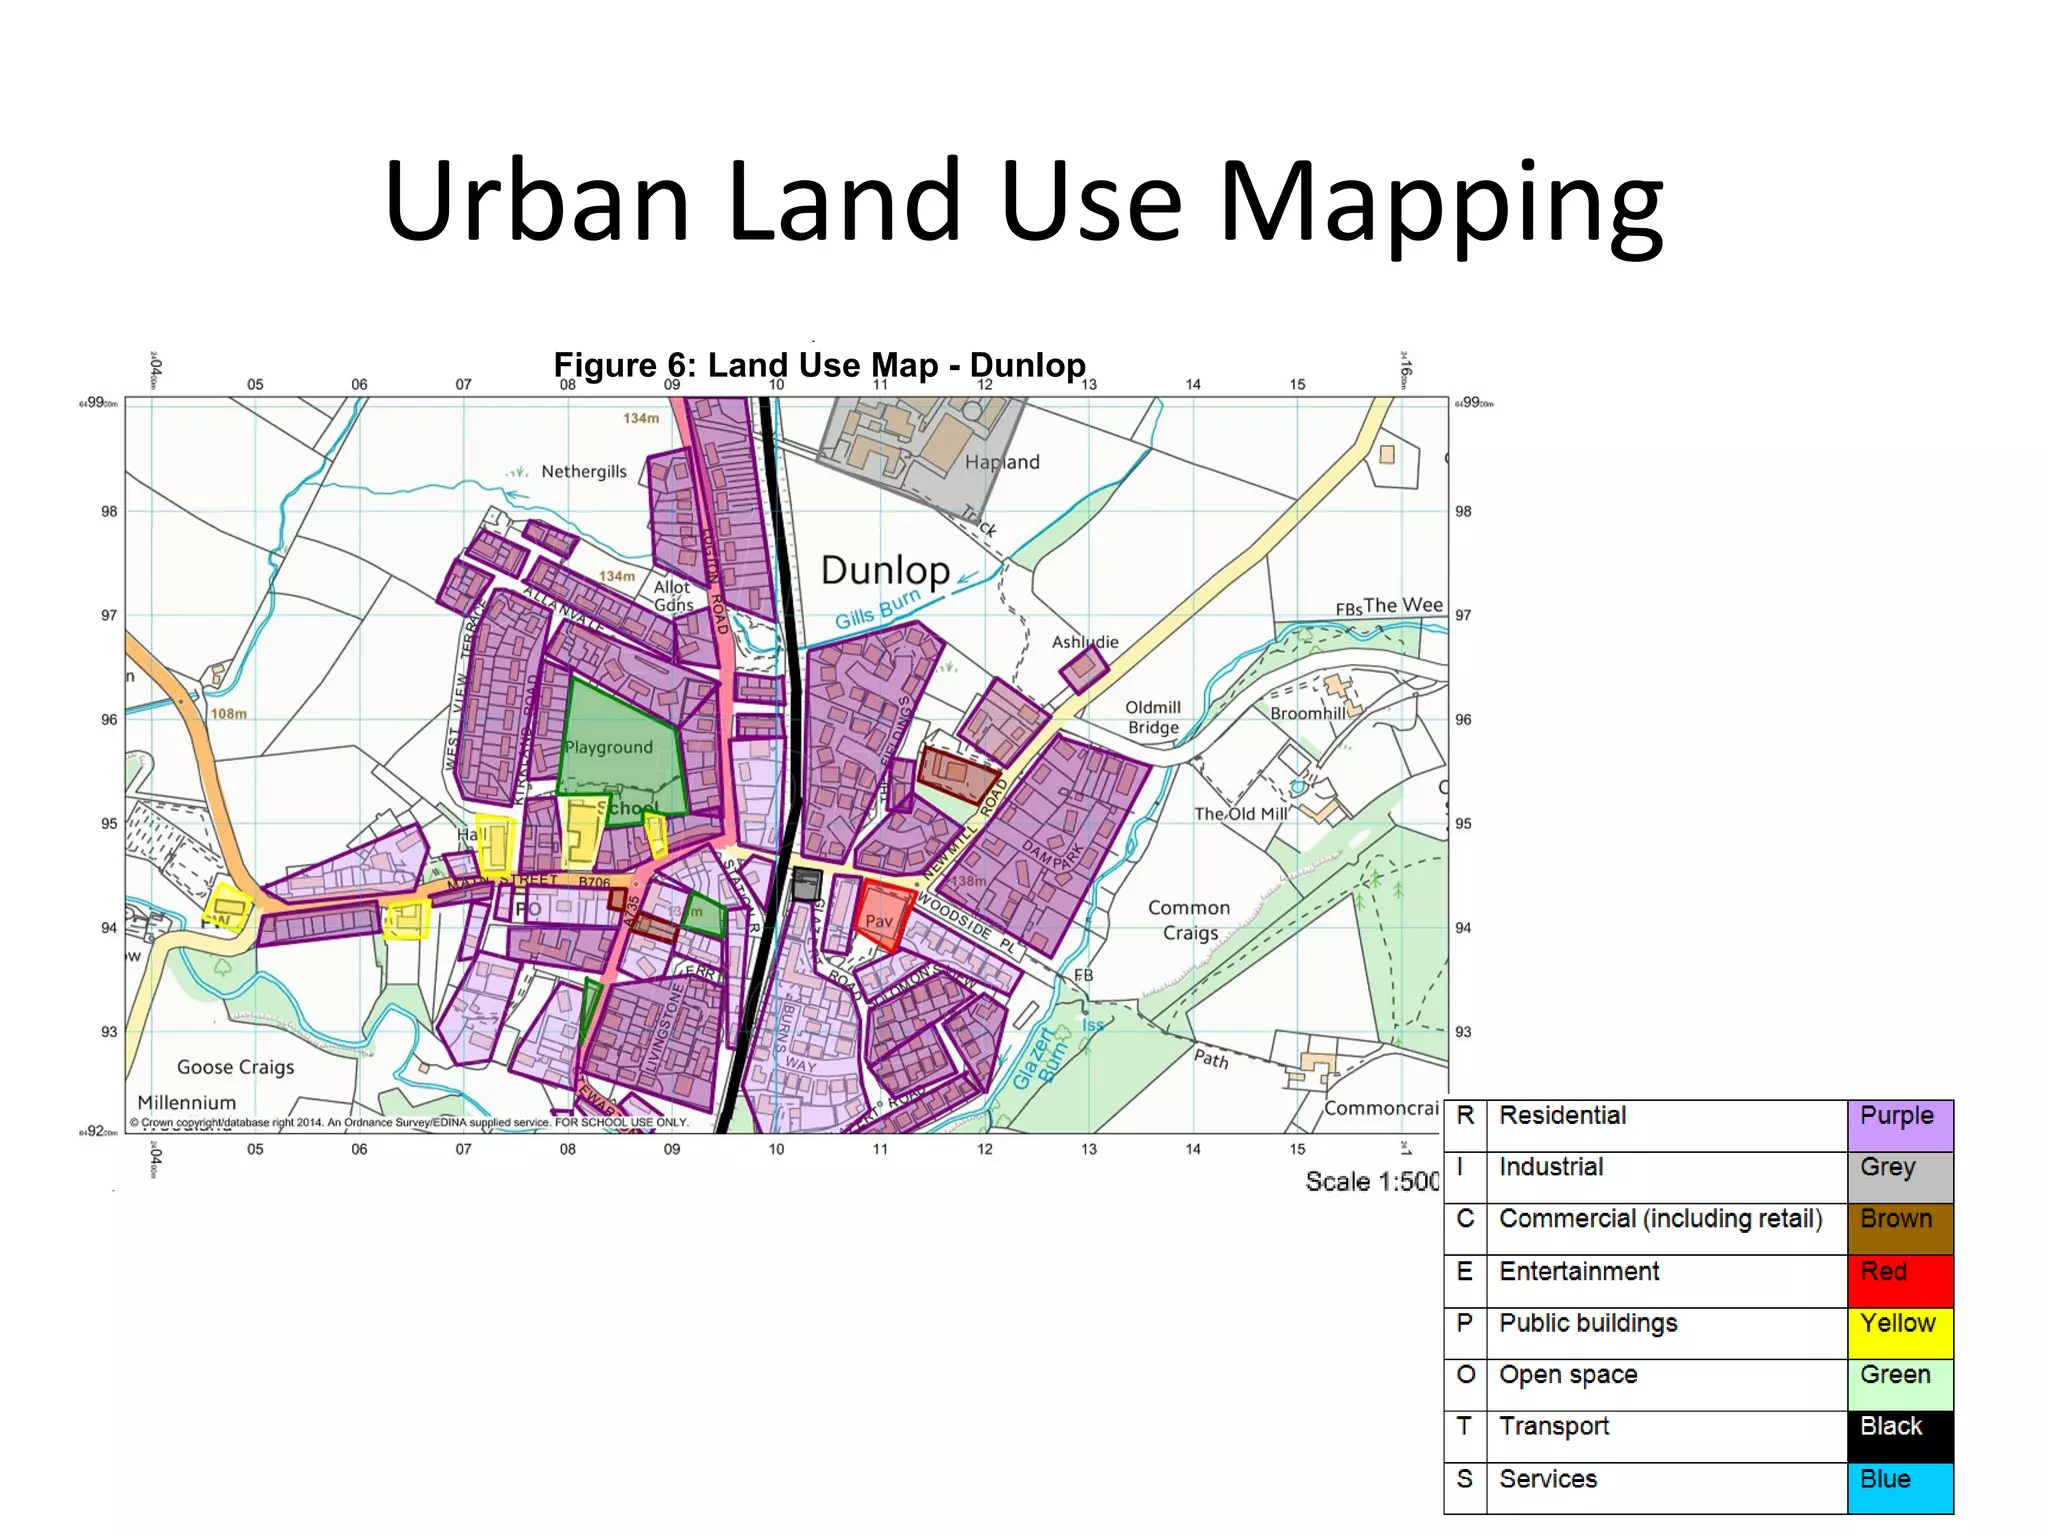
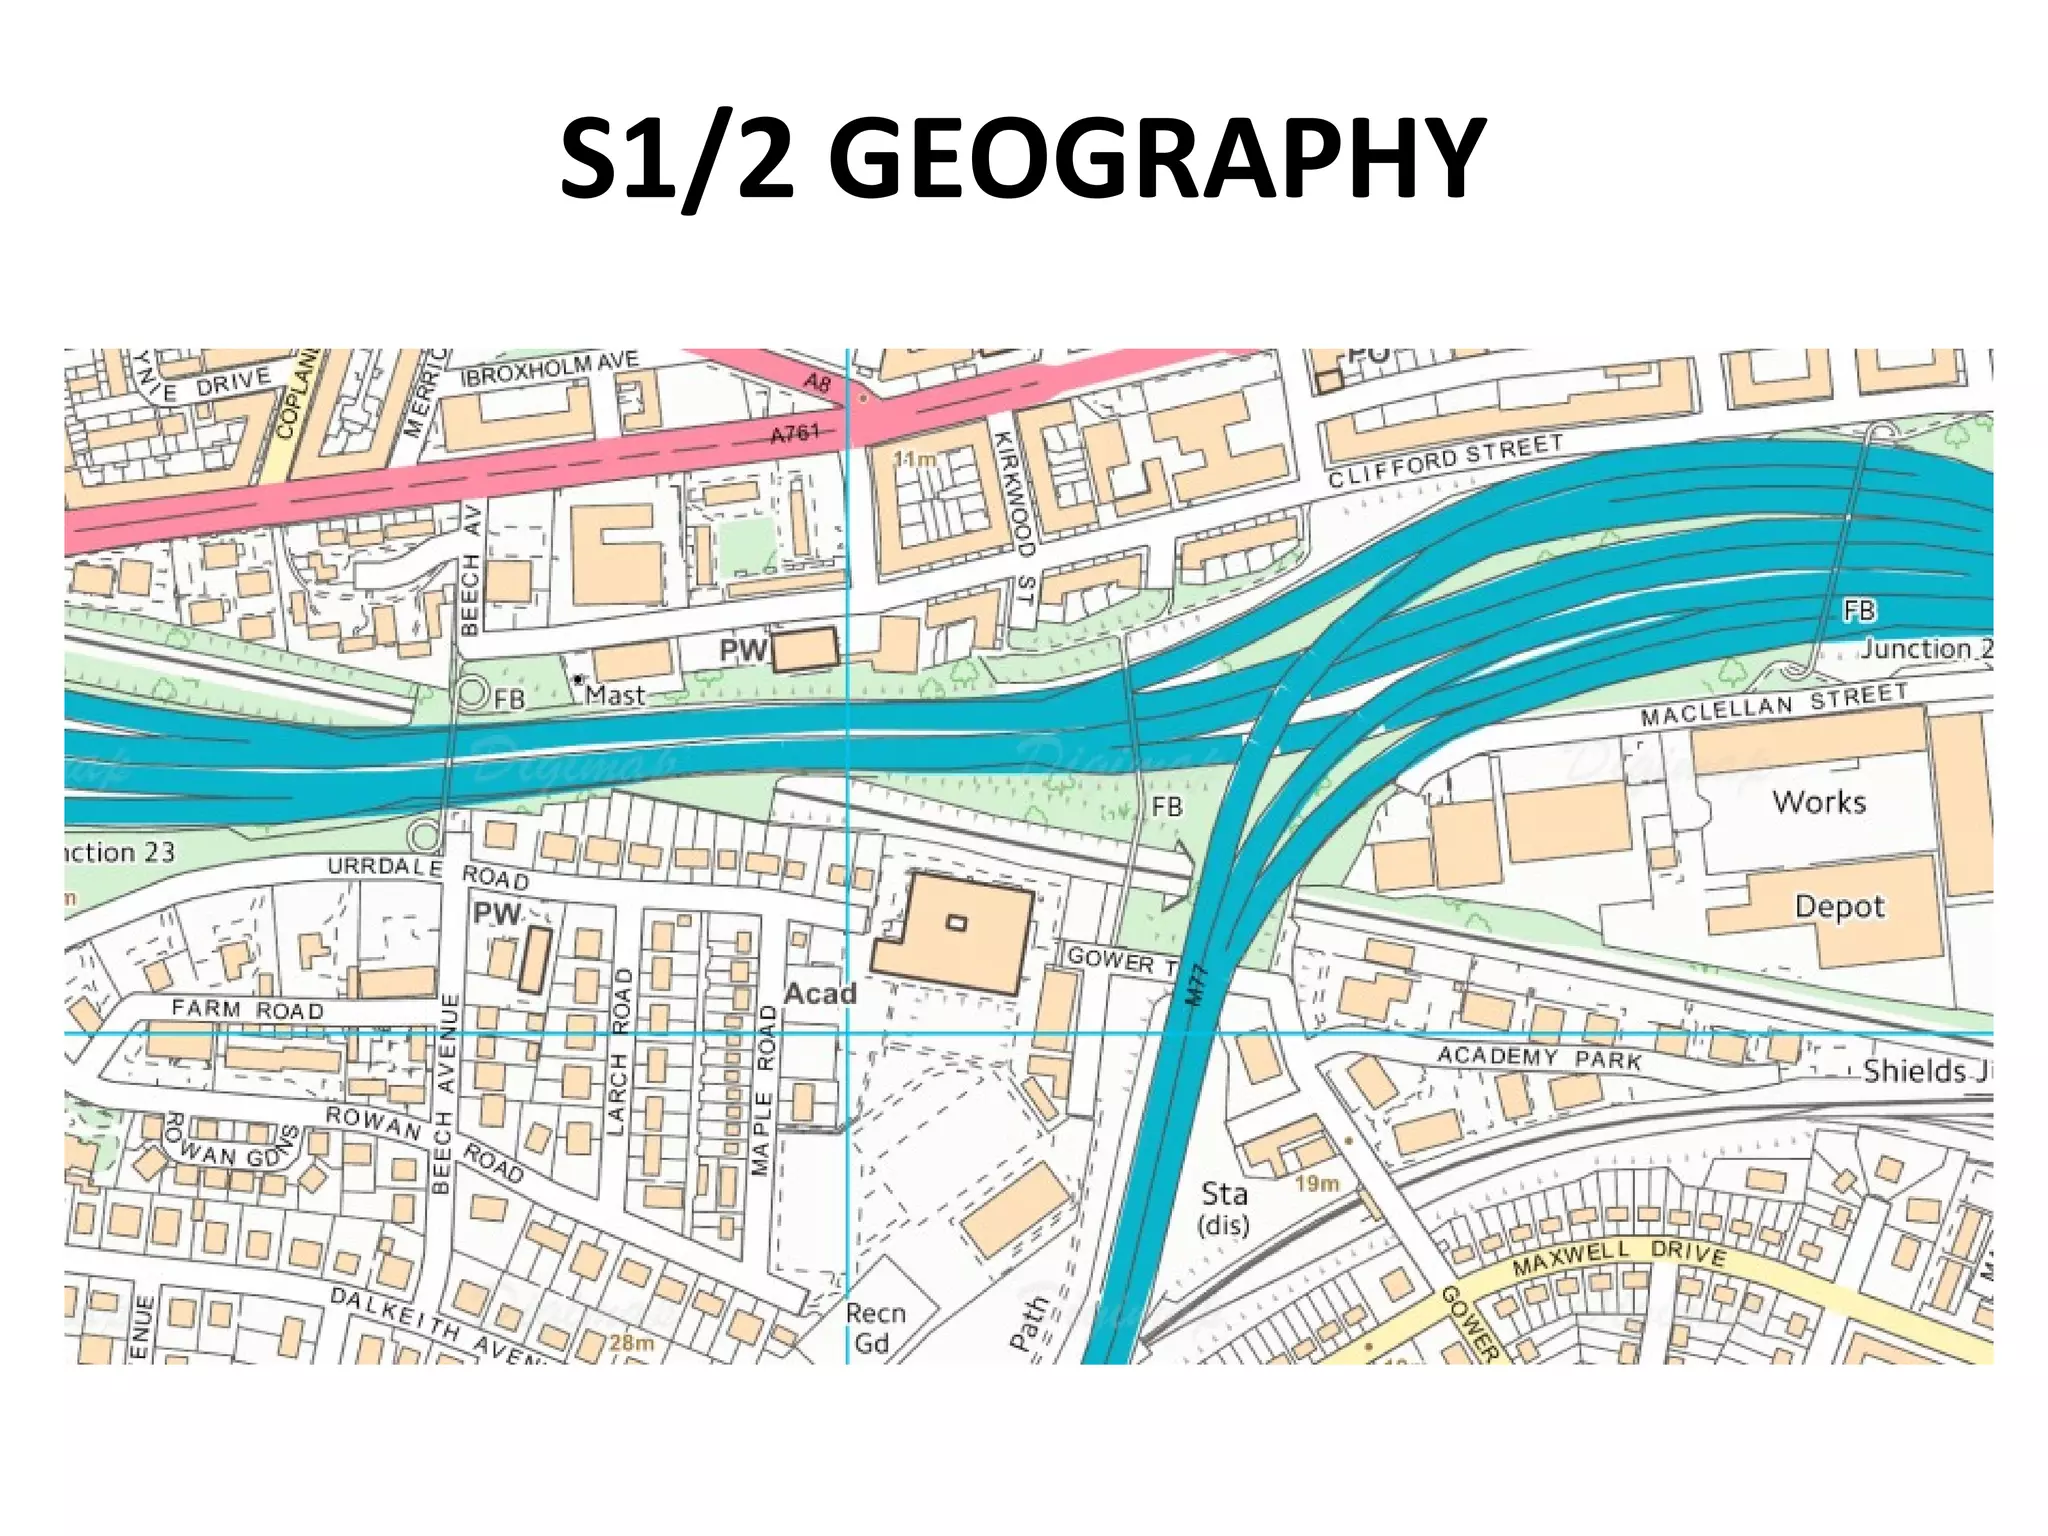
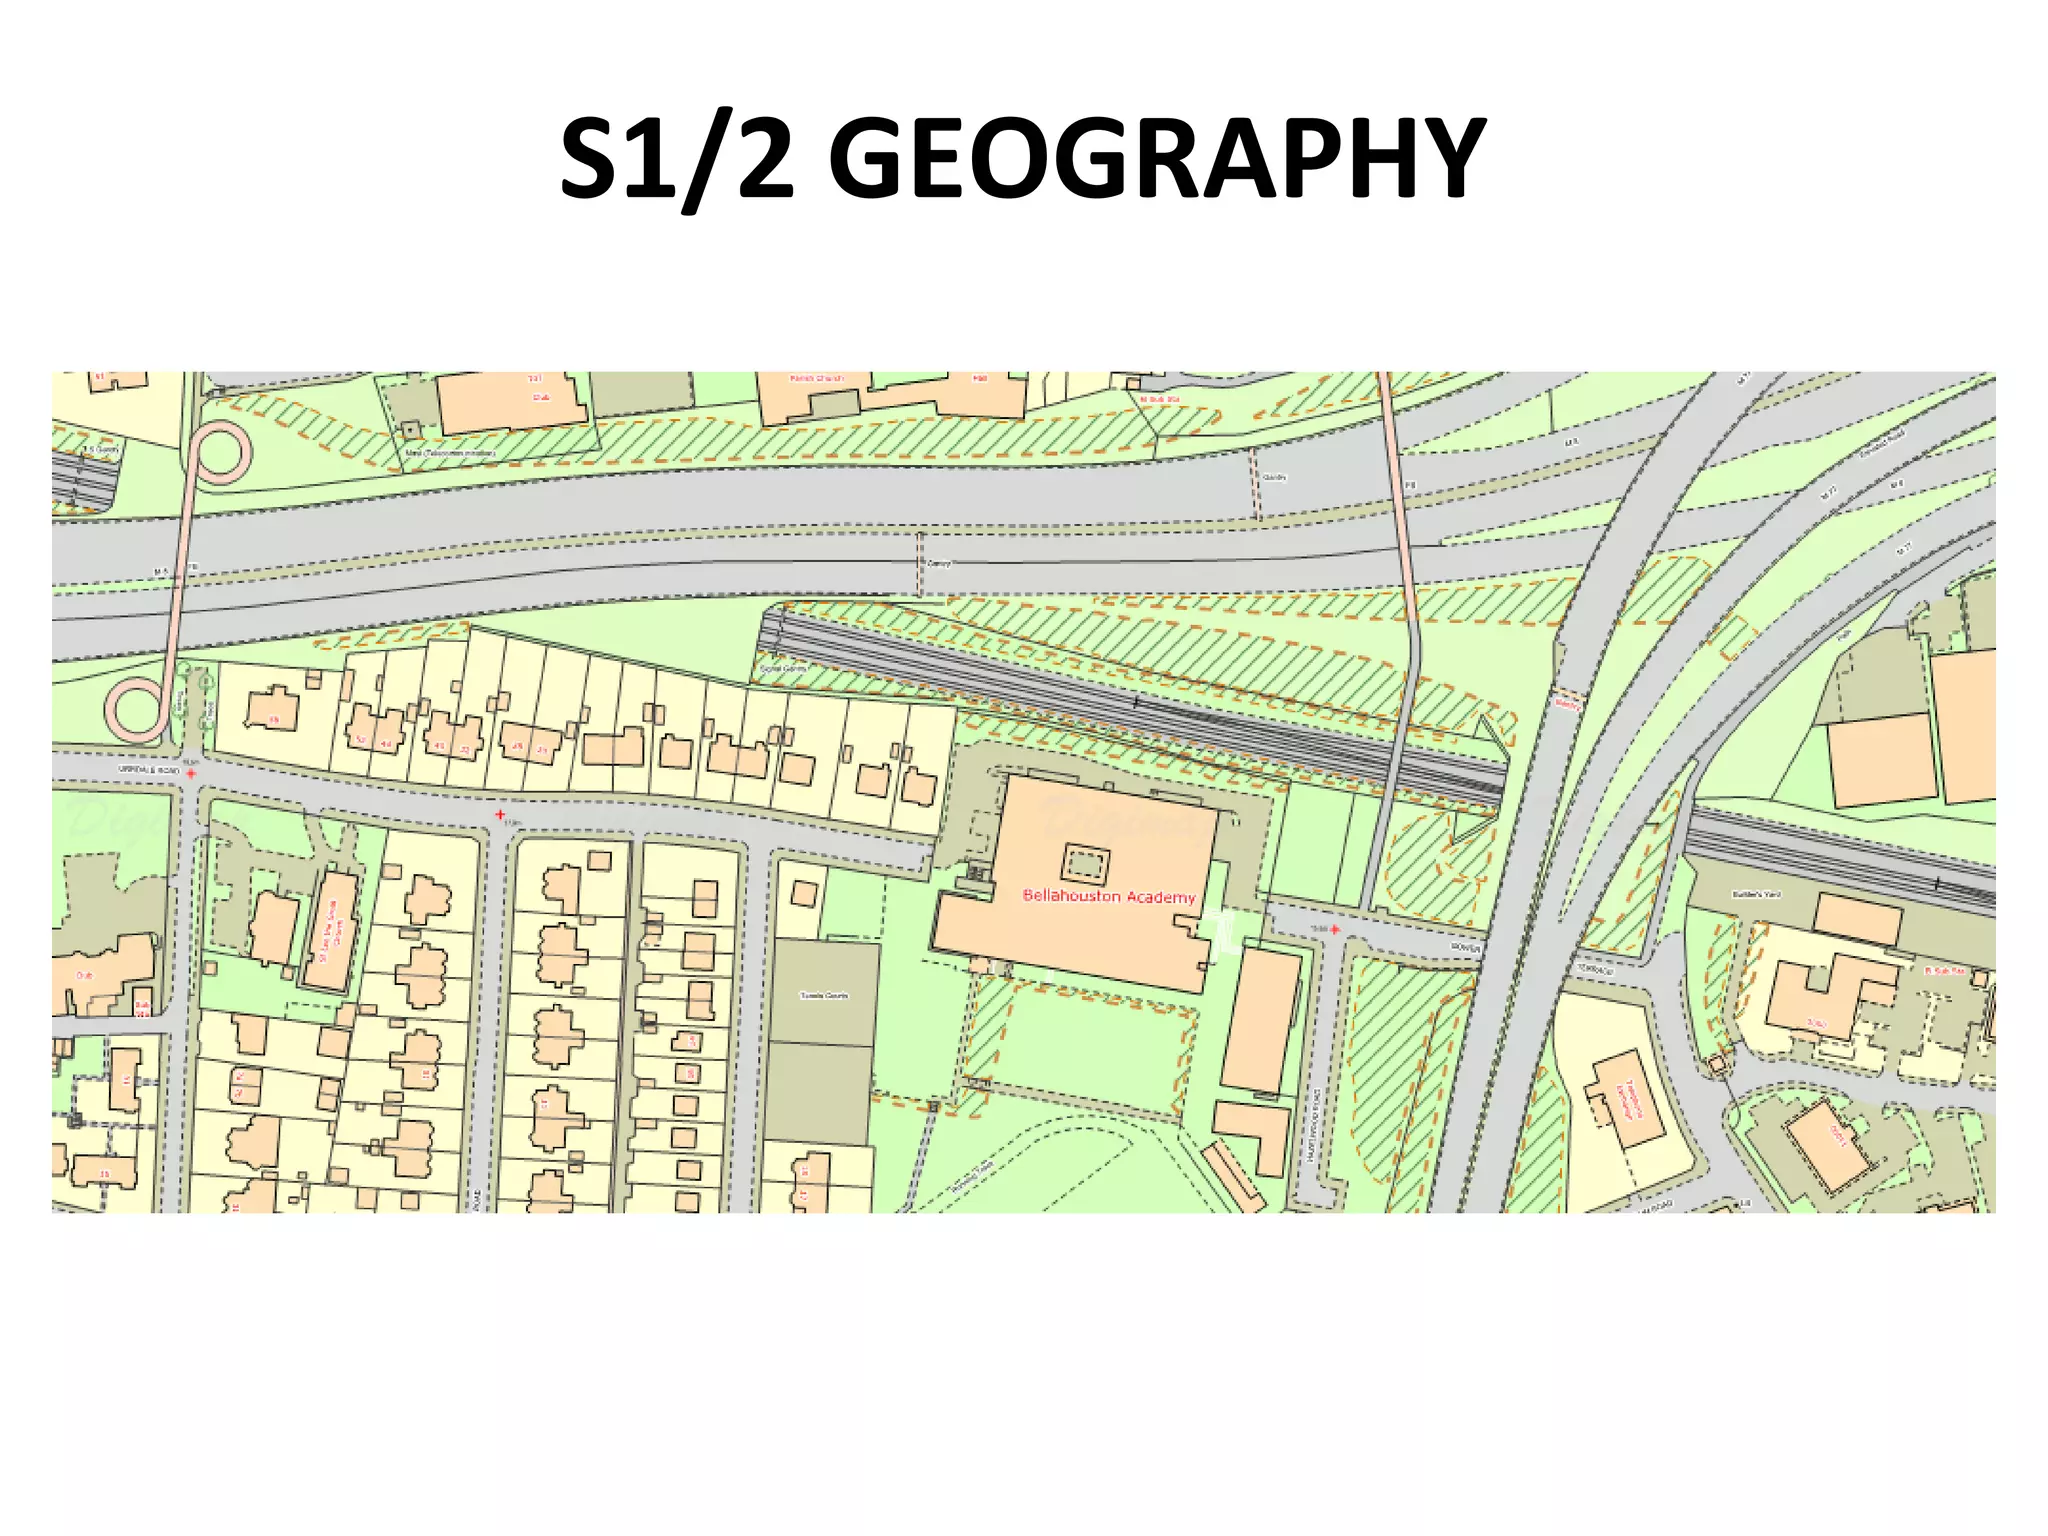
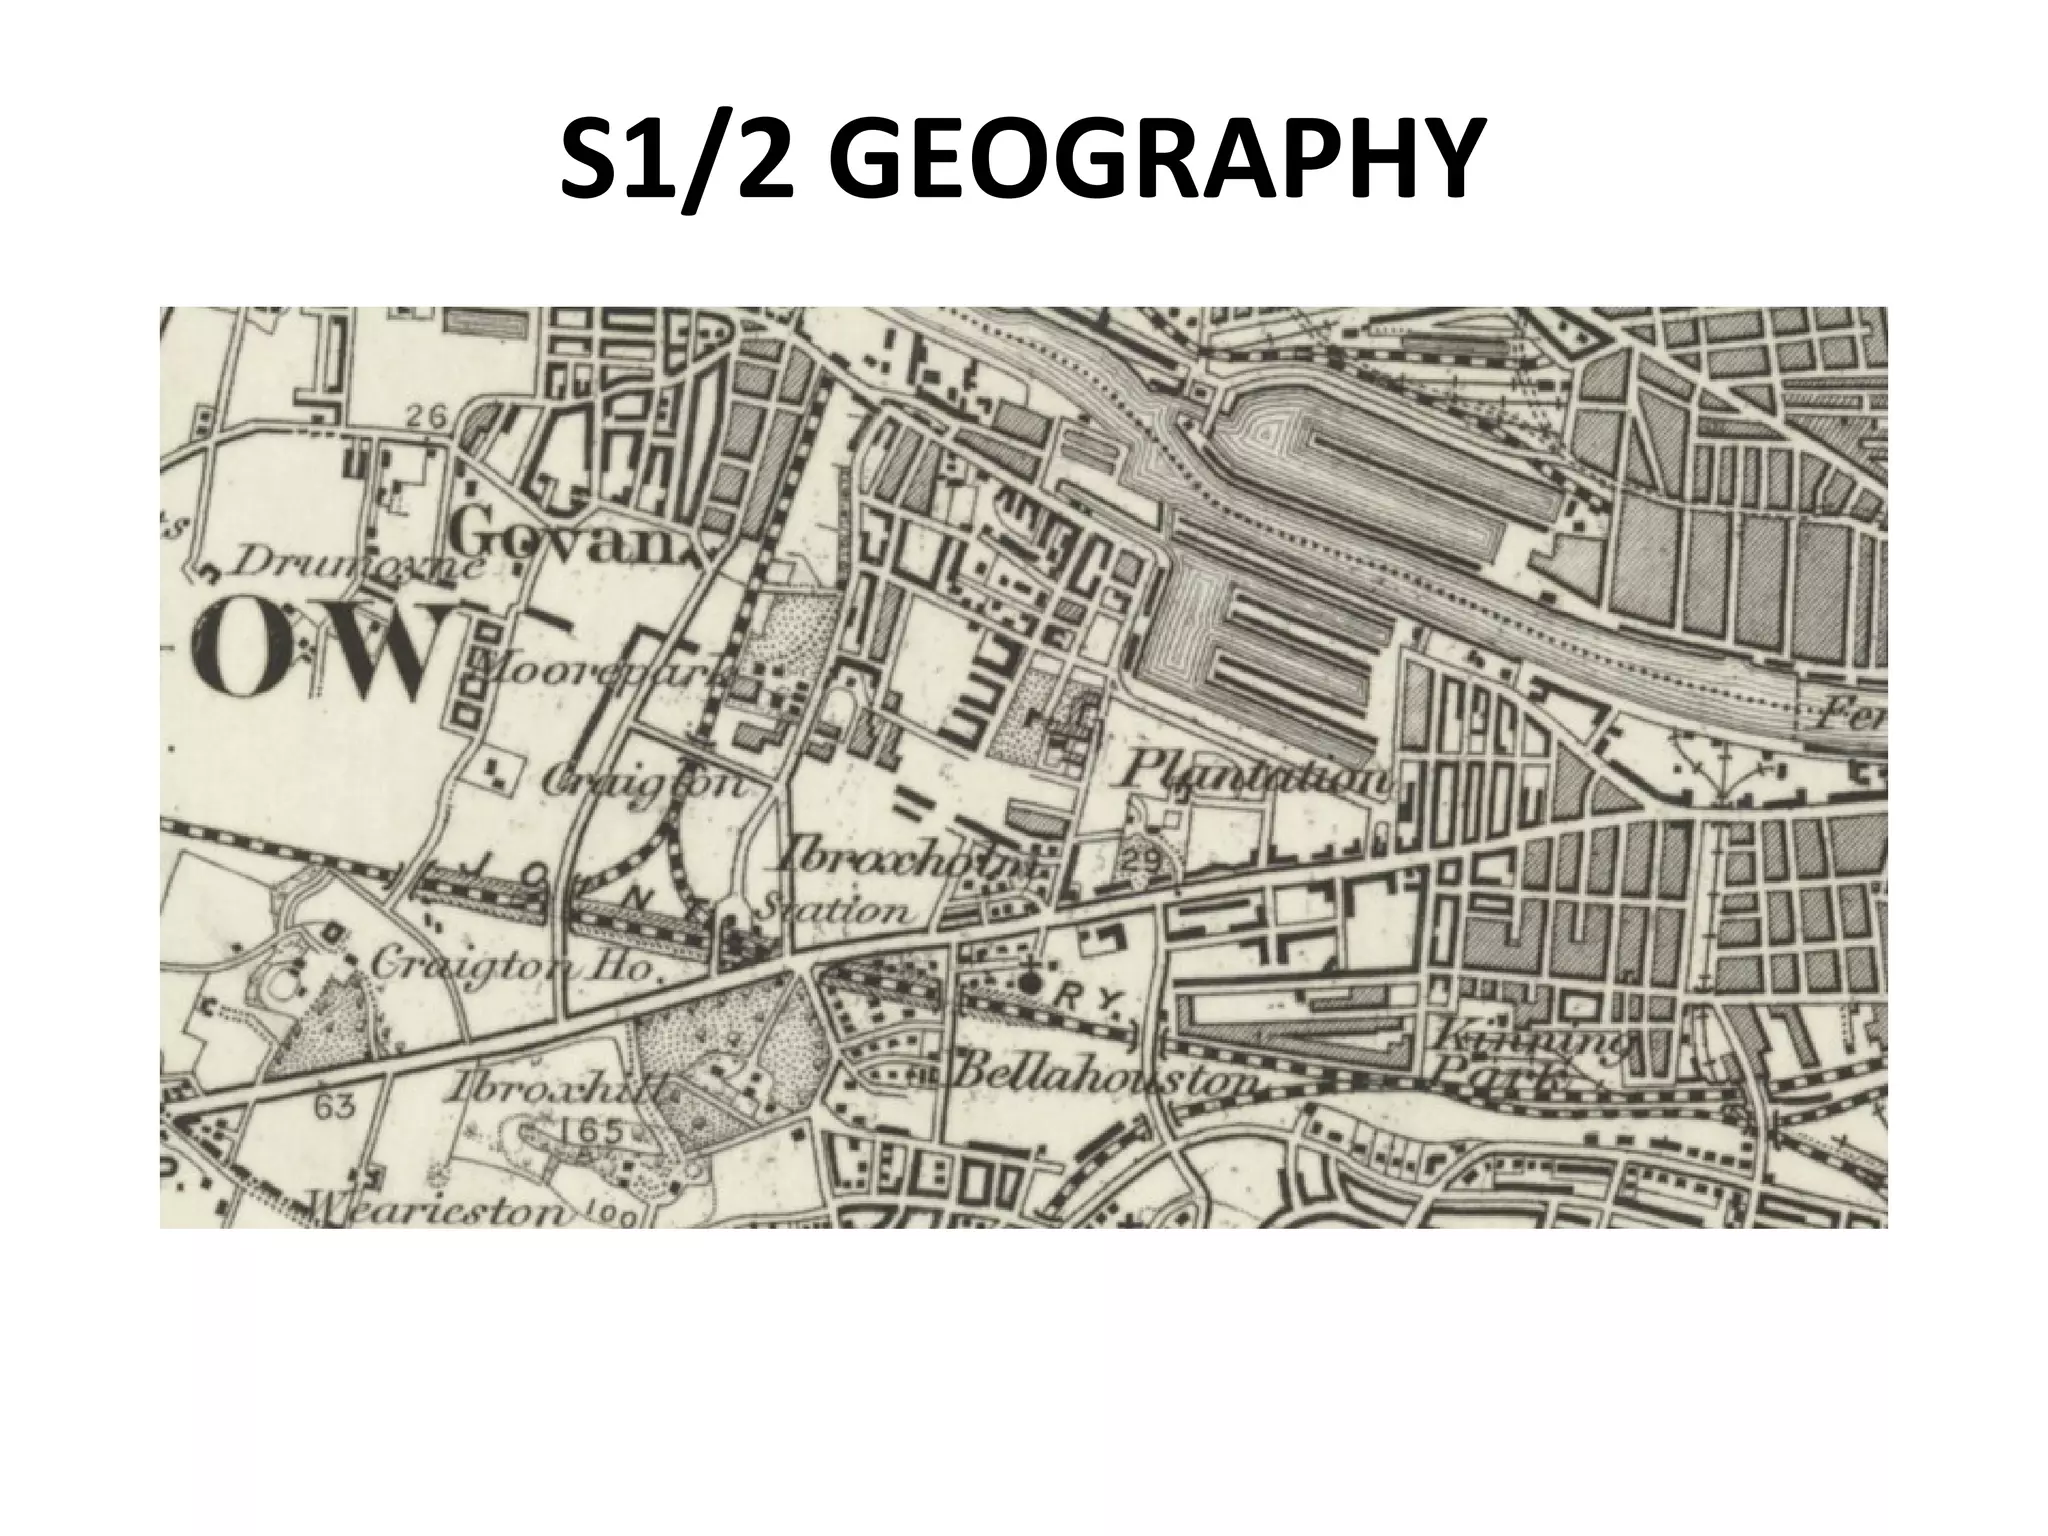
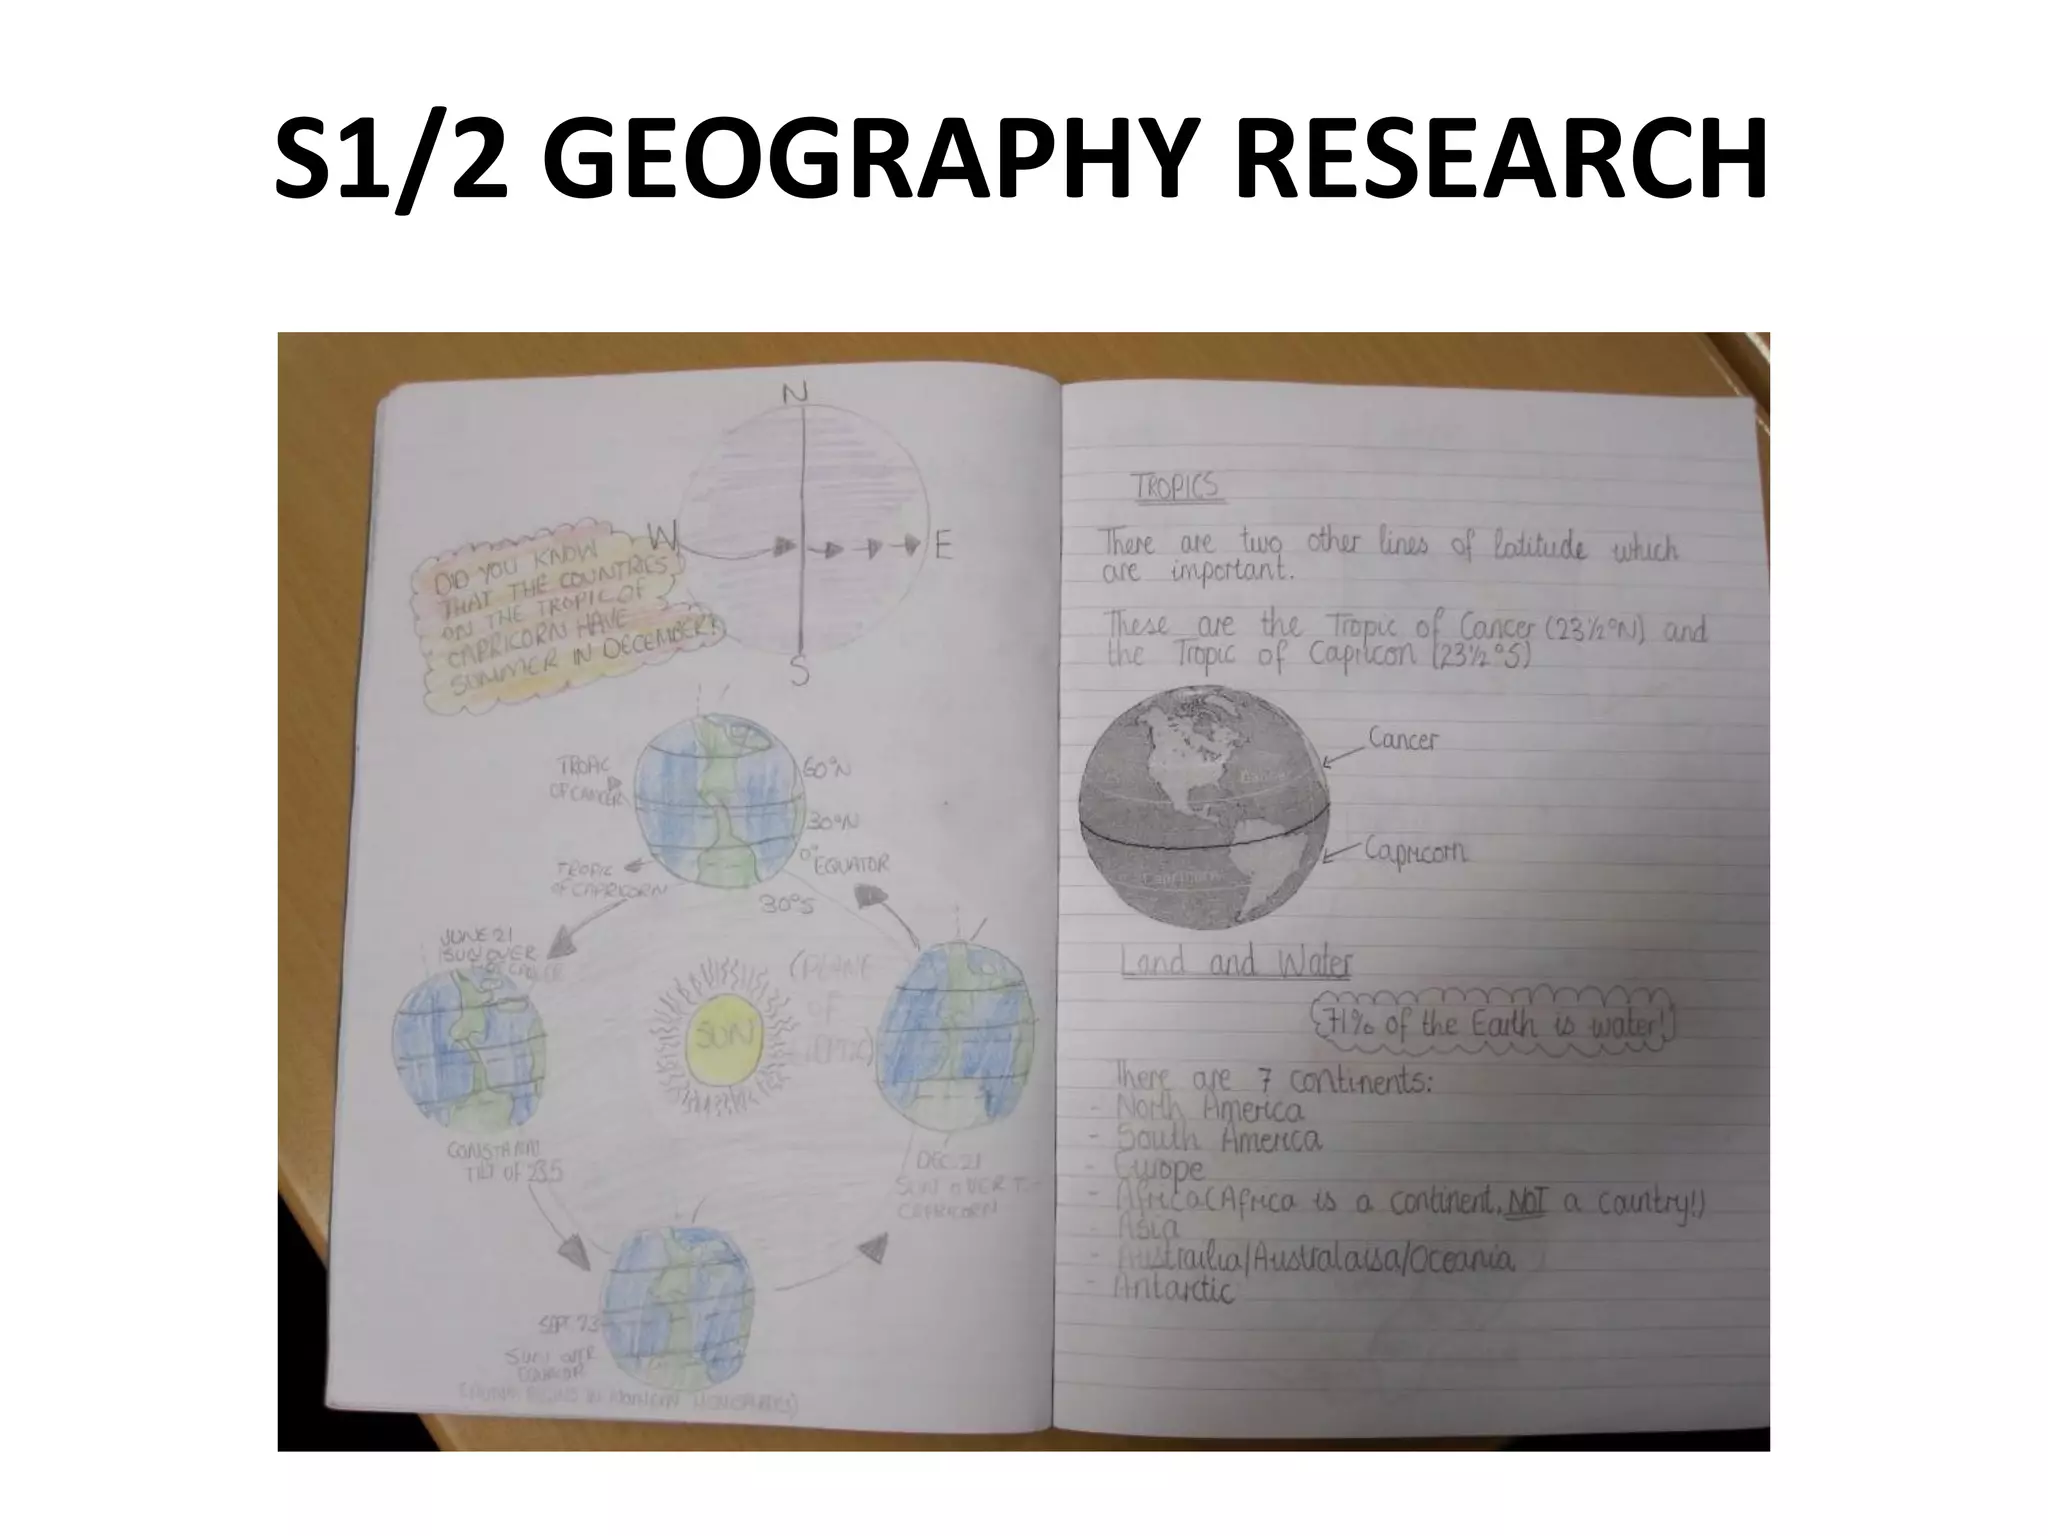
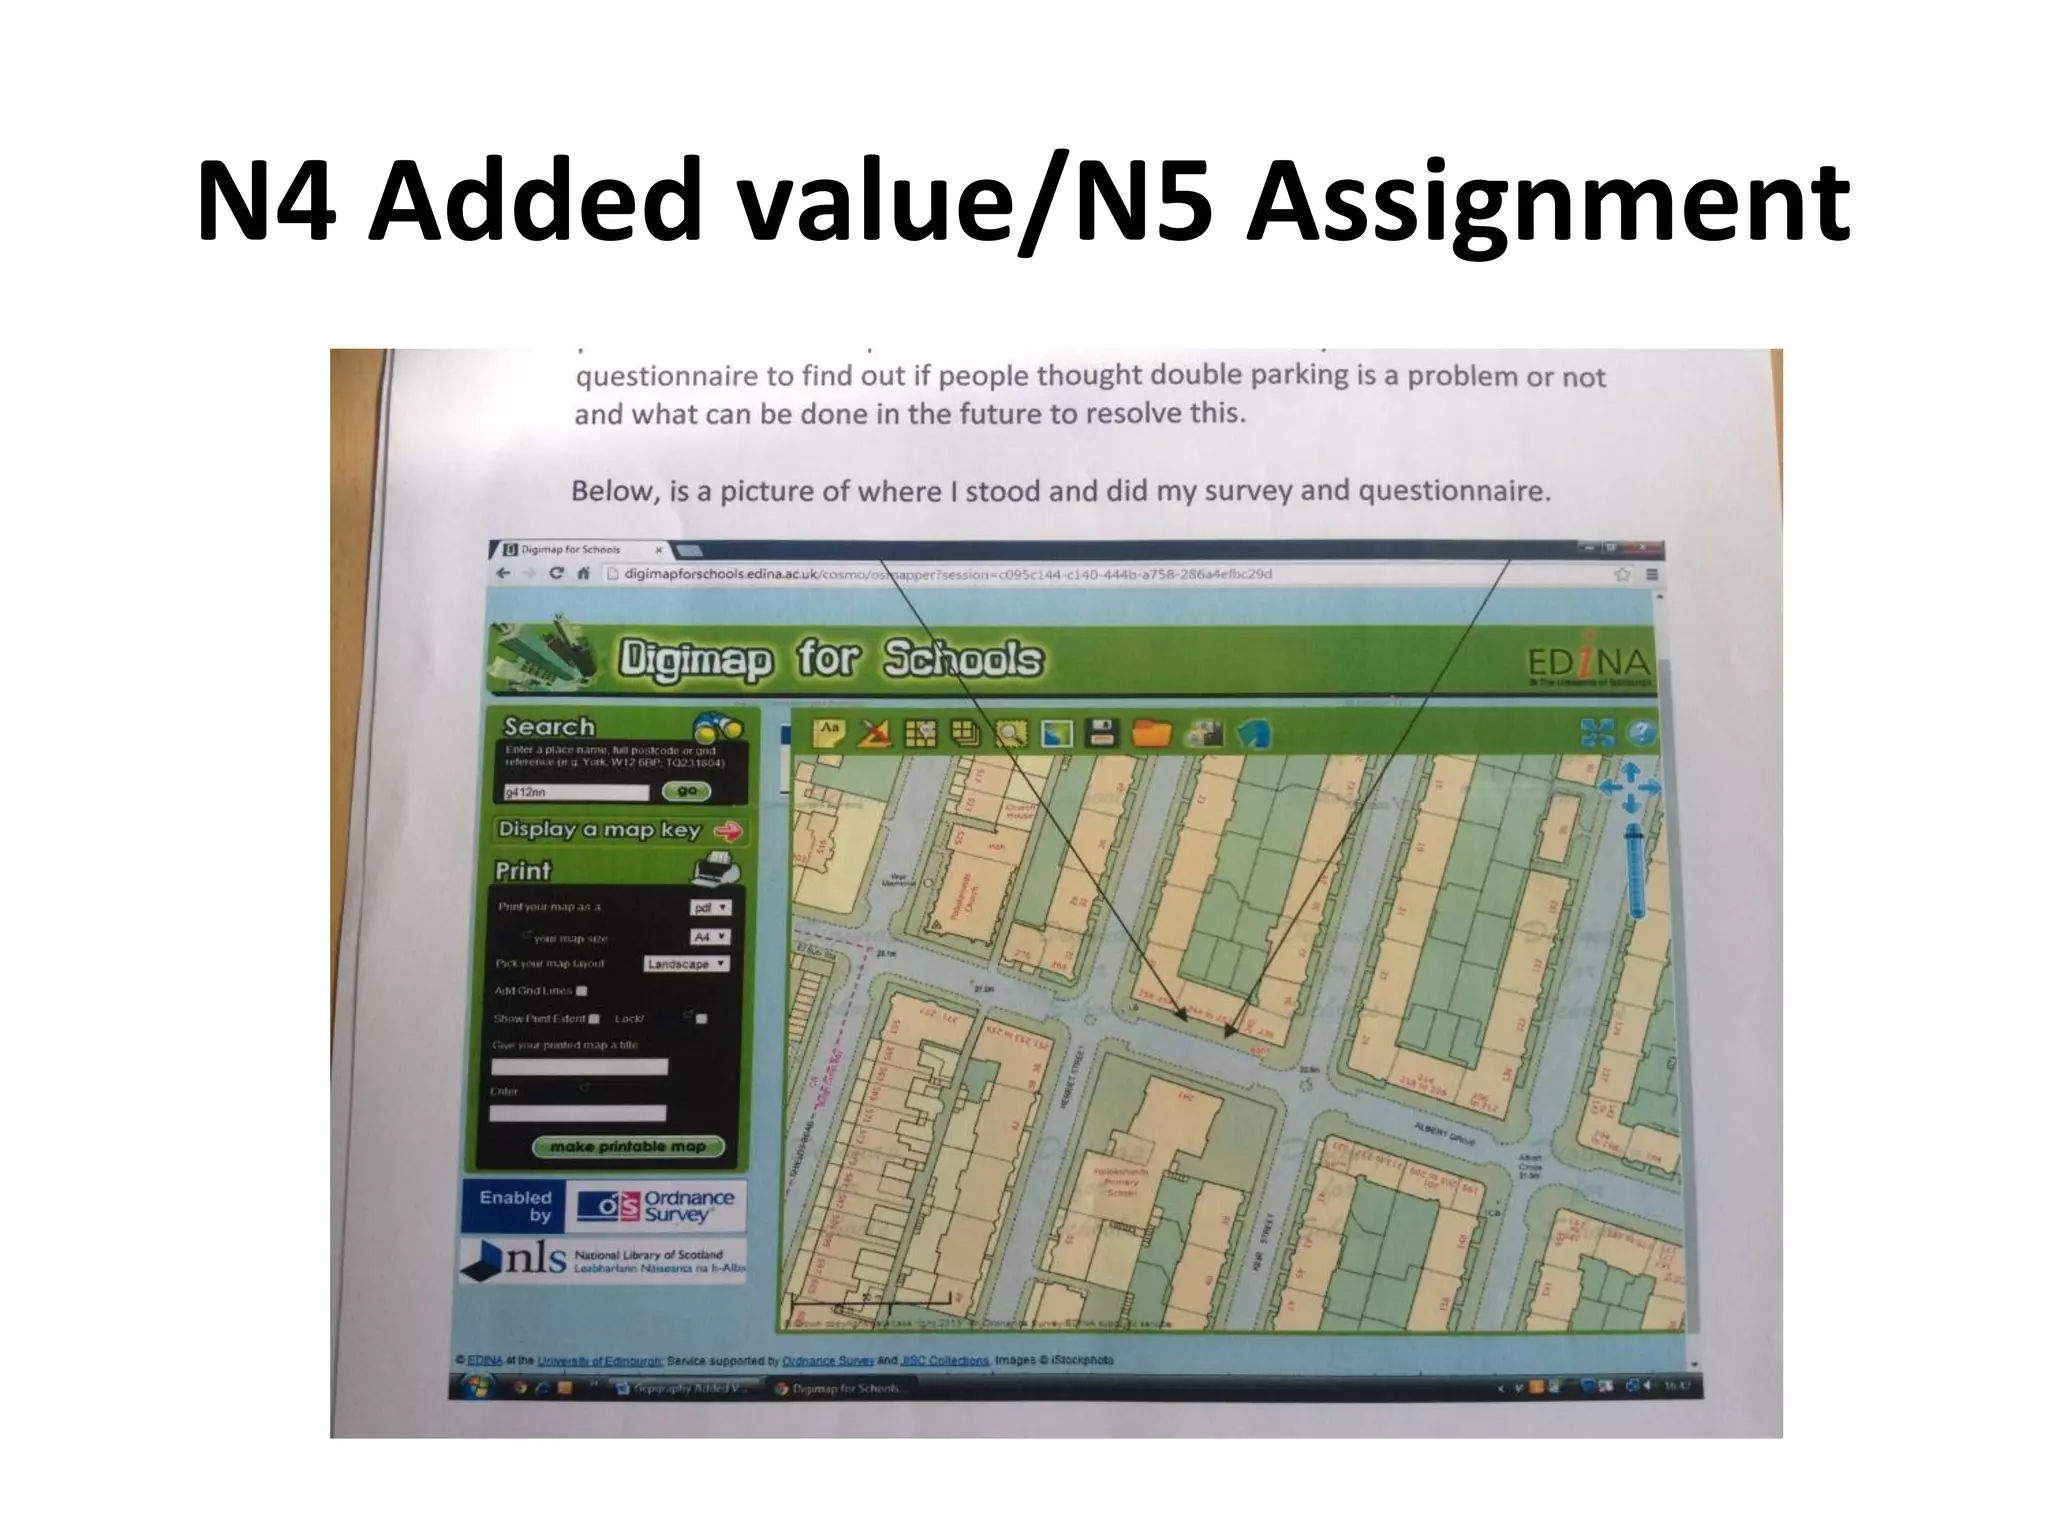
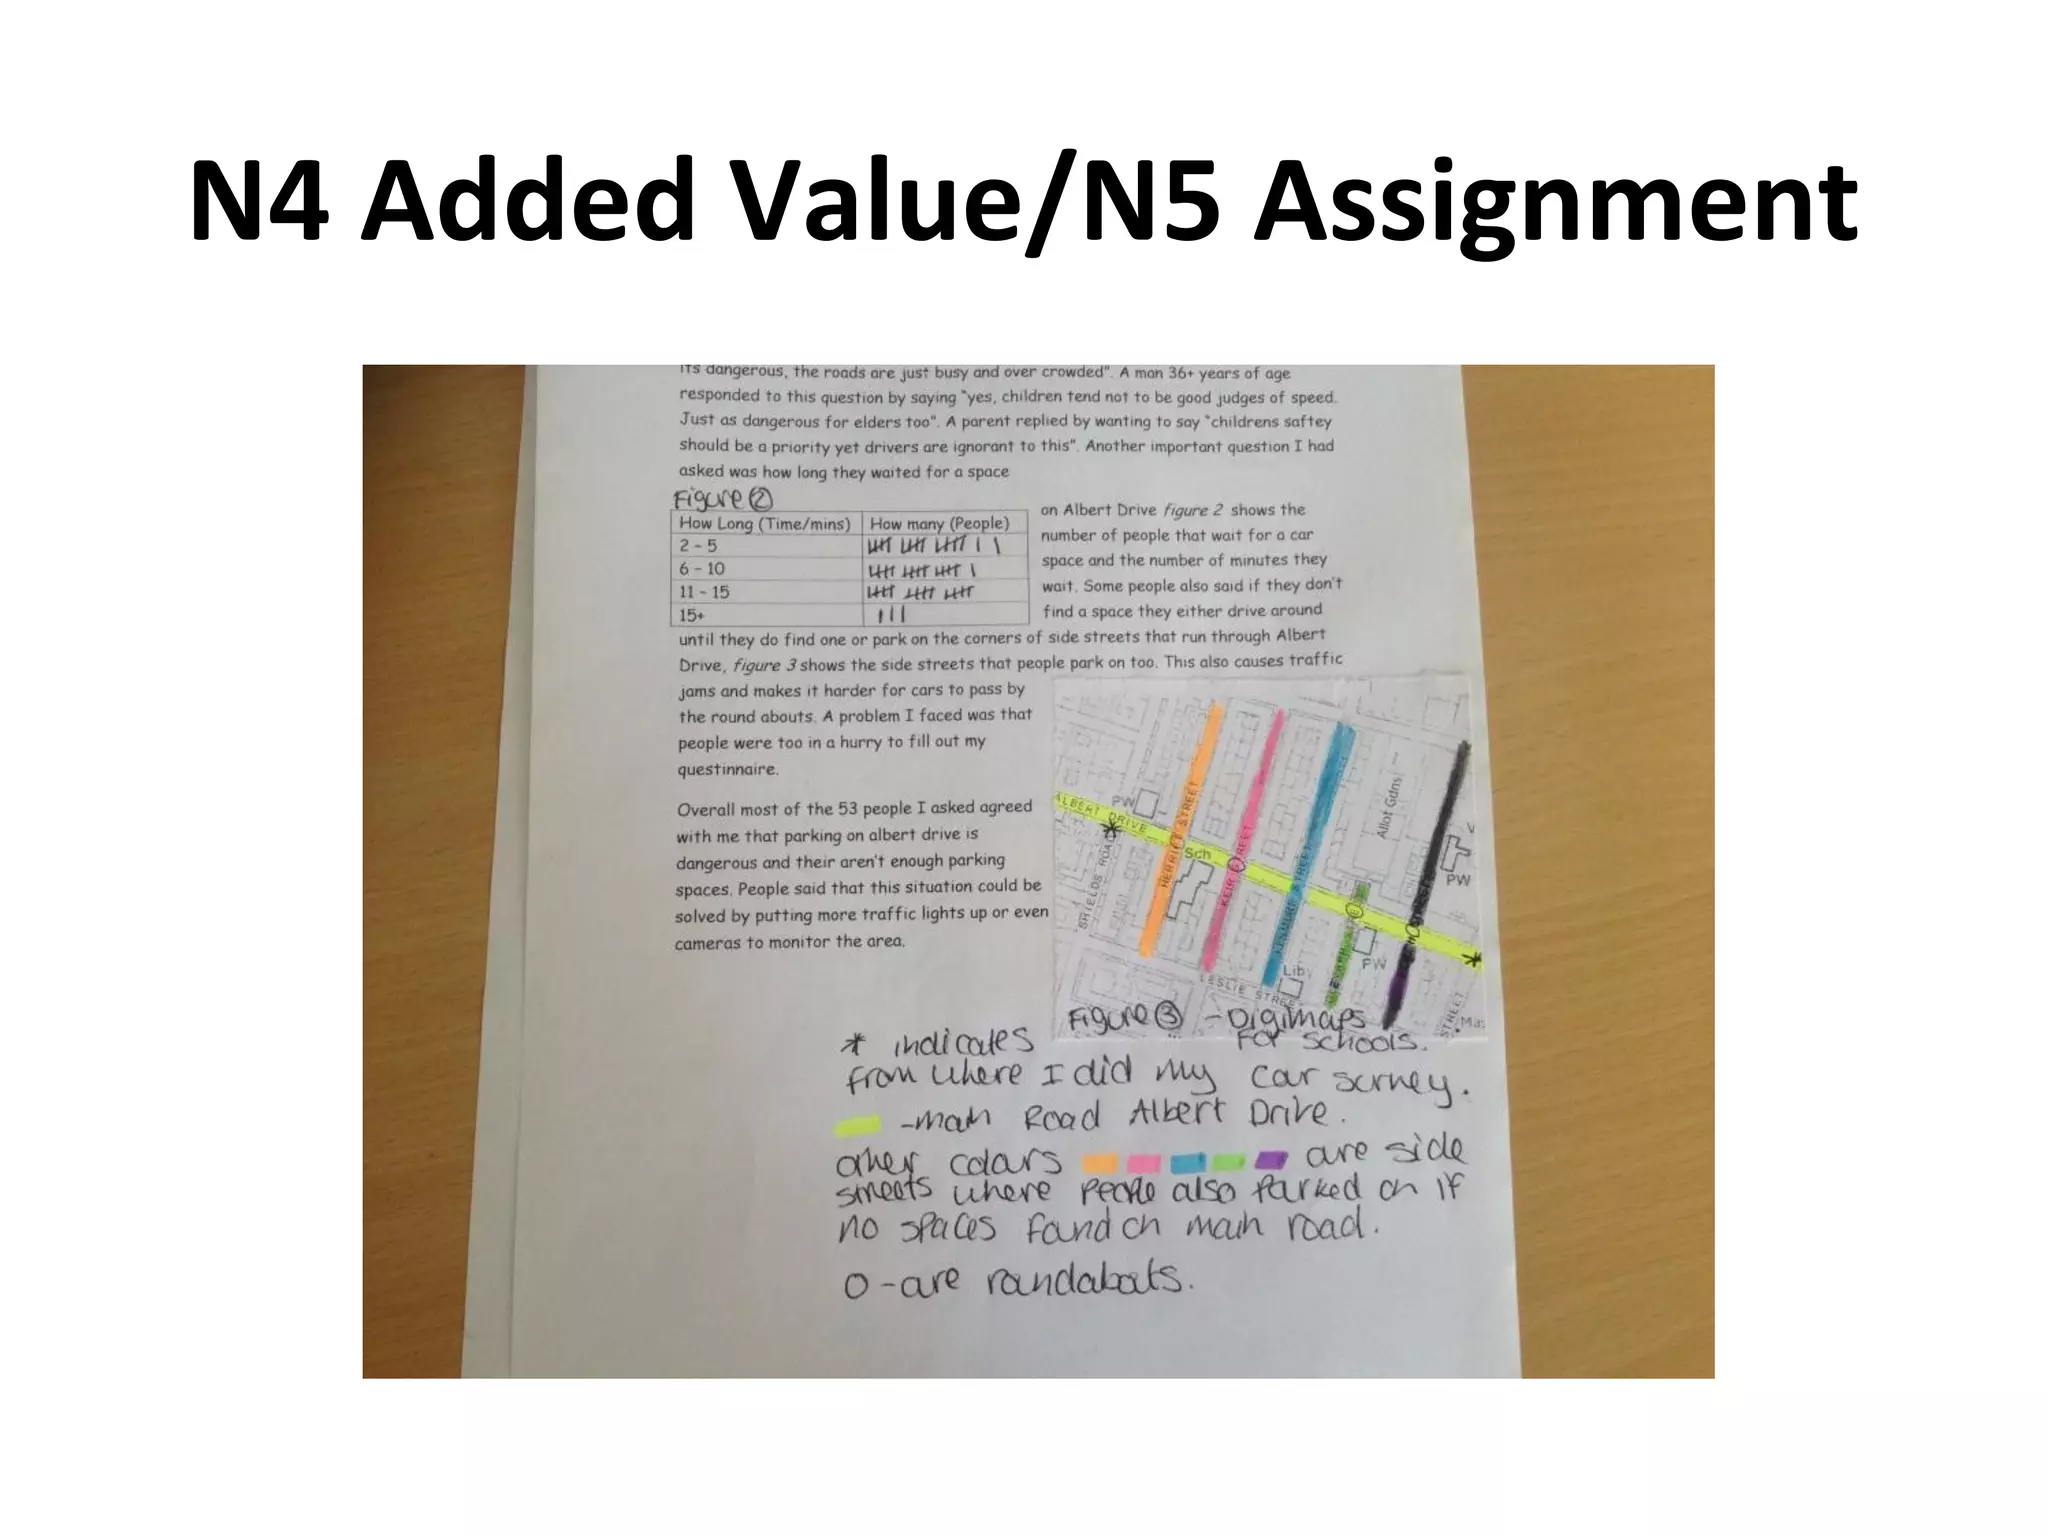


The presentation discusses the importance of spatial literacy in the workforce and outlines how geographic information systems (GIS) can enhance critical thinking and problem-solving skills among students. It emphasizes integrating spatial literacy into the school curriculum to prepare young people for employment opportunities in various industries. Examples from Barrhead High School and Bellahouston Academy illustrate the practical use of digimaps in teaching and understanding geographic concepts.