Download to read offline


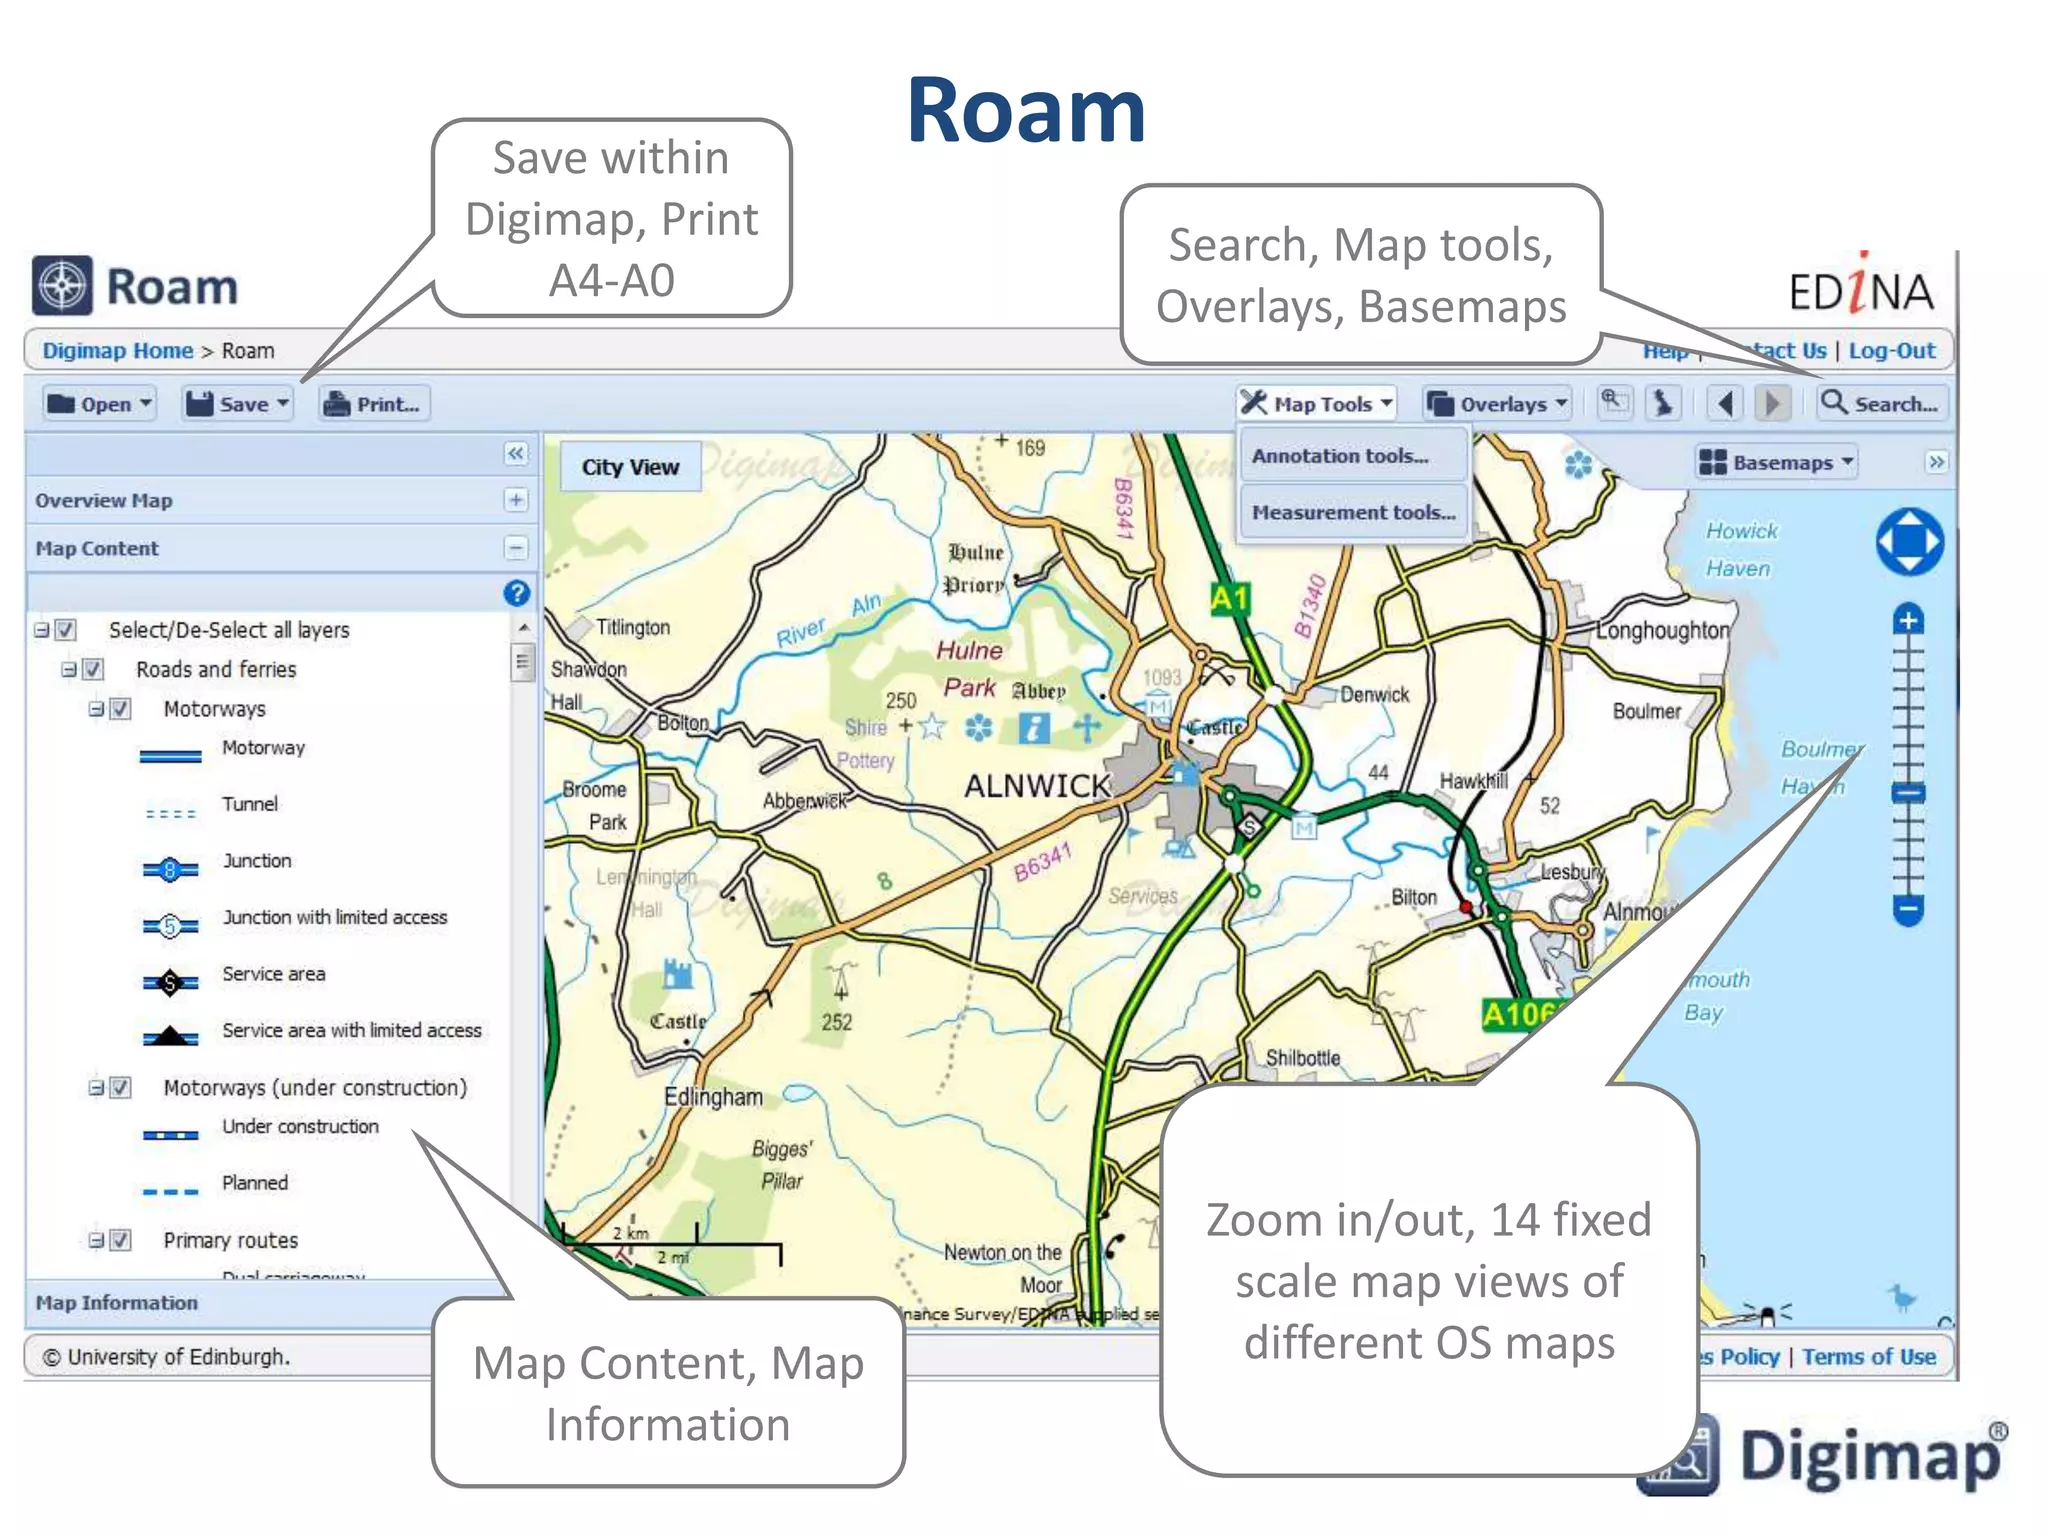


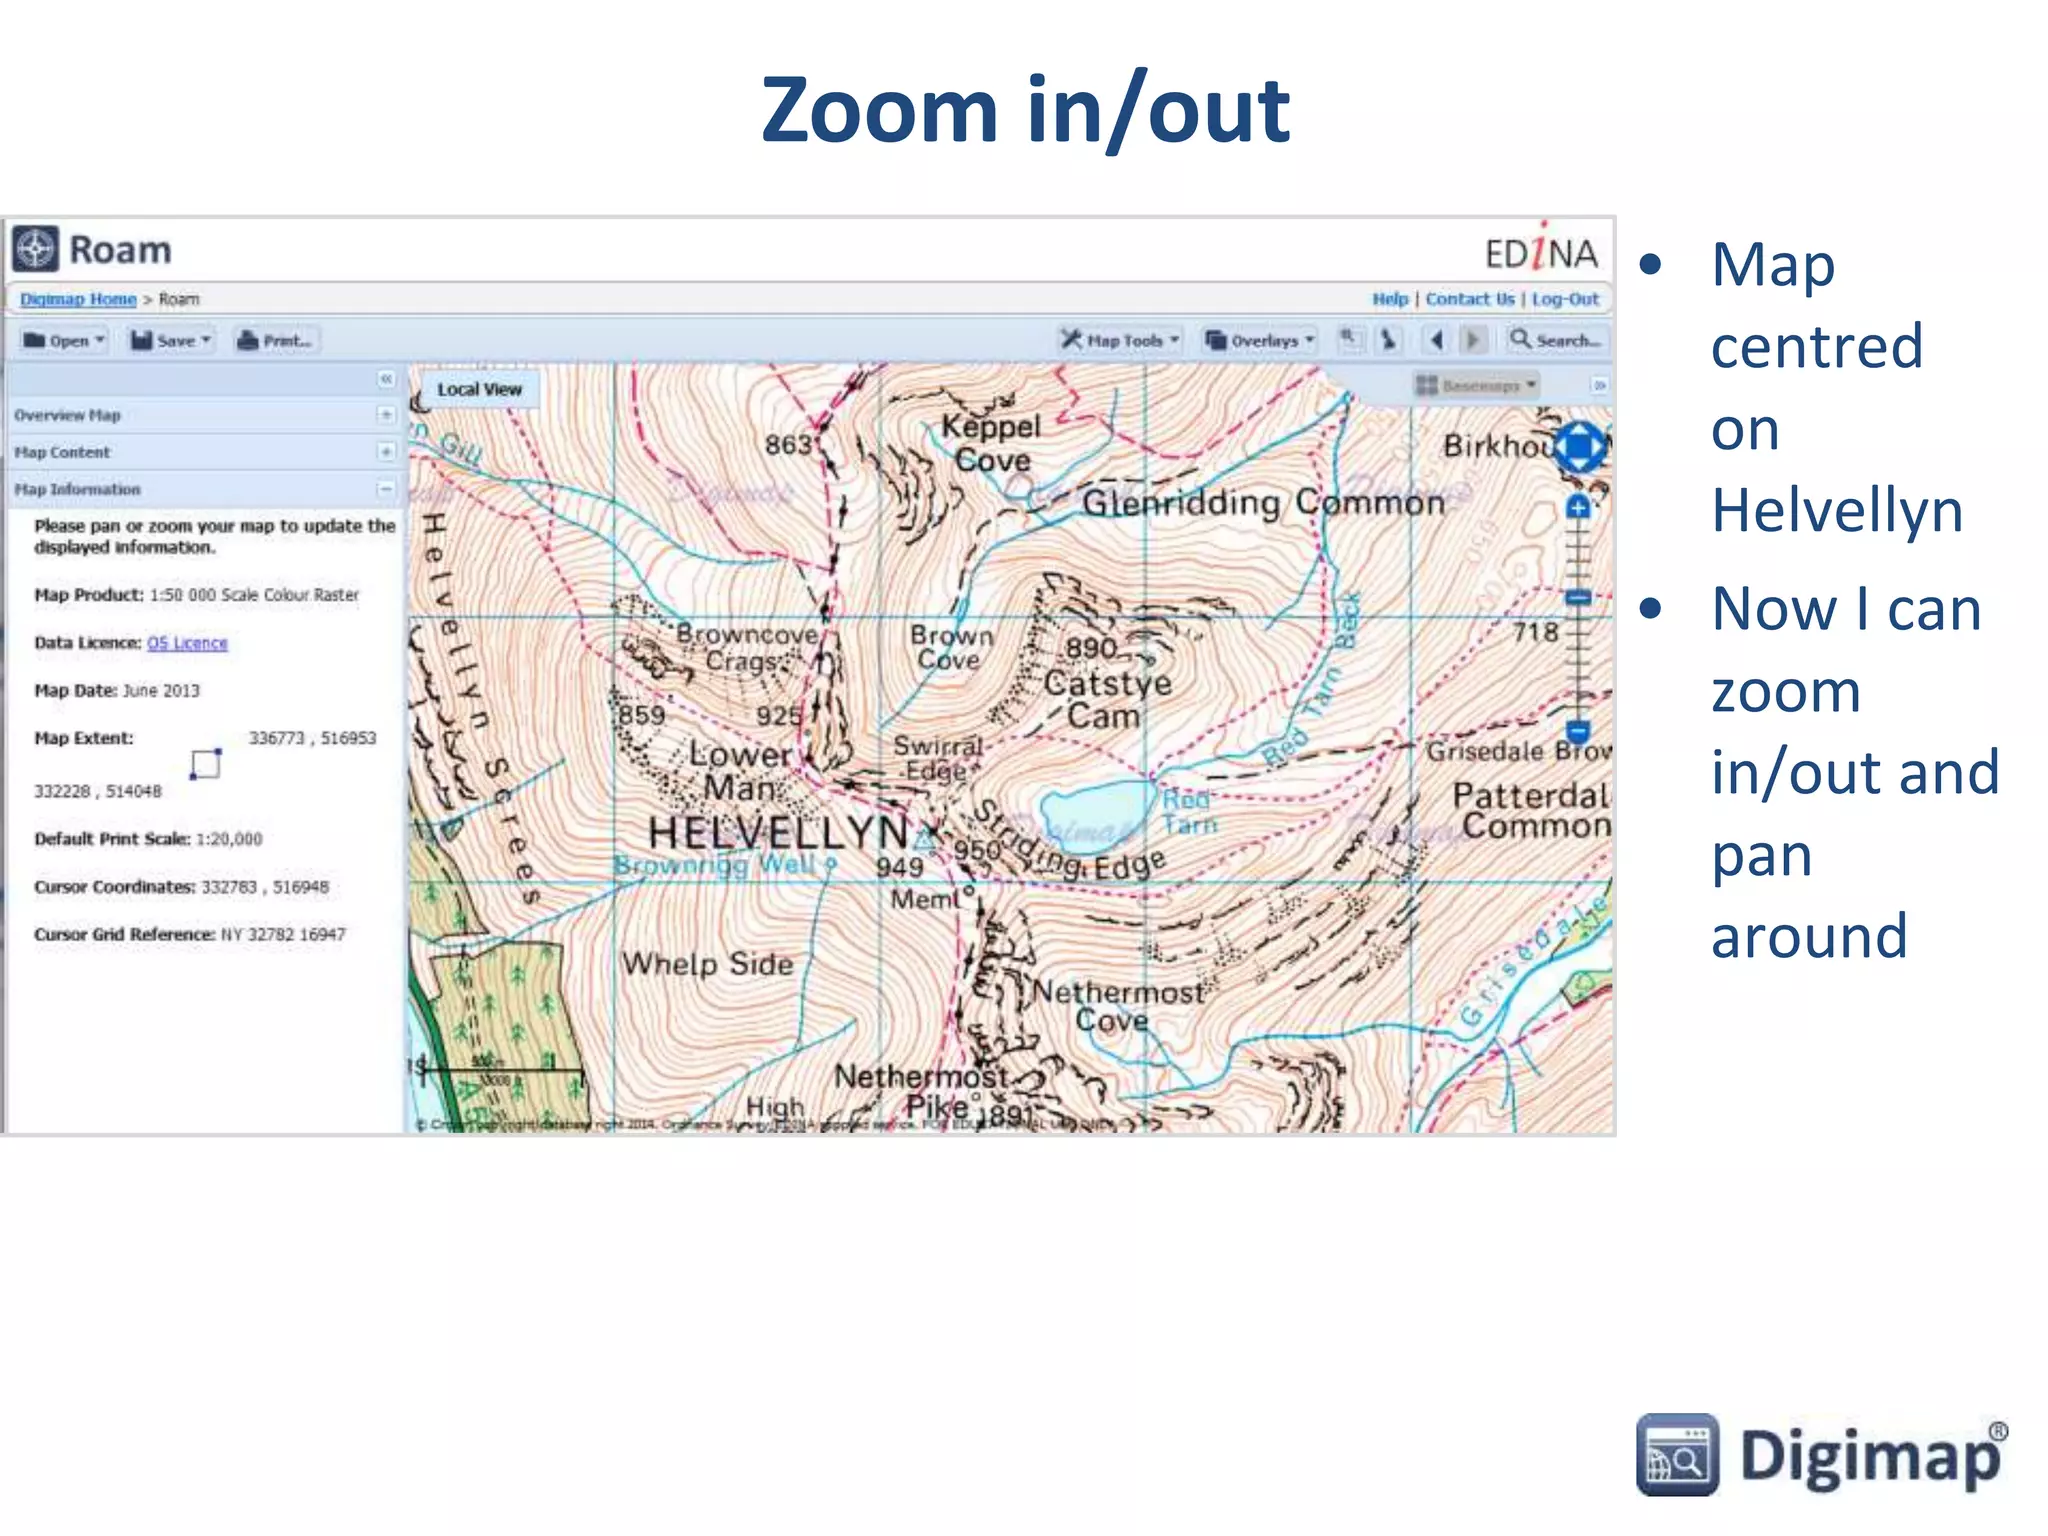


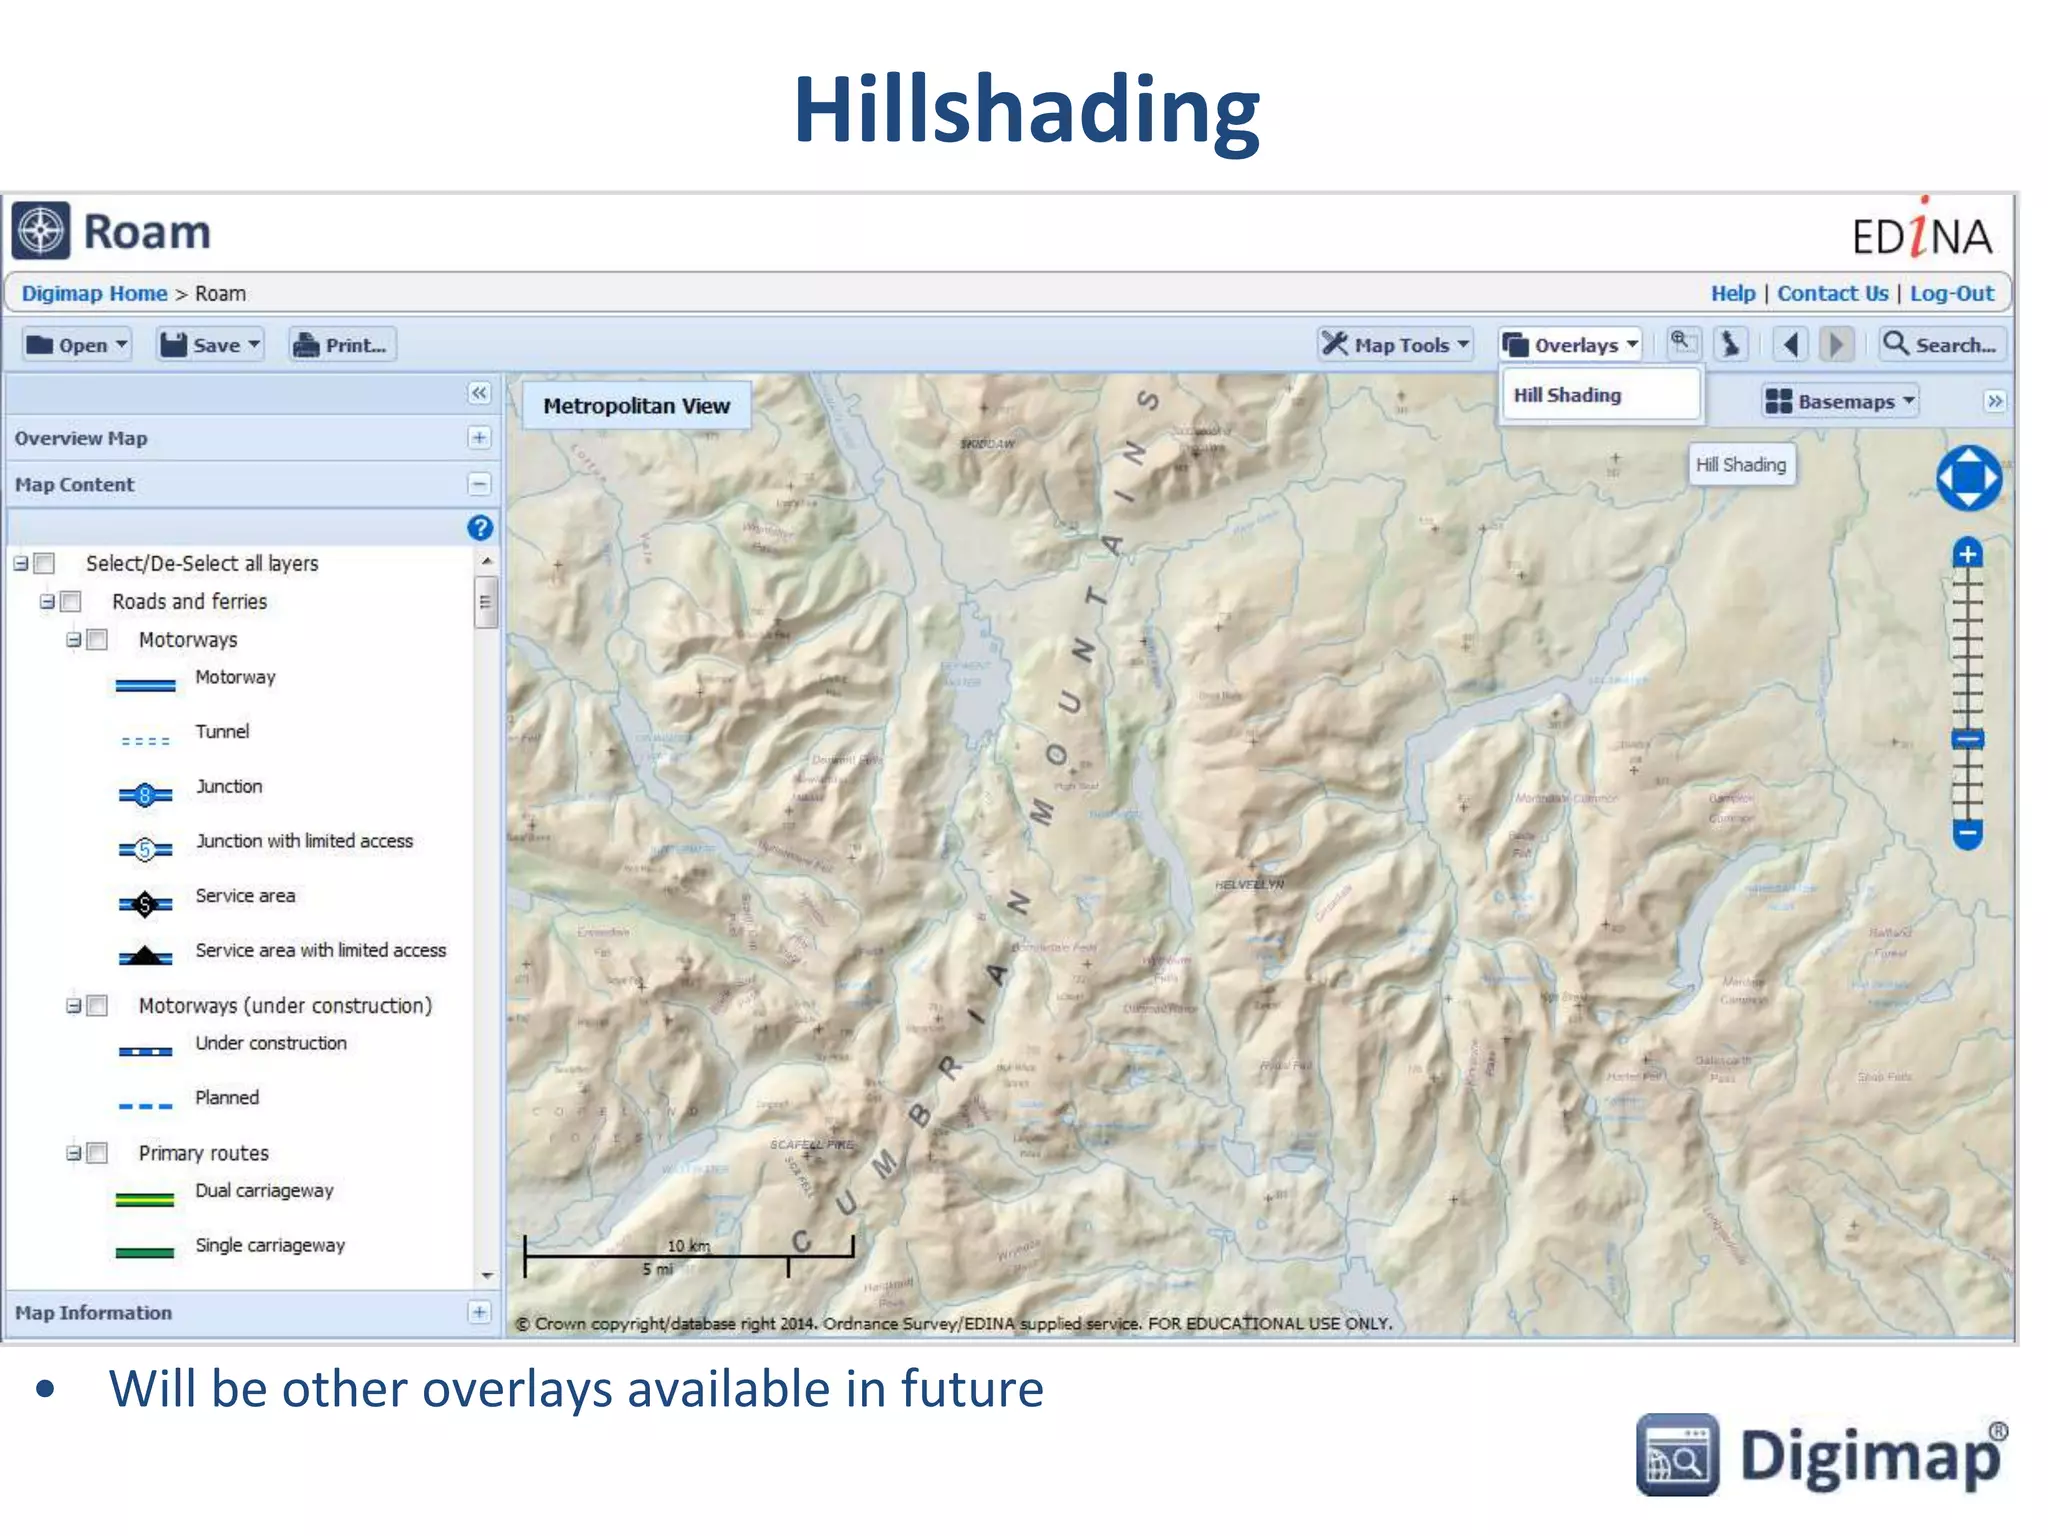


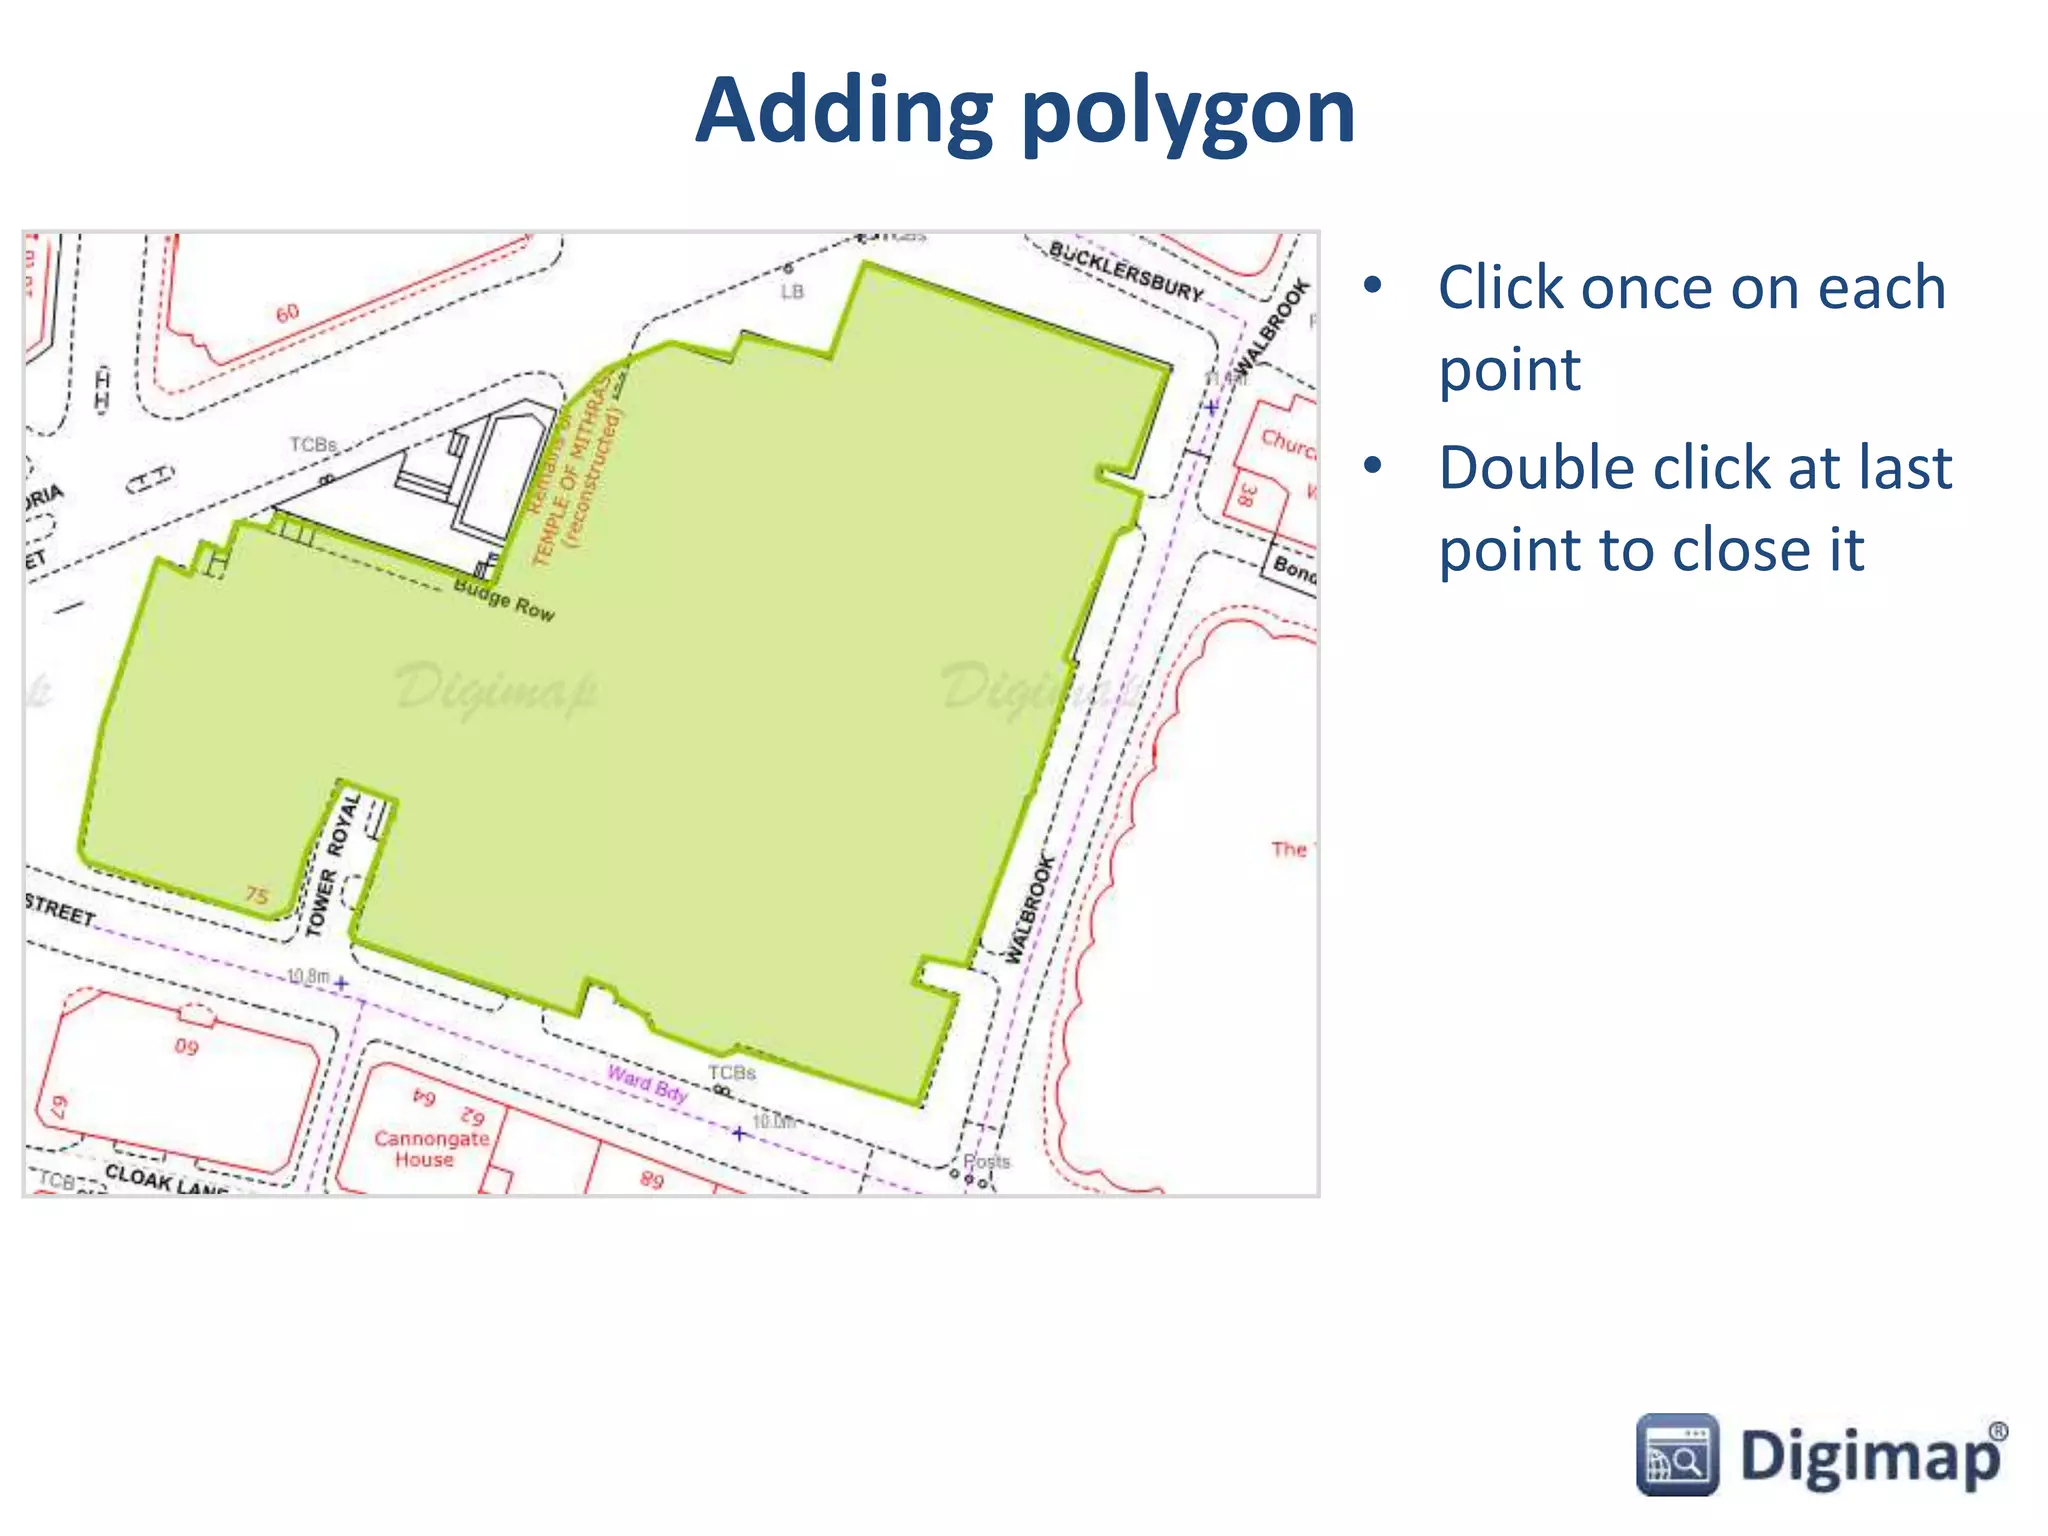
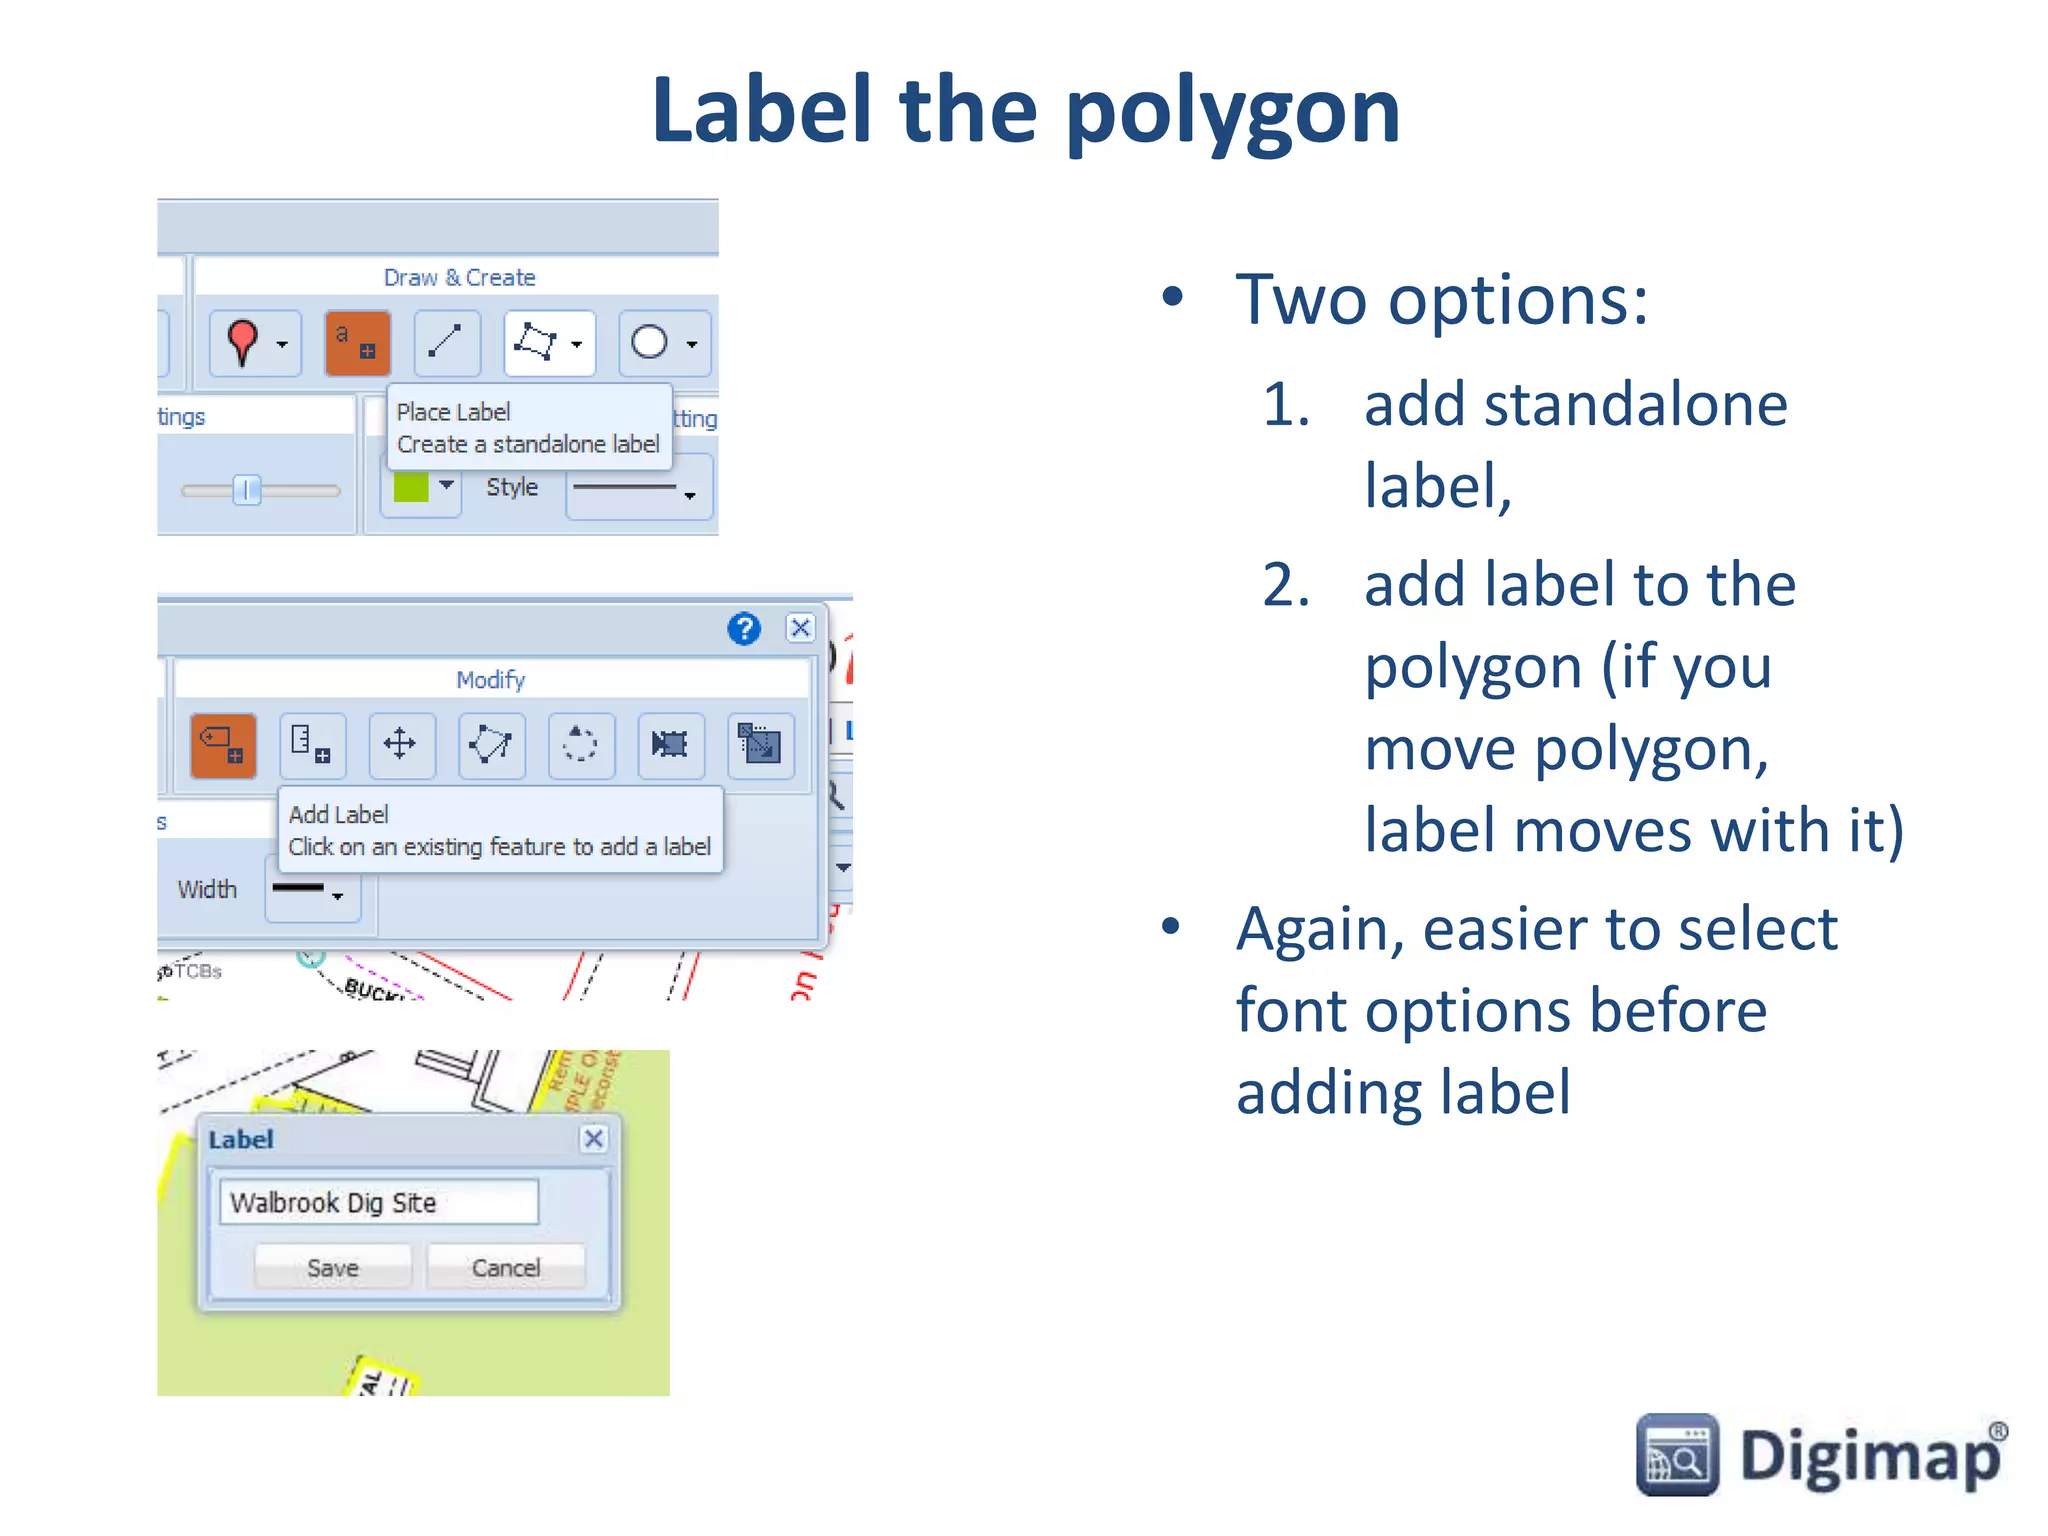
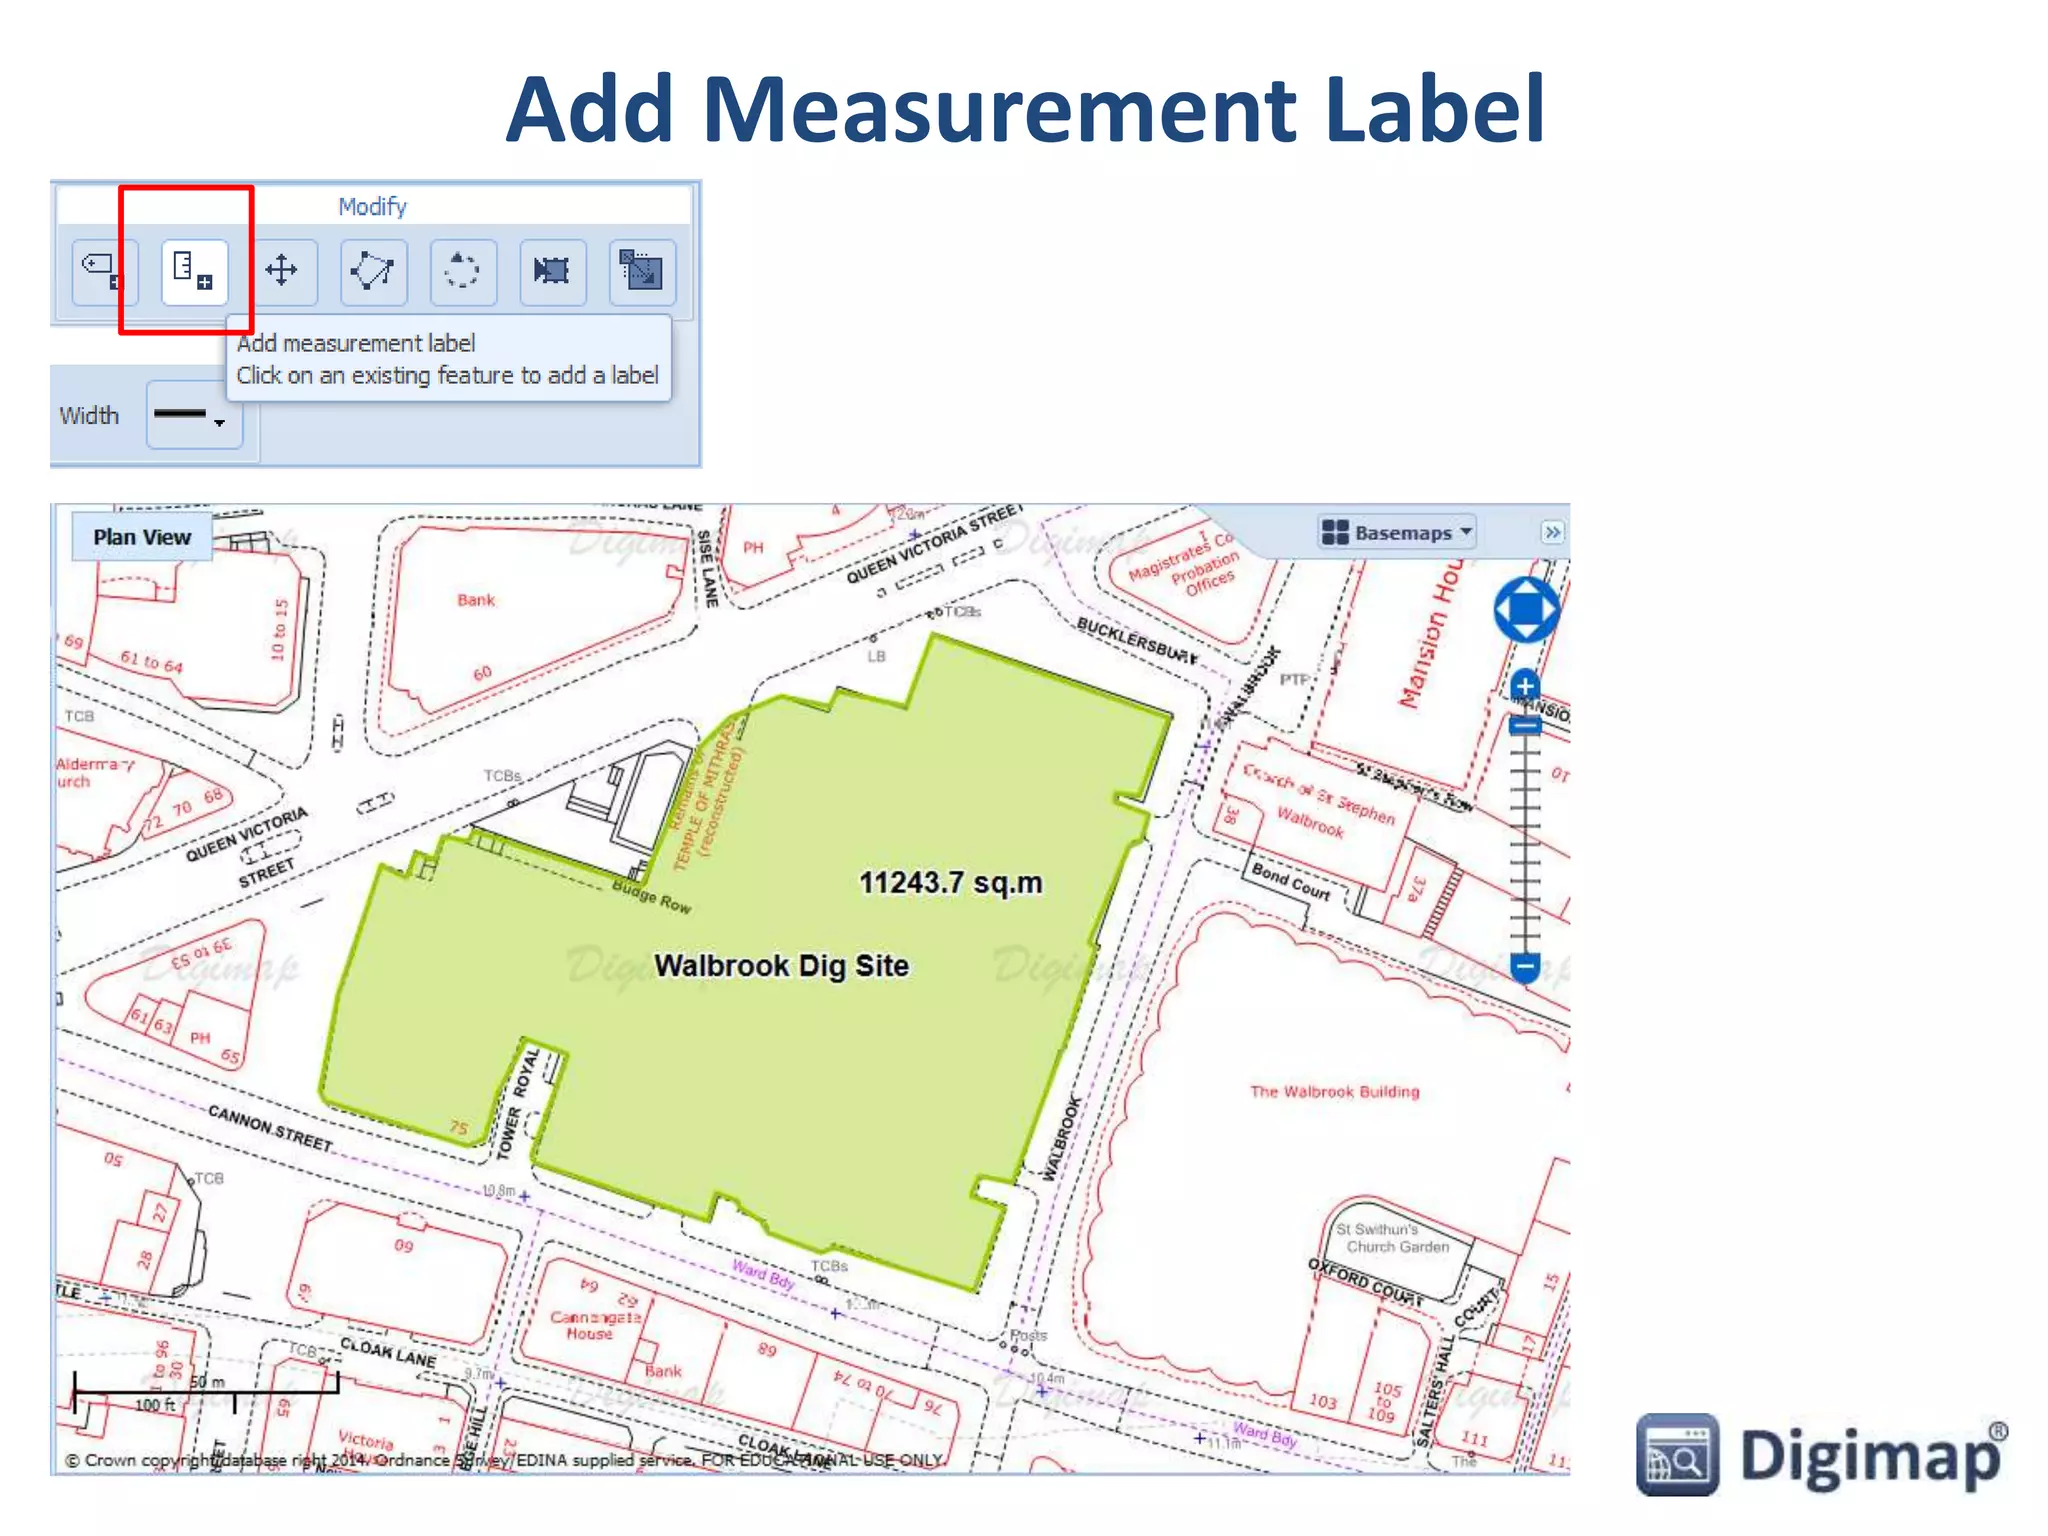


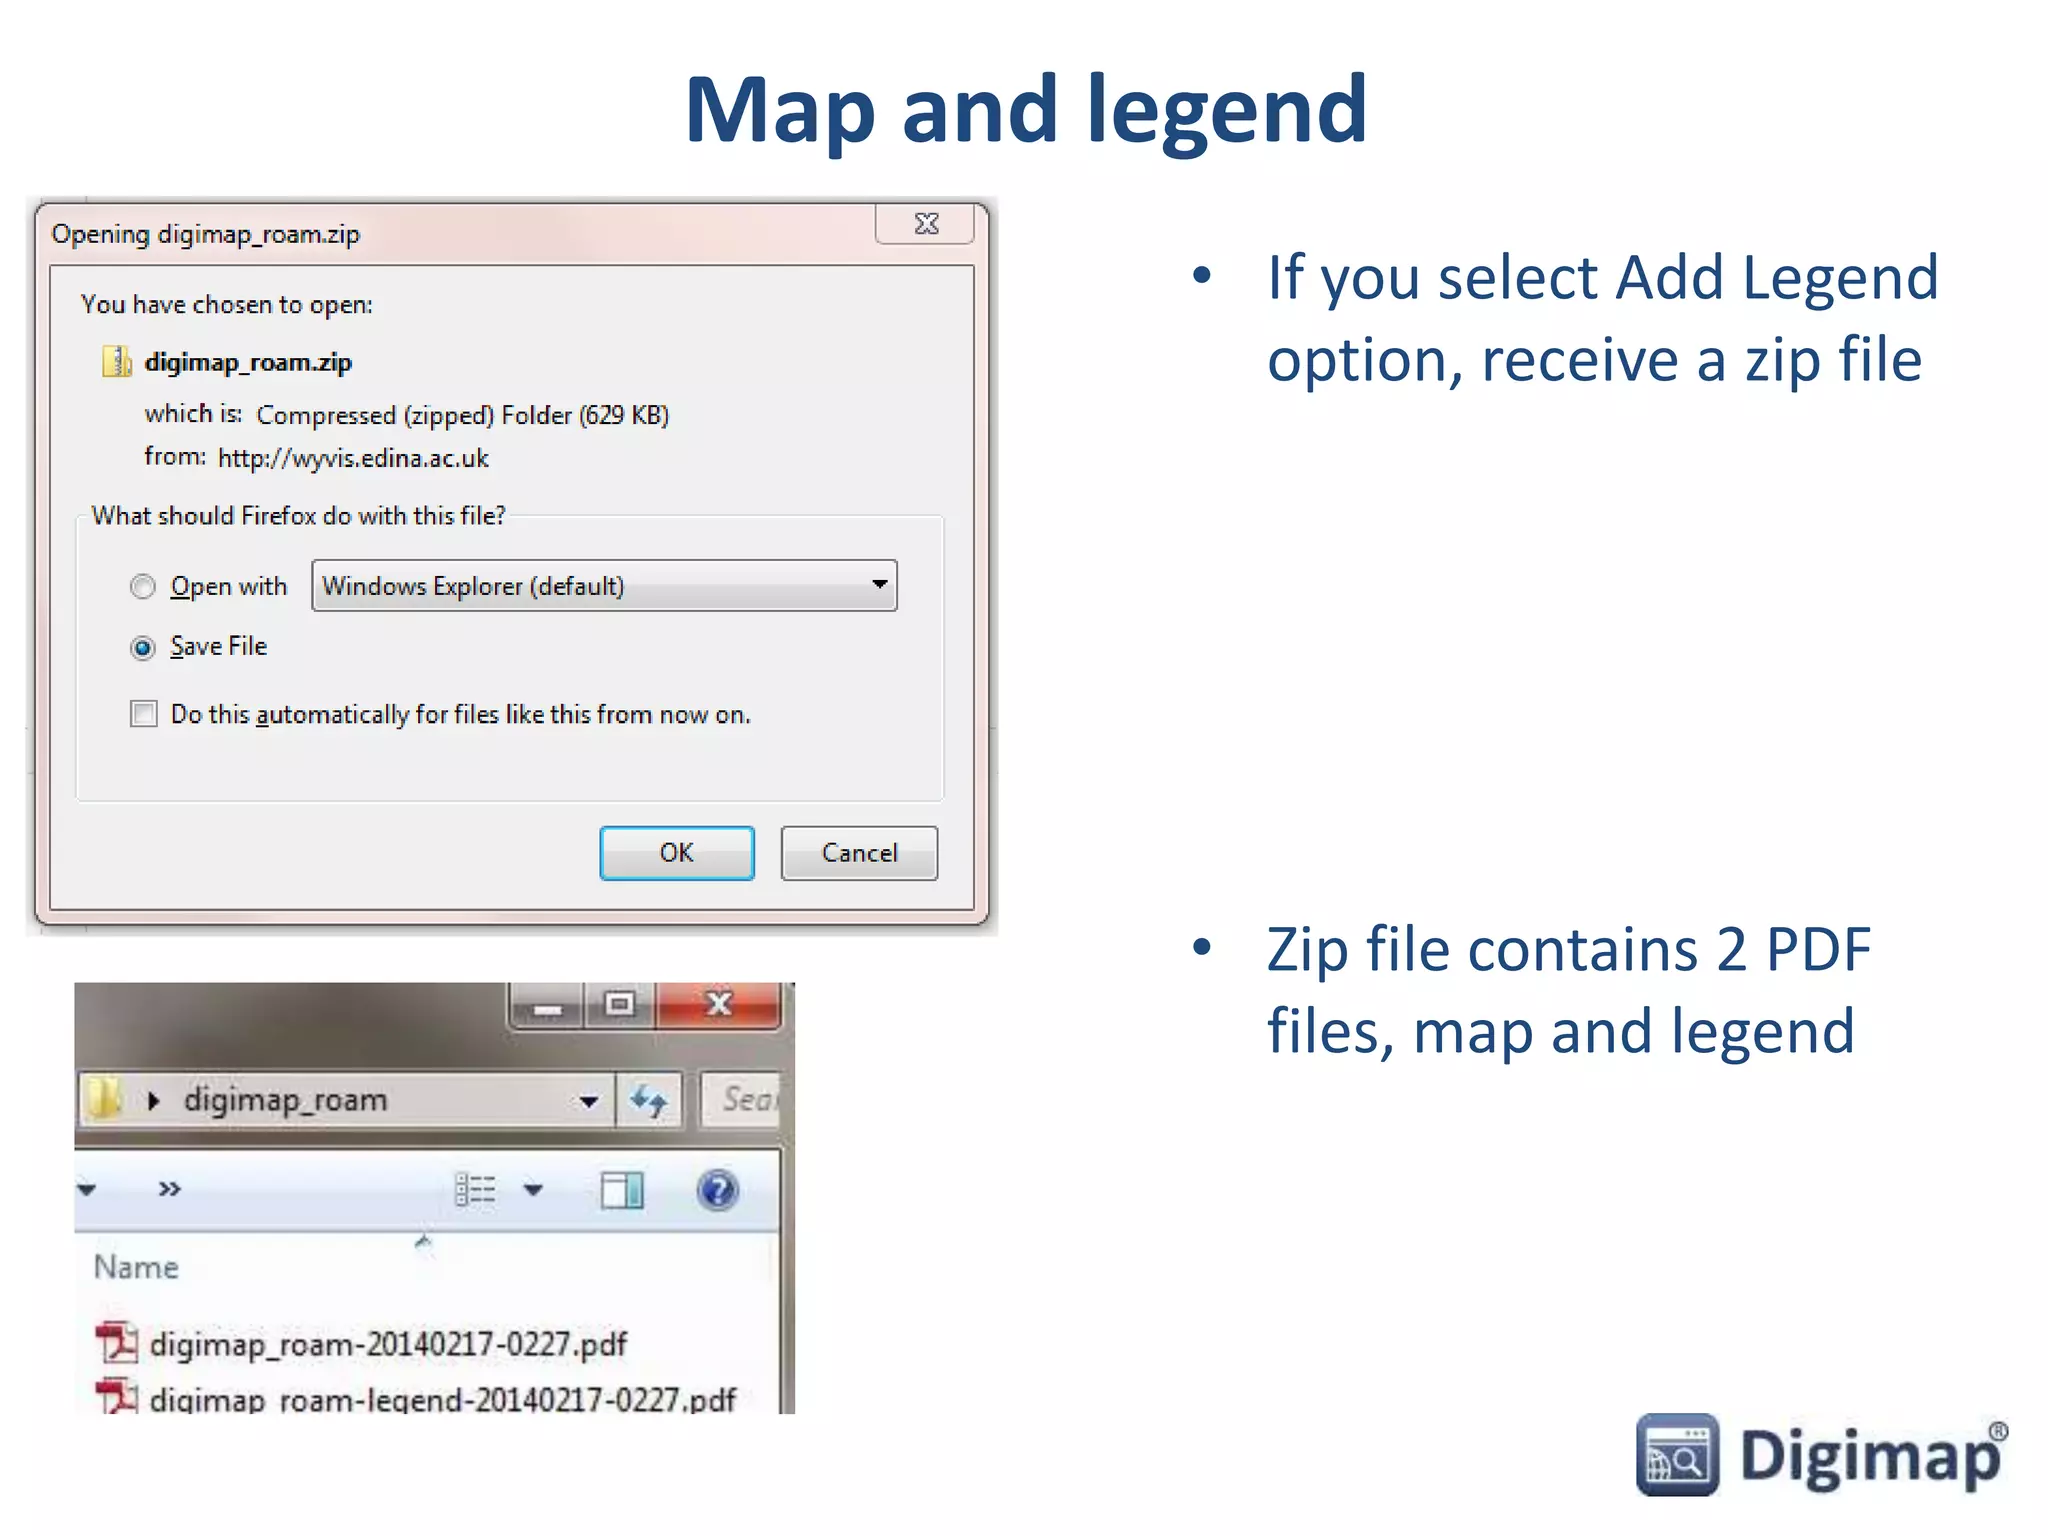


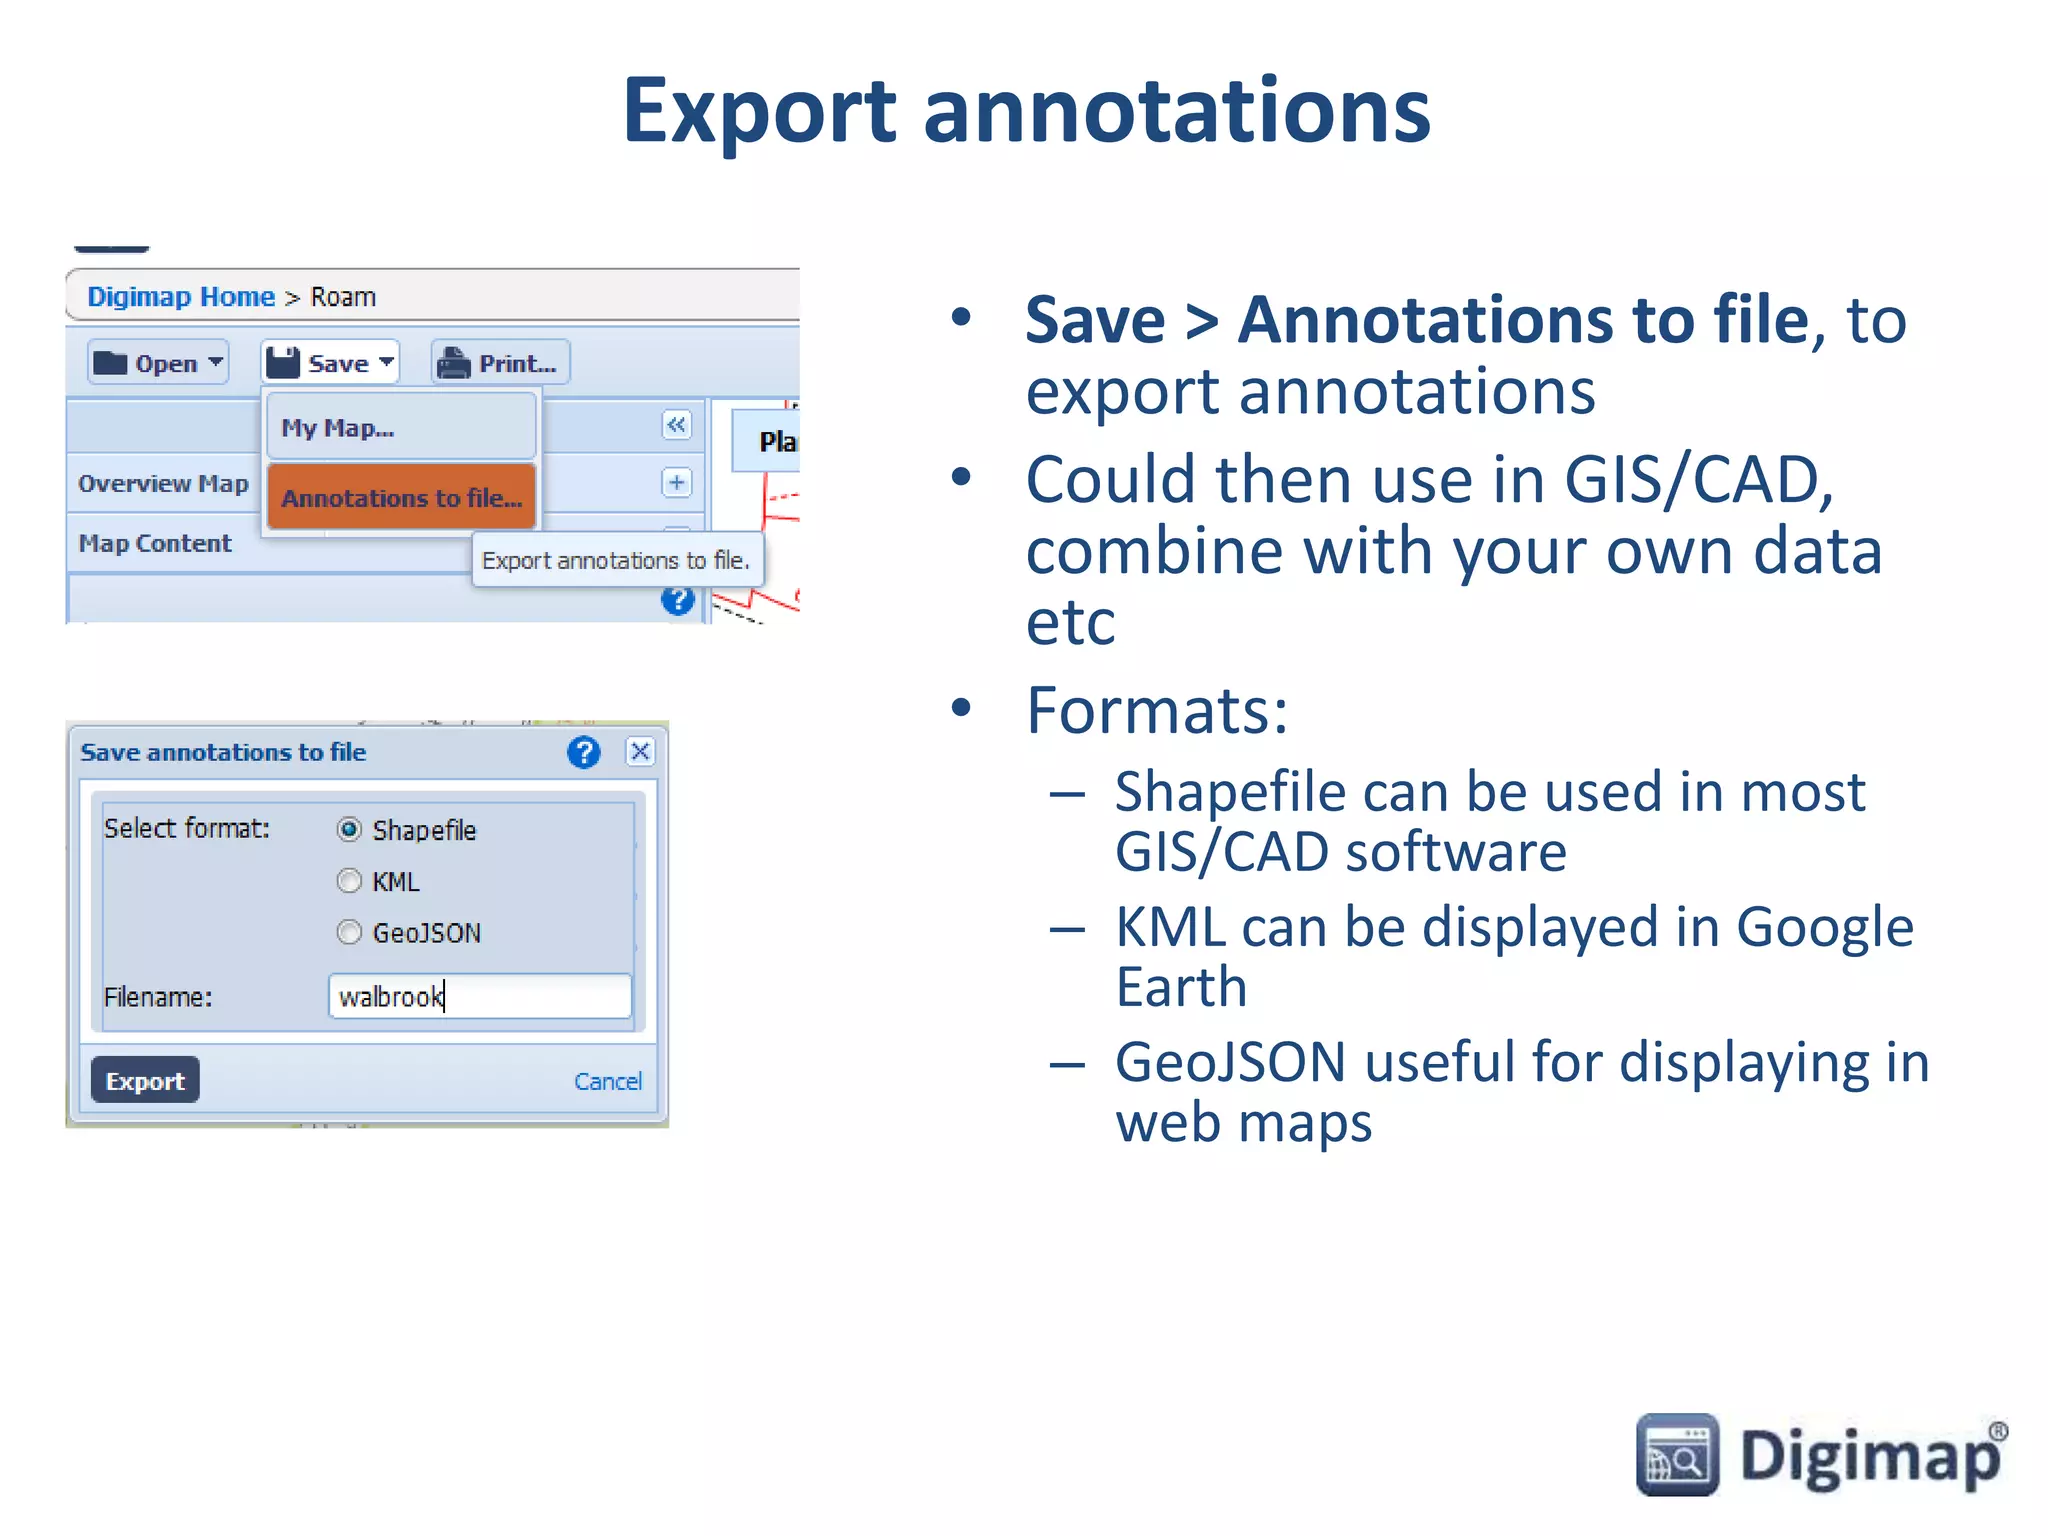

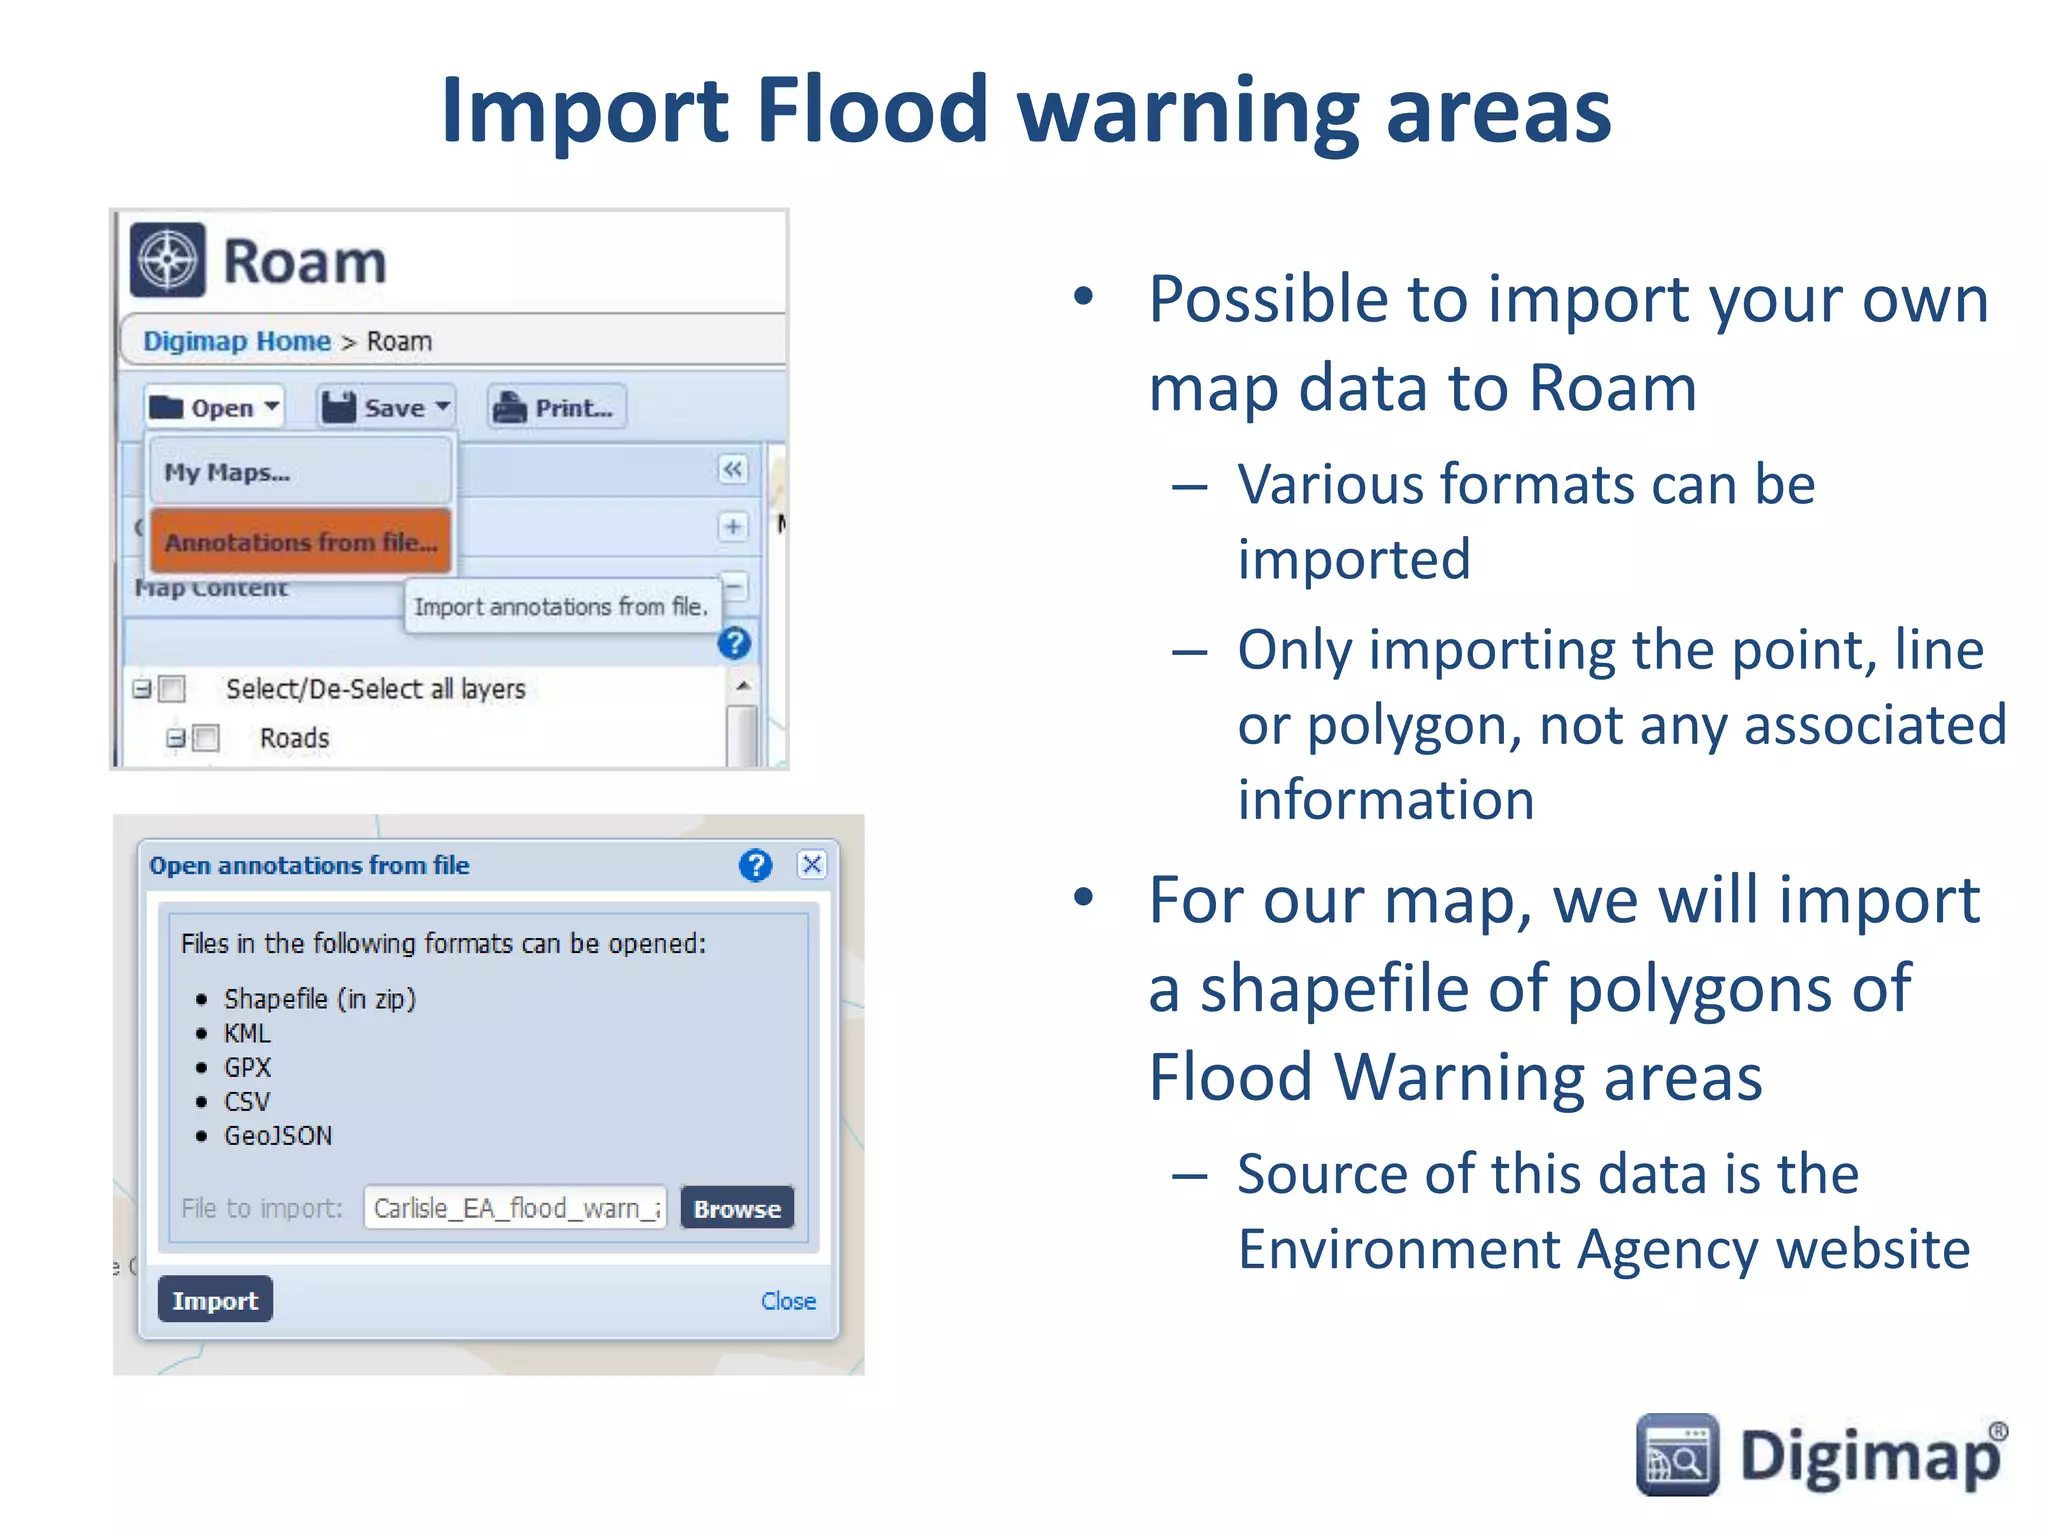

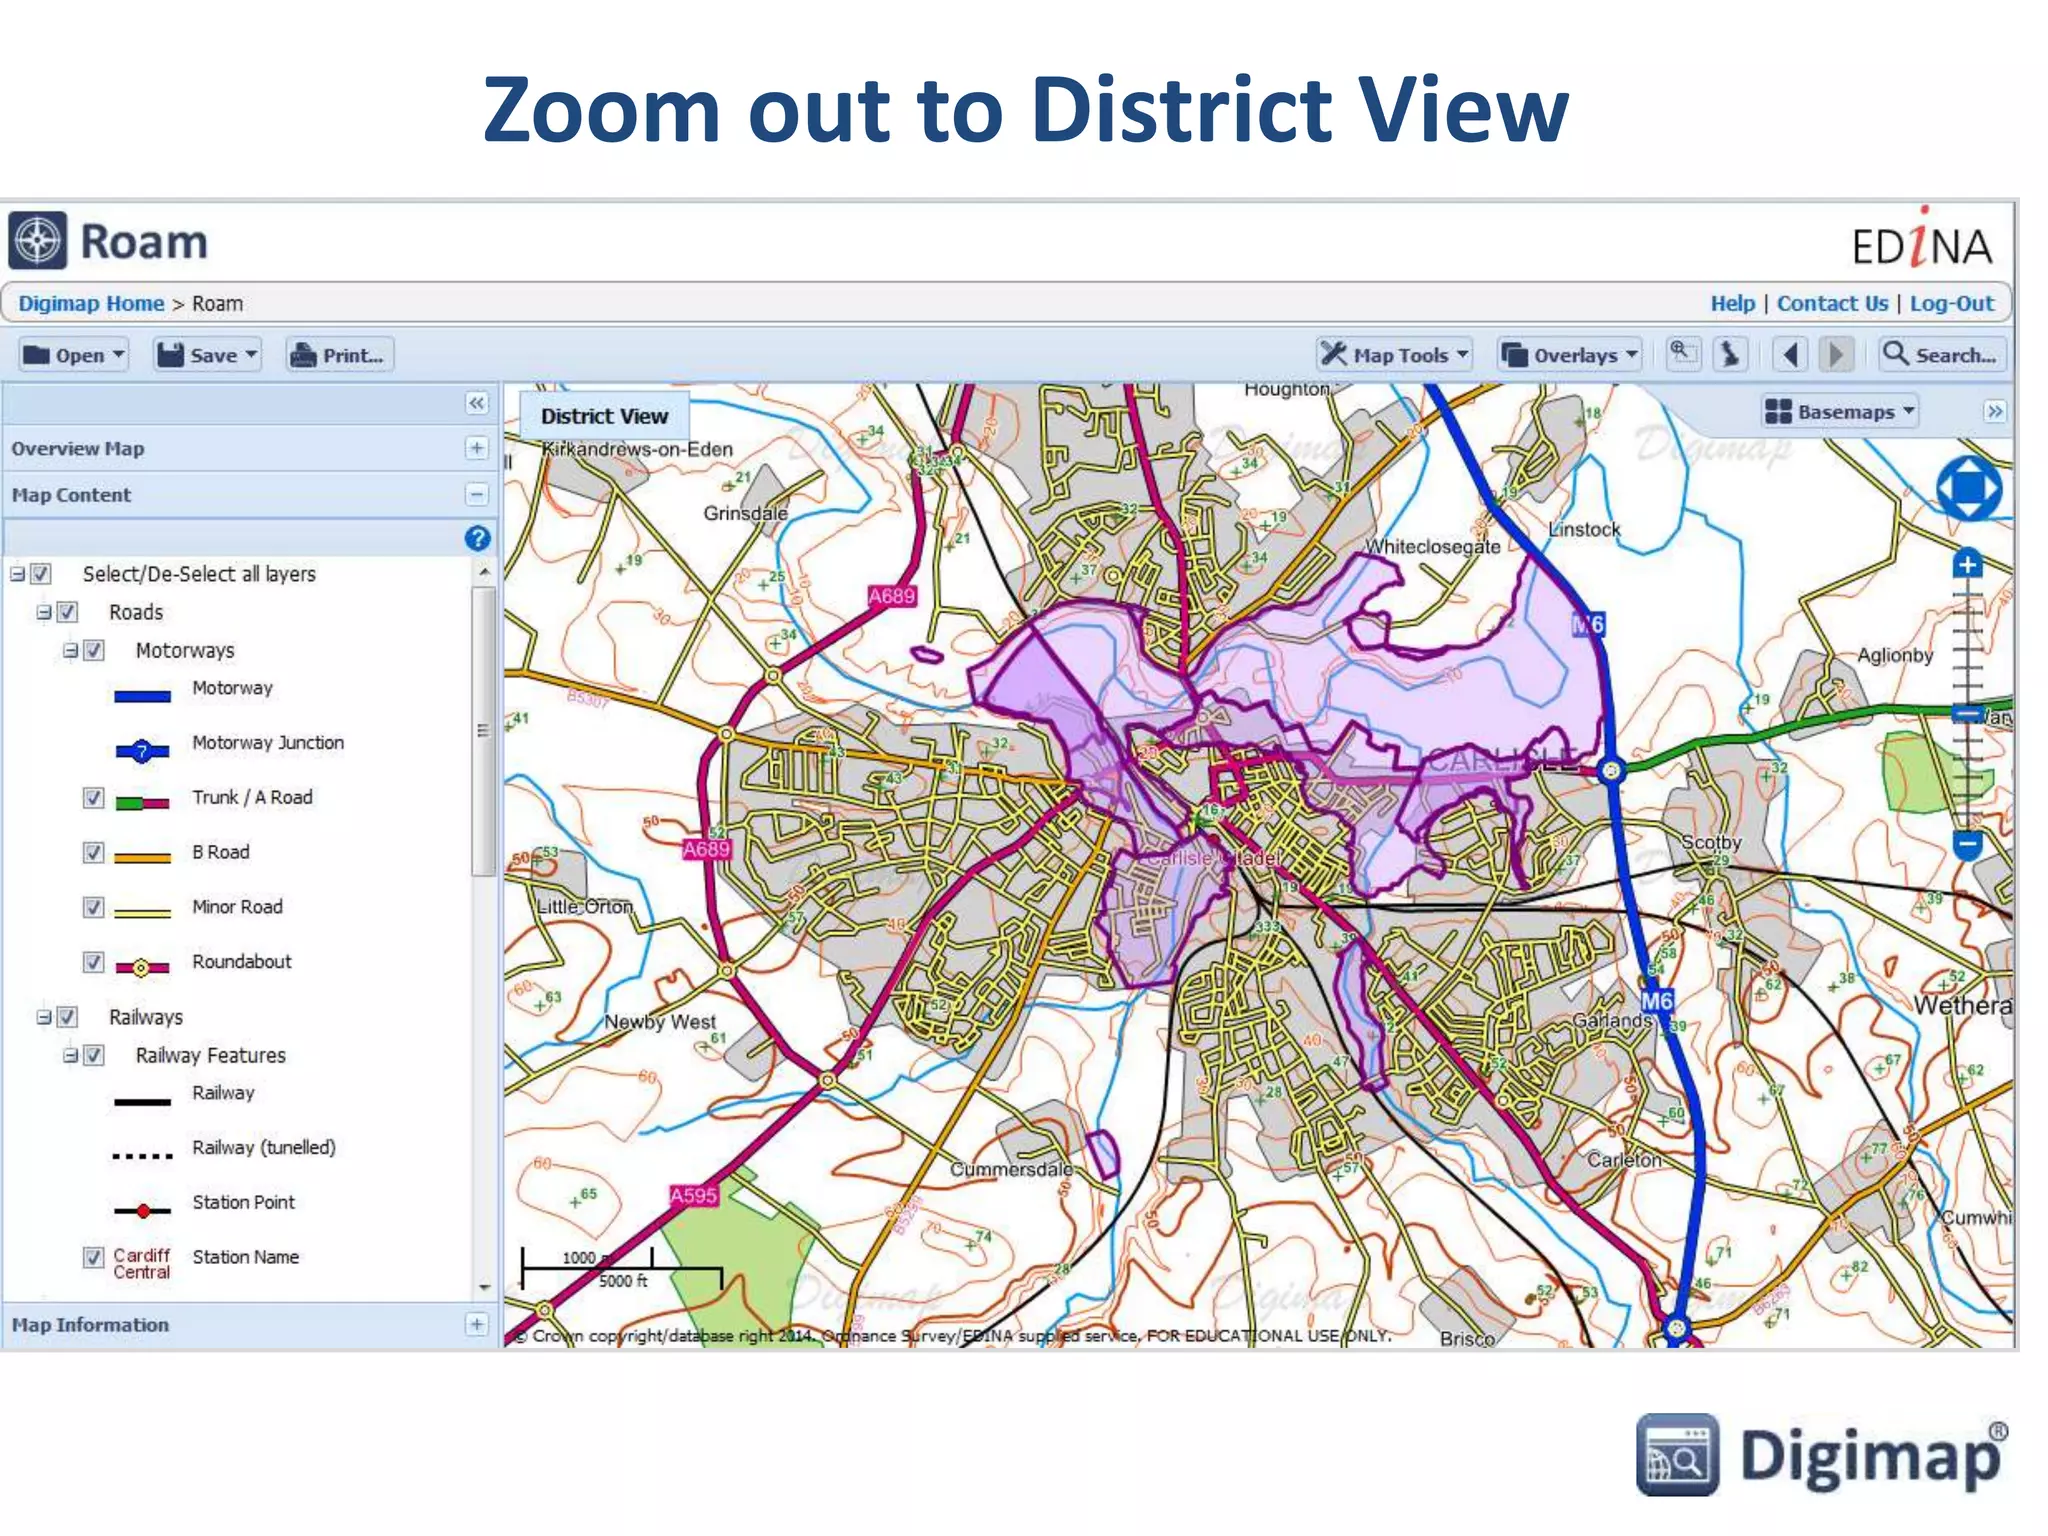
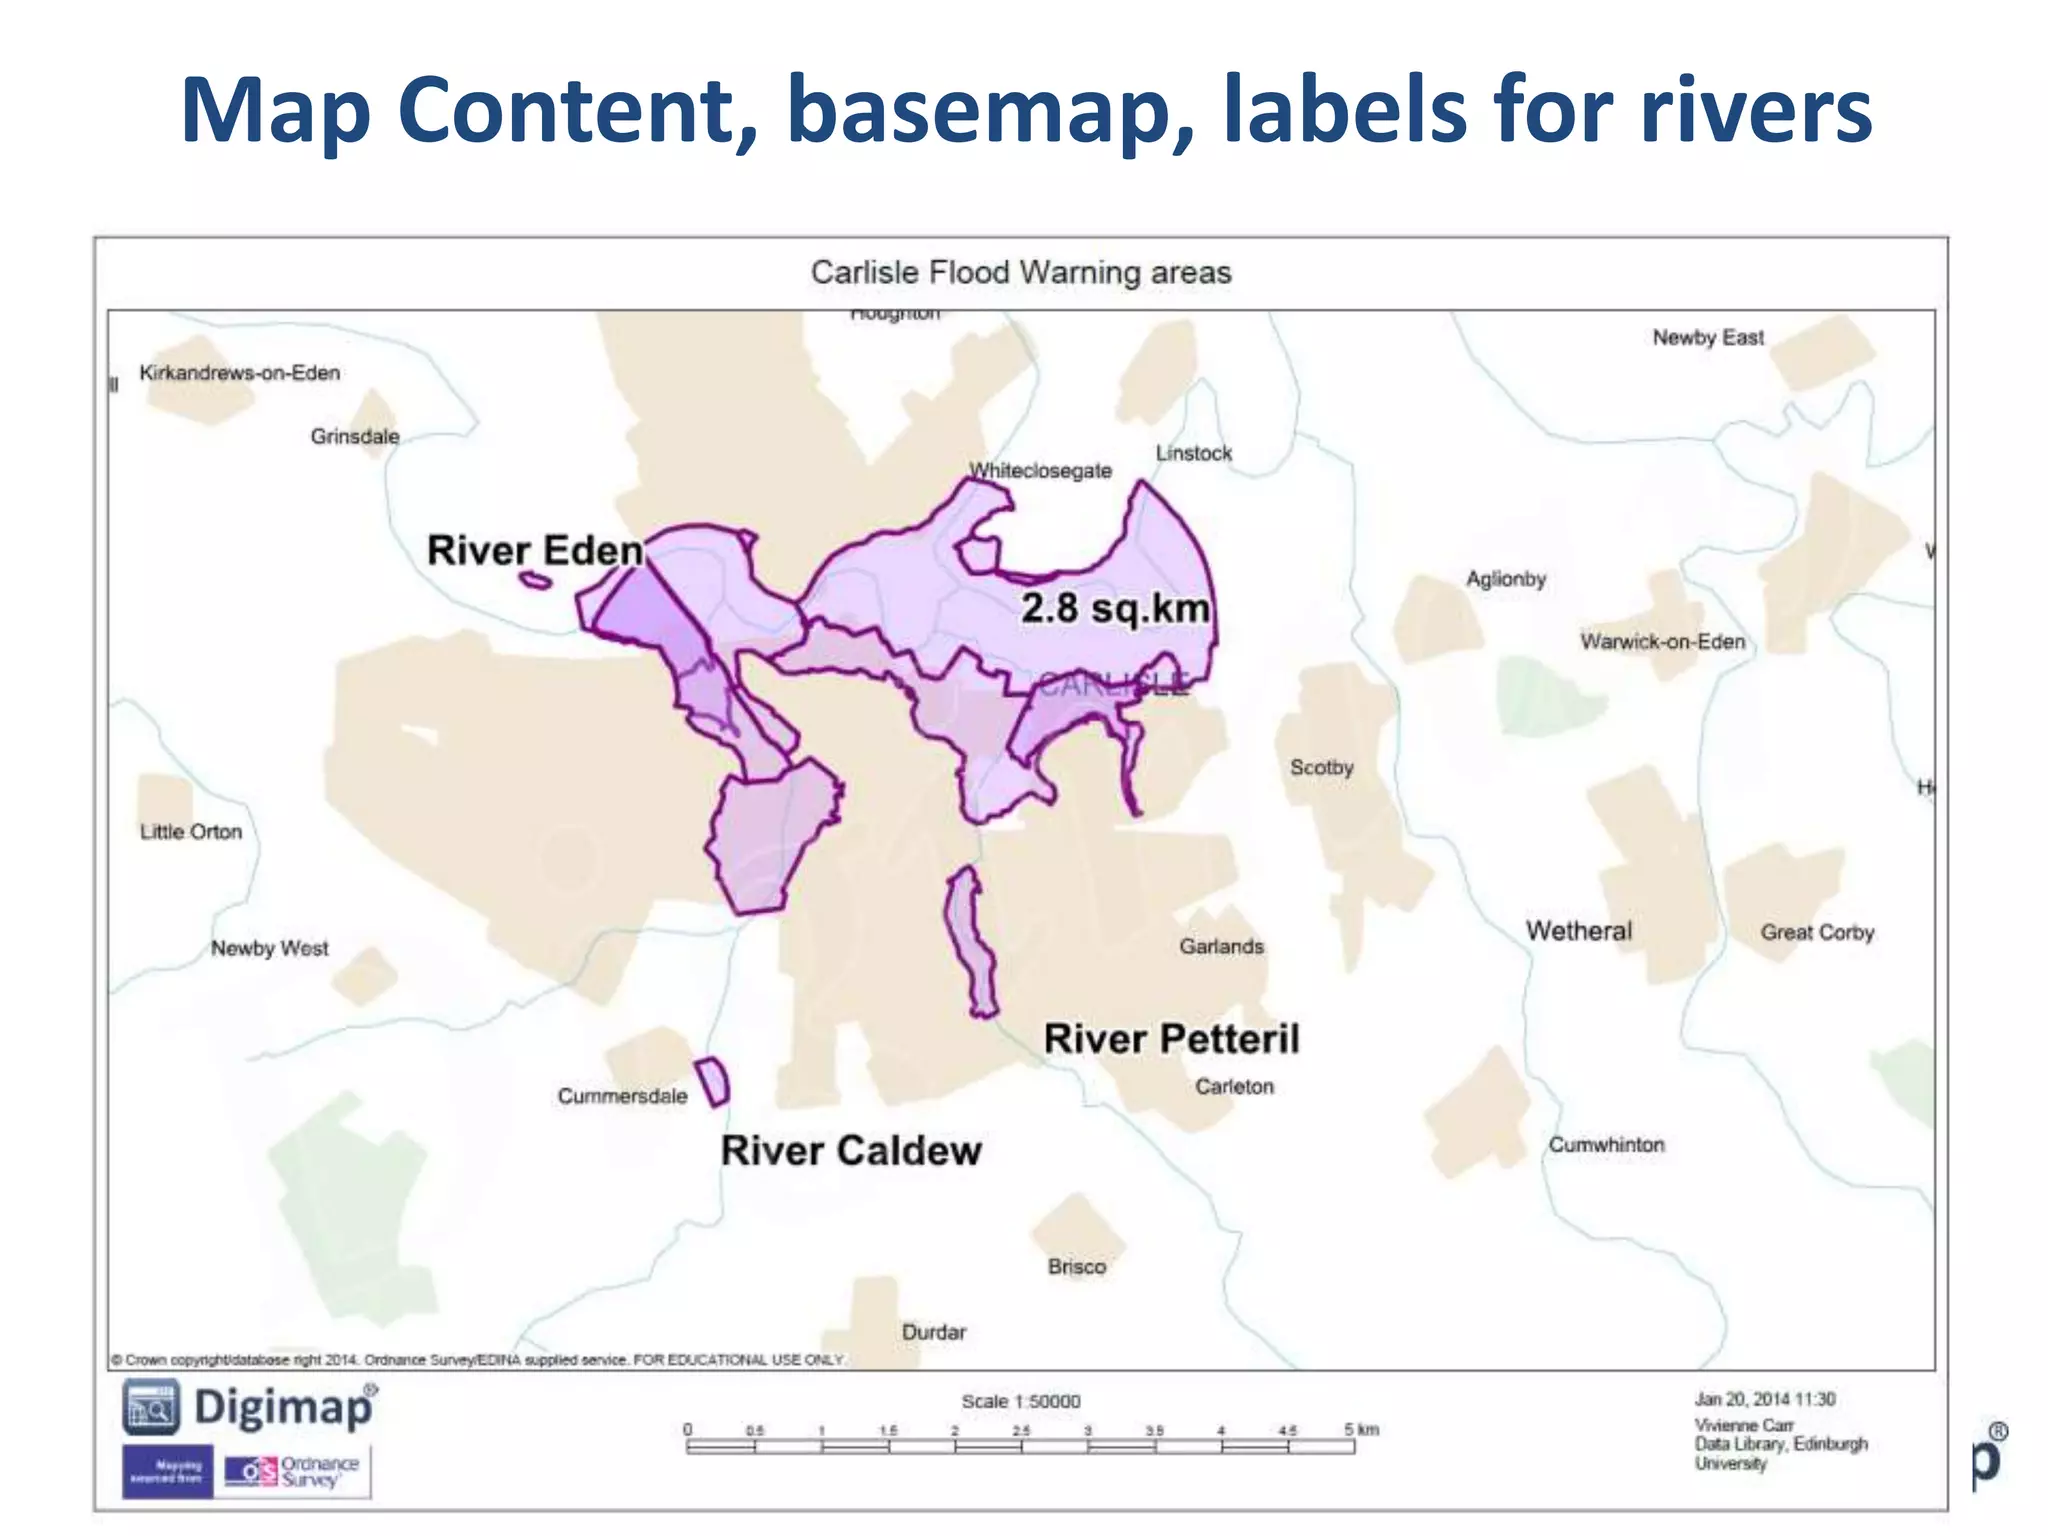


- Digimap Roam allows users to view and interact with Ordnance Survey maps, including adding annotations, selecting map features, importing external data, and printing maps. - The webinar demonstrated Roam's tools using examples of mapping a mountain area, archaeological site, and flood warning areas, showing how to search, measure, change basemaps, add shapes and labels, save maps, and import external data. - Questions from users are welcomed and additional training and resources are available to help users make the most of Roam's mapping capabilities.


![Rs unit iii-gis--- [repaired]](https://cdn.slidesharecdn.com/ss_thumbnails/rsunit-iiigis-repaired-180305142425-thumbnail.jpg?width=640&height=640&fit=bounds)