Download to read offline
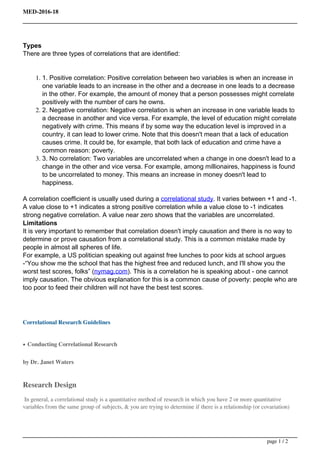
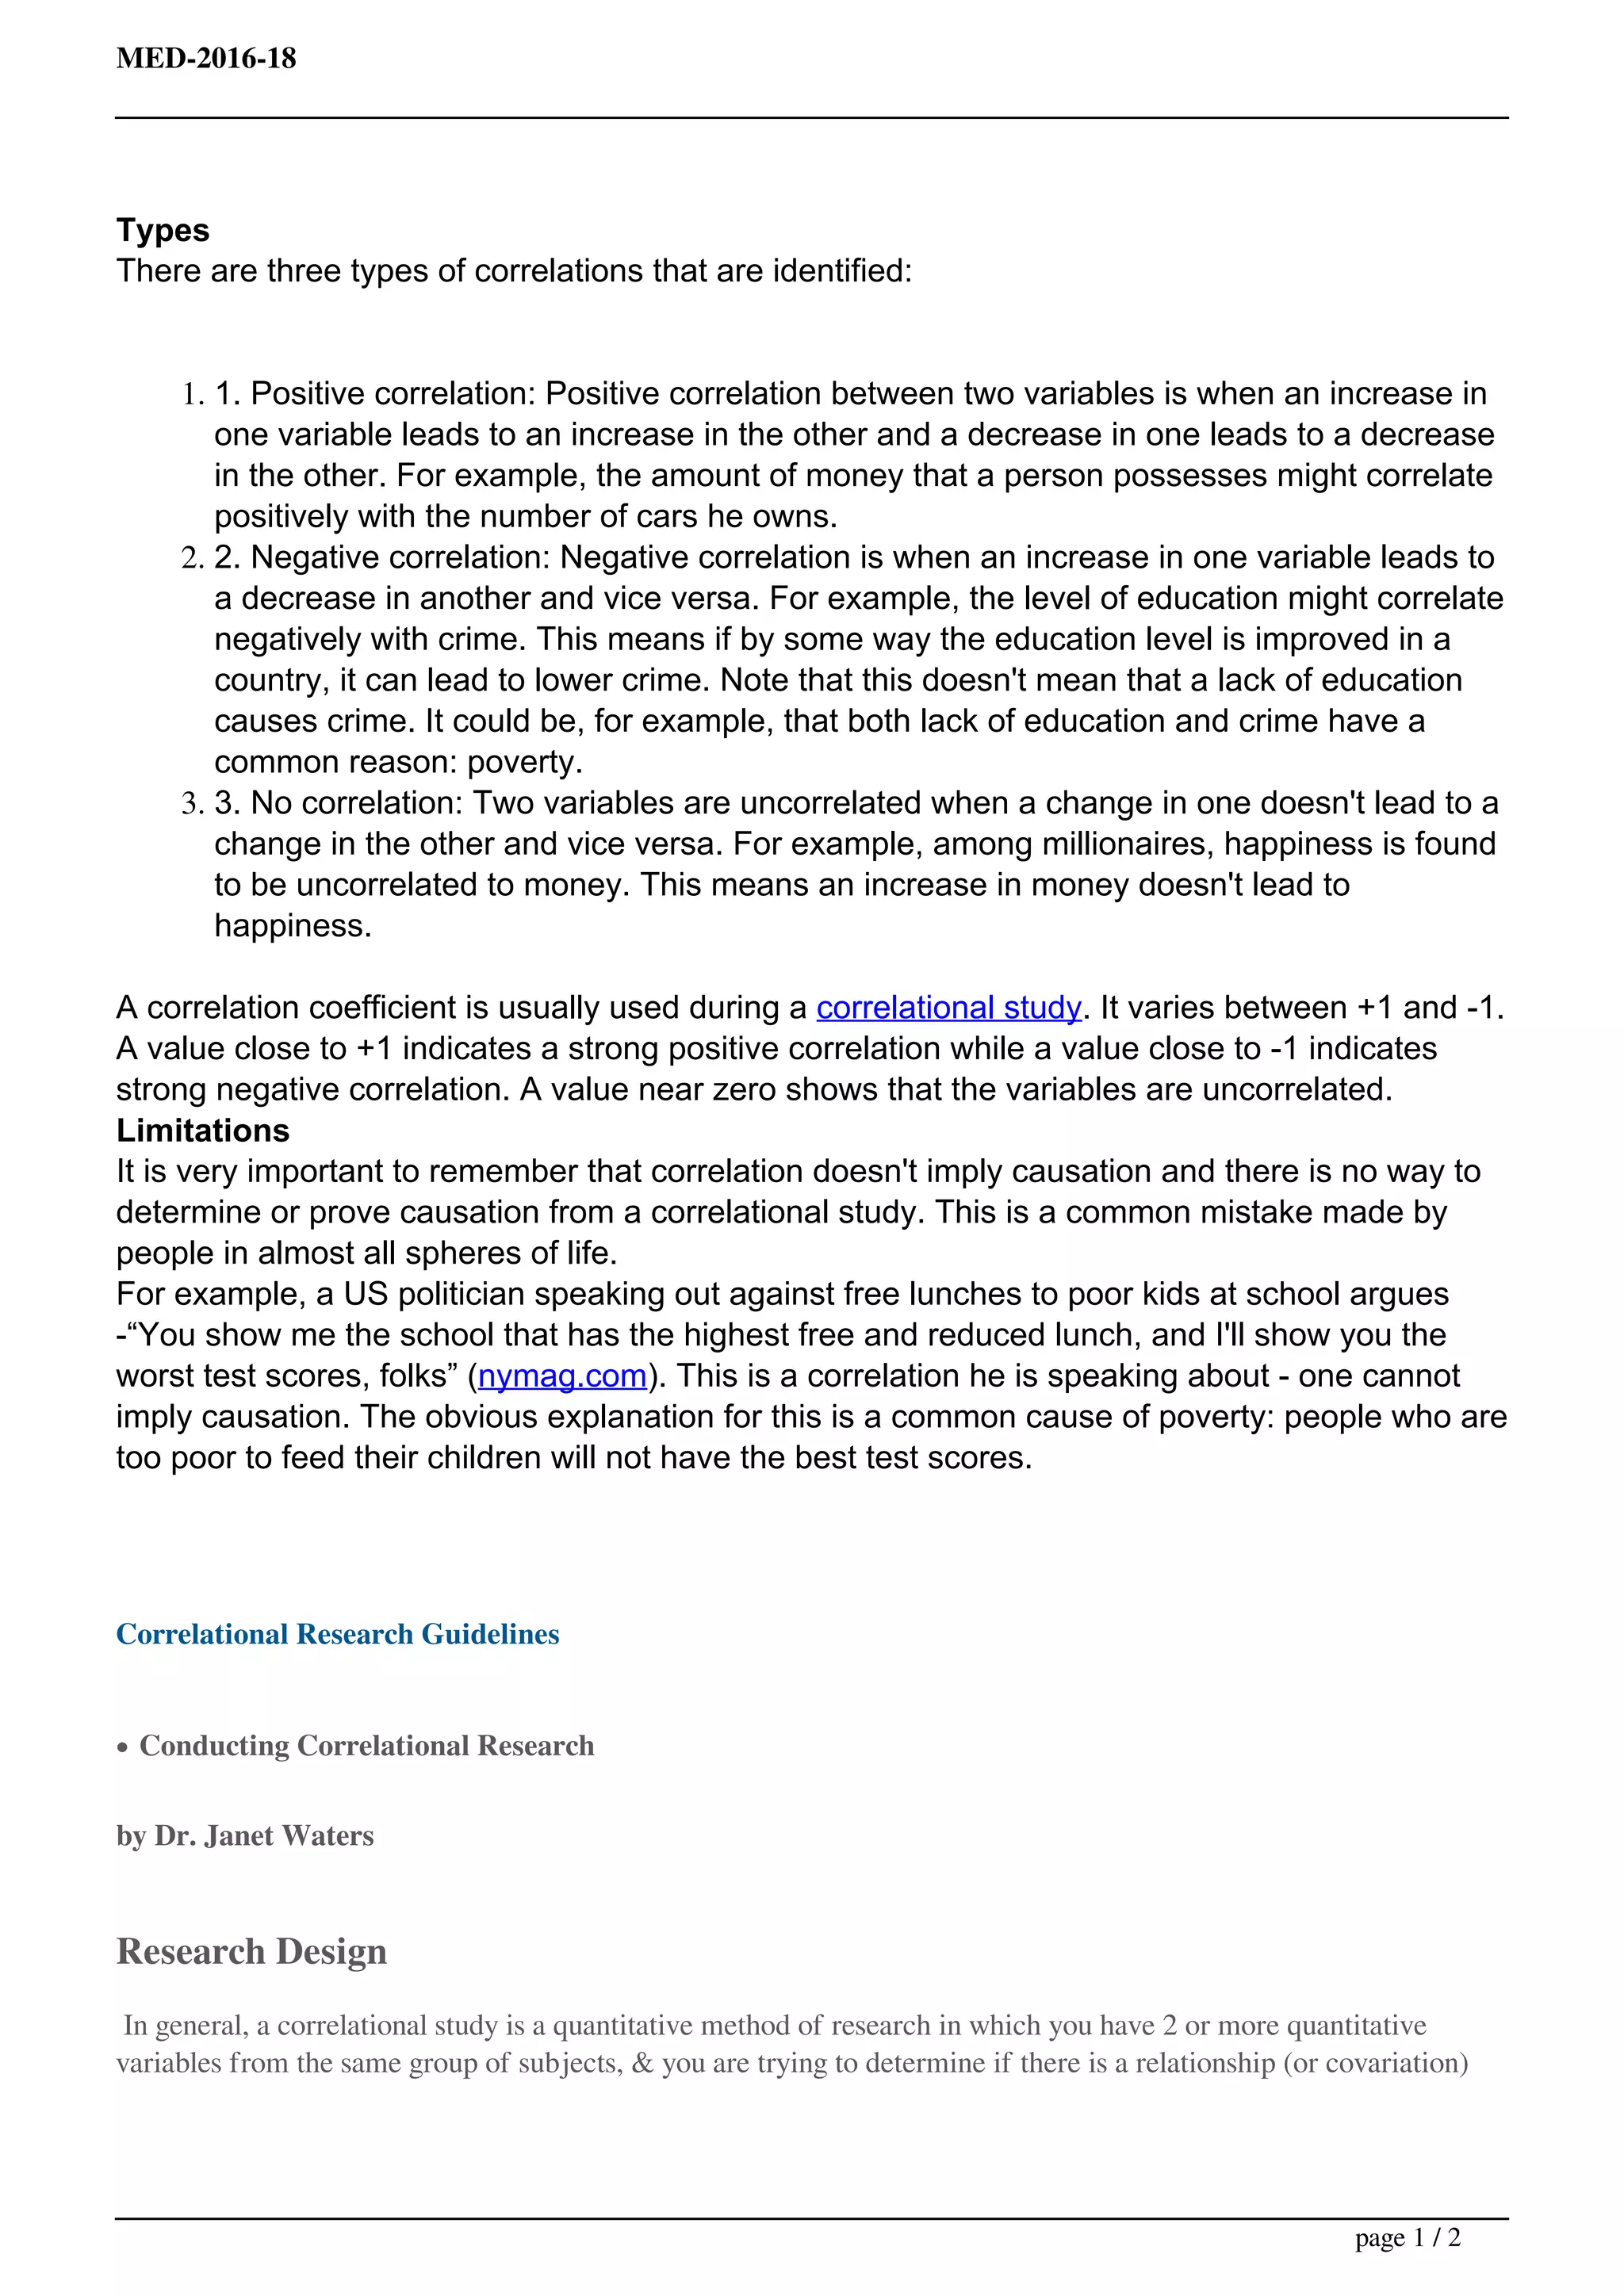

There are three types of correlations: positive, negative, and no correlation. A positive correlation means that as one variable increases, the other also increases. A negative correlation means that as one variable increases, the other decreases. No correlation means the variables are unrelated and do not influence each other. While correlation does not prove causation, it can suggest relationships between variables and be used for prediction. Limitations of correlational research include the inability to determine cause and effect from the data.