This chapter introduces key concepts in statistics including:
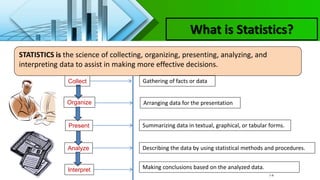
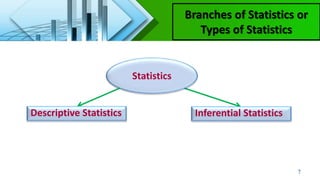
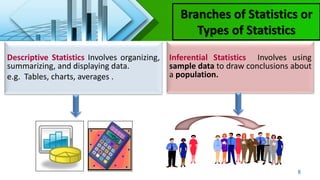
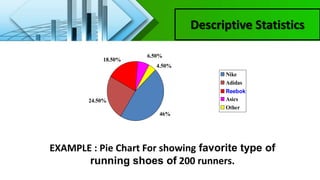
- Descriptive statistics which organizes and summarizes data, and inferential statistics which draws conclusions about populations from samples
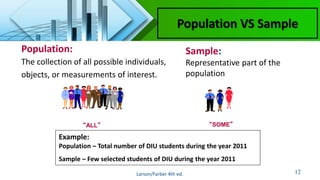
- The difference between a population, which is all possible values, and a sample, which is a subset of values
- Types of statistics including parameters which describe populations and statistics which describe samples
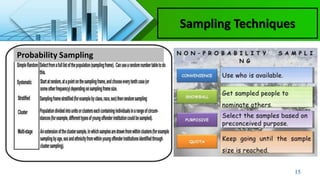
- Common sampling techniques like probability sampling that are used to select representative samples