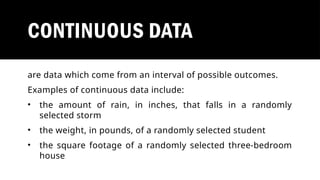
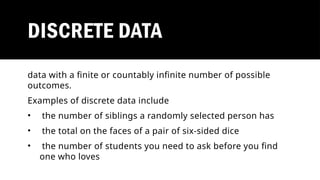
BASIC STATISTICS ON
RESEARCH DESIGN
GRACE P. PRINCIPE
TYPES OF DATA IN STATISTICS
1. Continuous Data
2. Discrete Data
3. Nominal Data
4. Interval Data
5. Categorical Data
CONTINUOUS DATA
are data which come from an interval of possible outcomes.
Examples of continuous data include:
• the amount of rain, in inches, that falls in a randomly
selected storm
• the weight, in pounds, of a randomly selected student
• the square footage of a randomly selected three-bedroom
house
DISCRETE DATA
data with a finite or countably infinite number of possible
outcomes.
Examples of discrete data include
• the number of siblings a randomly selected person has
• the total on the faces of a pair of six-sided dice
• the number of students you need to ask before you find
one who loves
NOMINAL DATA
values are grouped into categories that have no meaningful
order. For example, gender and political affiliation are
nominal level variables. Members in the group are assigned a
label in that group and there is no hierarchy. Typical
descriptive statistics associated with nominal data are
frequencies and percentages.
INTERVAL DATA
is a type of data which is measured along a scale, in which
each point is placed at an equal distance (interval) from one
another. Interval data is one of the two types of discrete data.
An example of interval data is the data collected on a
thermometer—its gradation or markings are equidistant.
CATEGORICAL DATA
Categorical variables represent types of data which may be
divided into groups. Examples of categorical variables are
race, sex, age group, and educational level. While the latter
two variables may also be considered in a numerical manner
by using exact values for age and highest grade completed, it
is often more informative to categorize such variables into a
relatively small number of groups.
STATISTICS
the science concerned with developing and studying methods
for collecting, analyzing, interpreting and presenting empirical
data. Statistics is a highly interdisciplinary field; research in
statistics finds applicability in virtually all scientific fields and
research questions in the various scientific fields motivate the
development of new statistical methods and theory.
STATISTICS AND ITS TYPES
Statistics is a collection of planning
experiments methods, obtaining data,
analyzing, interpreting, and drawing
conclusions based on the data (Alferes &
Duro 2010). It is divided into two main areas:
Descriptive and Inferential.
DESCRIPTIVE STATISTICS
• summarizes or describes the essential characteristics of a
known set of data.
• are brief descriptive coefficients that summarize a given
data set, which can be either a representation of the entire
or a sample of a population.
• For example, the Department of Health conducts a tally to
determine the number of CoViD-19 cases per day in the
Philippines.
INFERENTIAL STATISTICS
• uses sample data to make inferences about a population. It
consists of generalizing from samples to populations,
performing hypothesis testing, determining relationships
among variables, and making predictions.
• For example, assuming you want to find out if the Filipinos
want to take a shot on the CoViD-19 vaccine. In such a case, a
smaller sample of the population is considered. The results
are drawn, and the analysis is extended to the larger data set.
TOOLS IN DESCRIPTIVE
STATISTICS
Frequency Distribution is a collection of
observations produced by sorting them into
classes and showing their frequency or
numbers of occurrences in each class. For
example, twenty-five students were given a
blood test to determine their blood types.
From the given data, here
is how to organize them
using frequency
distribution.
Data sets of Blood types
of Twenty-five students.
MEASURES OF CENTRAL TENDENCY OR
POSITION OR AVERAGE
When scores and other measures have been tabulated into a
frequency distribution, the next task is to calculate a measure
of central tendency or central position.
This measure of central tendency is synonymous with the
word “average”. An average is a typical value that tends to
describe the set of data.
MEAN
Mean, or simply the average is the most frequently used
and can be described as the arithmetic average of all
scores or groups of scores in a distribution. The process
can be done by adding all the scores or data then divided
by the total number of cases.
MEDIAN
Median, or the middle-most value in a list of items arranged in
increasing or decreasing order. If the case is in an odd number
or items, there will be exactly one item in the middle. In case
the number or items is an even number, the midpoint will be
determined by getting the average of the two-middle item.
MODE
mode is the score or group of scores that
occur most frequently. Some distributions
don’t have mode at all. Others may have
more than one mode. In cases that the
distribution has two modes, the term used is
bimodal.
Laboratory tests reveal
the incubation period
(measures in days) of
virus among the 30
infected residents of Brgy.
Malinis
In dealing with this,
arrange the given data
from highest to lowest or
vice versa
MEASURES OF VARIATION/
DISPERSION
The previous section focused on average
or measures of central tendency. The
averages are supposed to be the central
scores of a given set of data, However,
not all features of a given data set may
be reflected by the averages. Suppose,
two different groups of 5 Students are
given 20-item identical quizzes in Science.
The following data below were the
results.
MEASURES OF VARIATION/
DISPERSION
The average of each
group are as follows.
As shown in the second table, the two
sets of averages have no difference. But
both groups show an obvious difference.
Group 2 has more widely scattered data
compared to Group 1. This characteristic
called variability or dispersion is not
reflected by averages. The three basic
measures of dispersion are range,
variance, and standard deviation.
RANGE
is the simplest measure of dispersion to calculate.
It is done by getting the difference between the
highest/largest value and lowest/smallest value in
each set of data. A larger range suggests greater
variations or dispersion. On the other hand, a
smaller range suggests lesser variations or
dispersion
VARIANCE
measures how far a data set is spread out. It is
mathematically defined as the average of the
squared differences from the mean.
STANDARD DEVIATION
is the most commonly used measure of dispersion. It
indicates how closely the values of the given data set are
clustered around the mean. It is computed by getting the
positive square root of variance. The lower value of standard
deviation means that the values of the given set of data are
spread over a smaller range around the mean. On the other
hand, greater value means that the values of the given set of
data are spread over a larger range around the mean.
USED IN HYPOTHESIS TESTING
 To determine whether a predictor variable has a statistically
significant relationship with an outcome variable and
estimate the difference between two or more groups.
 To determine what type of statistical tool is appropriate.
 To choose the test that fits the types of predictor or
independent variables and outcome/dependent variables
you have collected.
TOOLS IN INFERENTIAL
STATISTICS
Statistical tests are used to derive a generalization about the
population from the sample. A statistical test is a formal technique
that relies on the probability distribution for concluding the
reasonableness of the hypothesis. These hypothetical testing related
to differences are classified as parametric and non-parametric tests.
The parametric test is one that has information about the population
parameter. On the other hand, the non-parametric test is where the
researcher has no idea regarding the population parameter.
PARAMETRIC TESTS
usually have stricter requirements than non-parametric tests
and can make more robust inferences from the data. They can
only be conducted with data that adheres to the standard
assumptions of statistical tests.
The most common types of the parametric test include
regression tests, comparison tests, and correlation tests.
PARAMETRIC
TESTS
Flowchart that will help us
determine the appropriate
statistical tool for
parametric tests
EXAMPLE
The Effect of the Amount of Chlorine in the Color of Algae. Identify first
your independent and dependent variables, how many are they, and
their type, whether qualitative/ categorical or quantitative/numeric. After
identifying such, look at the diagram above to know the parametric test's
right statistical tool. In the given problem, the amount of chlorine is the
independent variable, it’s numeric or qualitative, and 2 or more amounts
of chlorine may be used in the experiment. The dependent variable is the
color of algae; its categorical and color may vary. So, looking at the
above diagram, logistic regression is the appropriate tool.
NON-PARAMETRIC TEST
They don’t make as many assumptions about
the data and are useful when one or more
common statistical assumptions are violated.
However, the inferences they make aren’t as
strong as with parametric tests.
NON-PARAMETRIC
TEST
The table shows how to
determine the
appropriate non-
parametric tool to be
used.
Statistical tools are complex,
especially among beginners.
However, according to Grobman,
2017, the most commonly used
in science investigatory projects
are chi-square, t-tests, and
correlations. In determining
whether there is no statistically
significant relationship between
the independent and dependent
variables, we always consider the
standard rule of thumb. If the p-
value is lower than 0.05, we
reject the null hypothesis and
accept the alternative
hypothesis.
Licensed Statisticians
play a vital role in
computing and
interpreting the results
of the data gathered. In
any investigation, it is
important to consult
them to ensure that
your results are
statistically correct. SPSS
and Strata are some of
the most common
software they are using.
THANK YOU

Basic-Statistics in Research Design Presentation

  • 1.
    BASIC STATISTICS ON RESEARCHDESIGN GRACE P. PRINCIPE
  • 2.
    TYPES OF DATAIN STATISTICS 1. Continuous Data 2. Discrete Data 3. Nominal Data 4. Interval Data 5. Categorical Data
  • 3.
    CONTINUOUS DATA are datawhich come from an interval of possible outcomes. Examples of continuous data include: • the amount of rain, in inches, that falls in a randomly selected storm • the weight, in pounds, of a randomly selected student • the square footage of a randomly selected three-bedroom house
  • 4.
    DISCRETE DATA data witha finite or countably infinite number of possible outcomes. Examples of discrete data include • the number of siblings a randomly selected person has • the total on the faces of a pair of six-sided dice • the number of students you need to ask before you find one who loves
  • 5.
    NOMINAL DATA values aregrouped into categories that have no meaningful order. For example, gender and political affiliation are nominal level variables. Members in the group are assigned a label in that group and there is no hierarchy. Typical descriptive statistics associated with nominal data are frequencies and percentages.
  • 6.
    INTERVAL DATA is atype of data which is measured along a scale, in which each point is placed at an equal distance (interval) from one another. Interval data is one of the two types of discrete data. An example of interval data is the data collected on a thermometer—its gradation or markings are equidistant.
  • 7.
    CATEGORICAL DATA Categorical variablesrepresent types of data which may be divided into groups. Examples of categorical variables are race, sex, age group, and educational level. While the latter two variables may also be considered in a numerical manner by using exact values for age and highest grade completed, it is often more informative to categorize such variables into a relatively small number of groups.
  • 8.
    STATISTICS the science concernedwith developing and studying methods for collecting, analyzing, interpreting and presenting empirical data. Statistics is a highly interdisciplinary field; research in statistics finds applicability in virtually all scientific fields and research questions in the various scientific fields motivate the development of new statistical methods and theory.
  • 9.
    STATISTICS AND ITSTYPES Statistics is a collection of planning experiments methods, obtaining data, analyzing, interpreting, and drawing conclusions based on the data (Alferes & Duro 2010). It is divided into two main areas: Descriptive and Inferential.
  • 10.
    DESCRIPTIVE STATISTICS • summarizesor describes the essential characteristics of a known set of data. • are brief descriptive coefficients that summarize a given data set, which can be either a representation of the entire or a sample of a population. • For example, the Department of Health conducts a tally to determine the number of CoViD-19 cases per day in the Philippines.
  • 11.
    INFERENTIAL STATISTICS • usessample data to make inferences about a population. It consists of generalizing from samples to populations, performing hypothesis testing, determining relationships among variables, and making predictions. • For example, assuming you want to find out if the Filipinos want to take a shot on the CoViD-19 vaccine. In such a case, a smaller sample of the population is considered. The results are drawn, and the analysis is extended to the larger data set.
  • 12.
    TOOLS IN DESCRIPTIVE STATISTICS FrequencyDistribution is a collection of observations produced by sorting them into classes and showing their frequency or numbers of occurrences in each class. For example, twenty-five students were given a blood test to determine their blood types.
  • 13.
    From the givendata, here is how to organize them using frequency distribution. Data sets of Blood types of Twenty-five students.
  • 14.
    MEASURES OF CENTRALTENDENCY OR POSITION OR AVERAGE When scores and other measures have been tabulated into a frequency distribution, the next task is to calculate a measure of central tendency or central position. This measure of central tendency is synonymous with the word “average”. An average is a typical value that tends to describe the set of data.
  • 15.
    MEAN Mean, or simplythe average is the most frequently used and can be described as the arithmetic average of all scores or groups of scores in a distribution. The process can be done by adding all the scores or data then divided by the total number of cases.
  • 16.
    MEDIAN Median, or themiddle-most value in a list of items arranged in increasing or decreasing order. If the case is in an odd number or items, there will be exactly one item in the middle. In case the number or items is an even number, the midpoint will be determined by getting the average of the two-middle item.
  • 17.
    MODE mode is thescore or group of scores that occur most frequently. Some distributions don’t have mode at all. Others may have more than one mode. In cases that the distribution has two modes, the term used is bimodal.
  • 18.
    Laboratory tests reveal theincubation period (measures in days) of virus among the 30 infected residents of Brgy. Malinis In dealing with this, arrange the given data from highest to lowest or vice versa
  • 20.
    MEASURES OF VARIATION/ DISPERSION Theprevious section focused on average or measures of central tendency. The averages are supposed to be the central scores of a given set of data, However, not all features of a given data set may be reflected by the averages. Suppose, two different groups of 5 Students are given 20-item identical quizzes in Science. The following data below were the results.
  • 21.
    MEASURES OF VARIATION/ DISPERSION Theaverage of each group are as follows. As shown in the second table, the two sets of averages have no difference. But both groups show an obvious difference. Group 2 has more widely scattered data compared to Group 1. This characteristic called variability or dispersion is not reflected by averages. The three basic measures of dispersion are range, variance, and standard deviation.
  • 22.
    RANGE is the simplestmeasure of dispersion to calculate. It is done by getting the difference between the highest/largest value and lowest/smallest value in each set of data. A larger range suggests greater variations or dispersion. On the other hand, a smaller range suggests lesser variations or dispersion
  • 23.
    VARIANCE measures how fara data set is spread out. It is mathematically defined as the average of the squared differences from the mean.
  • 24.
    STANDARD DEVIATION is themost commonly used measure of dispersion. It indicates how closely the values of the given data set are clustered around the mean. It is computed by getting the positive square root of variance. The lower value of standard deviation means that the values of the given set of data are spread over a smaller range around the mean. On the other hand, greater value means that the values of the given set of data are spread over a larger range around the mean.
  • 25.
    USED IN HYPOTHESISTESTING  To determine whether a predictor variable has a statistically significant relationship with an outcome variable and estimate the difference between two or more groups.  To determine what type of statistical tool is appropriate.  To choose the test that fits the types of predictor or independent variables and outcome/dependent variables you have collected.
  • 26.
    TOOLS IN INFERENTIAL STATISTICS Statisticaltests are used to derive a generalization about the population from the sample. A statistical test is a formal technique that relies on the probability distribution for concluding the reasonableness of the hypothesis. These hypothetical testing related to differences are classified as parametric and non-parametric tests. The parametric test is one that has information about the population parameter. On the other hand, the non-parametric test is where the researcher has no idea regarding the population parameter.
  • 27.
    PARAMETRIC TESTS usually havestricter requirements than non-parametric tests and can make more robust inferences from the data. They can only be conducted with data that adheres to the standard assumptions of statistical tests. The most common types of the parametric test include regression tests, comparison tests, and correlation tests.
  • 28.
    PARAMETRIC TESTS Flowchart that willhelp us determine the appropriate statistical tool for parametric tests
  • 29.
    EXAMPLE The Effect ofthe Amount of Chlorine in the Color of Algae. Identify first your independent and dependent variables, how many are they, and their type, whether qualitative/ categorical or quantitative/numeric. After identifying such, look at the diagram above to know the parametric test's right statistical tool. In the given problem, the amount of chlorine is the independent variable, it’s numeric or qualitative, and 2 or more amounts of chlorine may be used in the experiment. The dependent variable is the color of algae; its categorical and color may vary. So, looking at the above diagram, logistic regression is the appropriate tool.
  • 30.
    NON-PARAMETRIC TEST They don’tmake as many assumptions about the data and are useful when one or more common statistical assumptions are violated. However, the inferences they make aren’t as strong as with parametric tests.
  • 31.
    NON-PARAMETRIC TEST The table showshow to determine the appropriate non- parametric tool to be used.
  • 32.
    Statistical tools arecomplex, especially among beginners. However, according to Grobman, 2017, the most commonly used in science investigatory projects are chi-square, t-tests, and correlations. In determining whether there is no statistically significant relationship between the independent and dependent variables, we always consider the standard rule of thumb. If the p- value is lower than 0.05, we reject the null hypothesis and accept the alternative hypothesis.
  • 33.
    Licensed Statisticians play avital role in computing and interpreting the results of the data gathered. In any investigation, it is important to consult them to ensure that your results are statistically correct. SPSS and Strata are some of the most common software they are using.
  • 34.