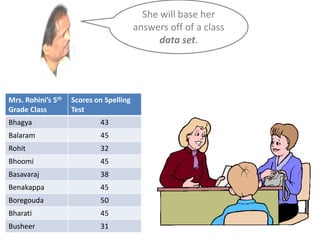
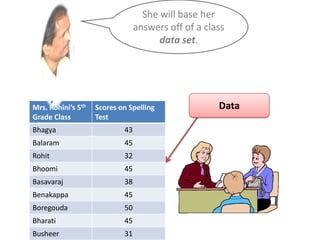
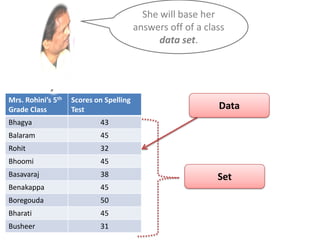
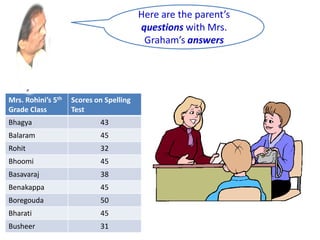
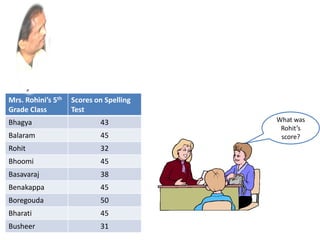
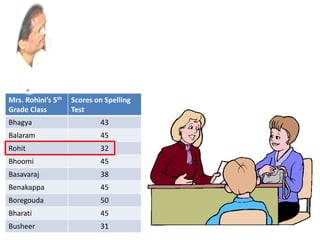
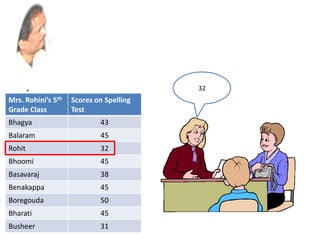
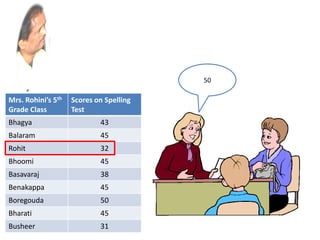
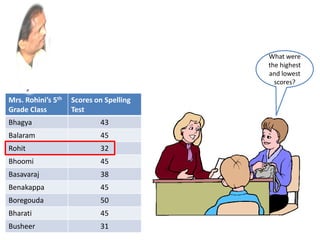
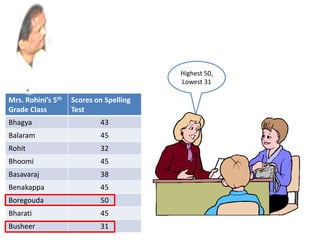
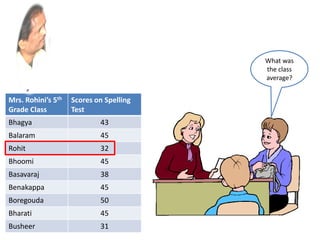
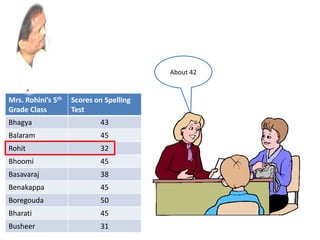
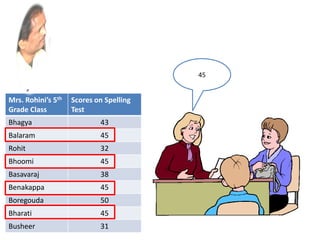
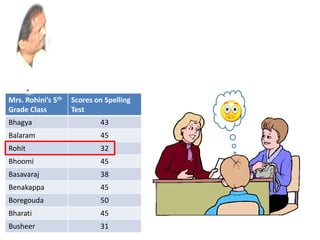
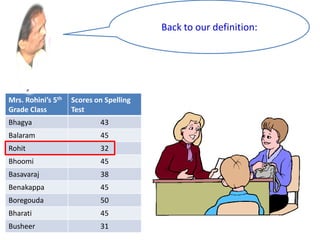
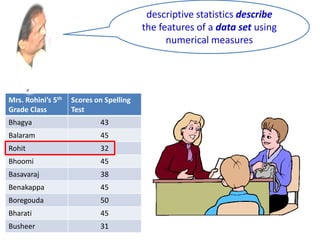
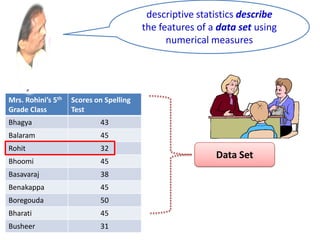
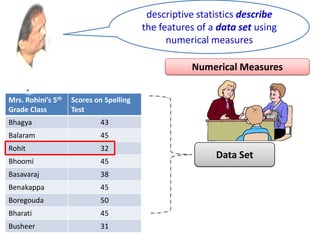
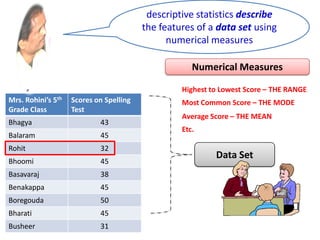
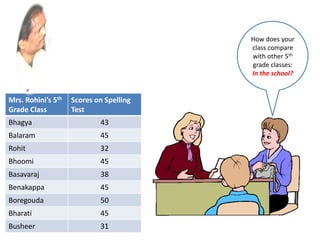
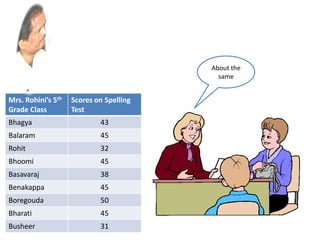
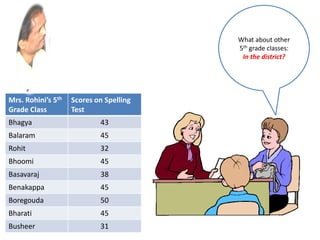
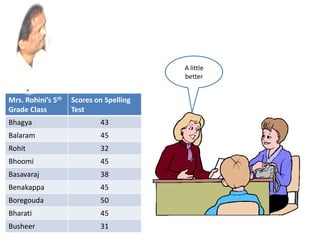
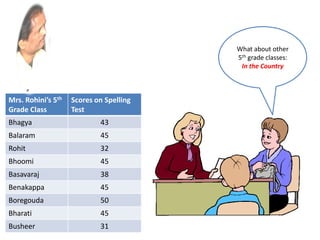
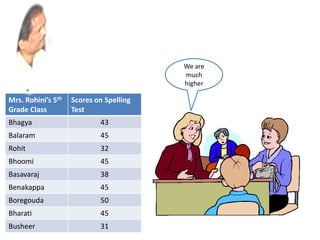
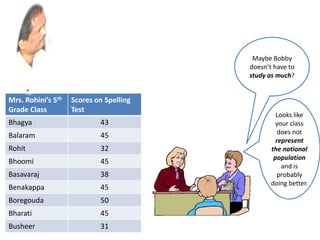
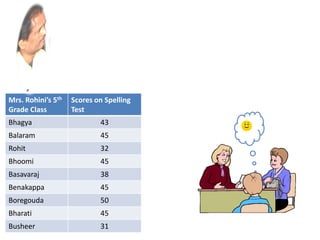
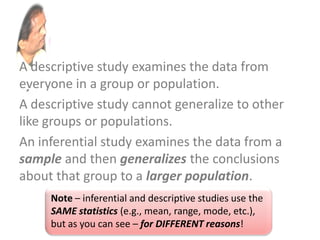
Inferential and Descriptive
Statistics
Learning Module: Explanation
Welcome to this learning
module!
In this module you will learn
the difference between
Inferential and Descriptive
statistics!
In later modules you will then
determine when a question
should be answered with one
or the other.
First, Descriptive statistics!
Simply put, descriptive statistics
describe the features of a data set
using numerical measures.
Simply put, descriptive statistics
describe the features of a data
set using numerical measures.
And that’s it!
Simply put, descriptive statistics
describe the features of a data
set using numerical measures.
And that’s it!
Here’s an example
Meet Mrs. Rohini,
a fifth Grade teacher
having a parent teacher
conference.
The parent has some
questions about her son
Rohit.
She will base her
answers off of a class
data set.
She will base her
answers off of a class
data set.
Mrs. Rohini’s 5th
Grade Class
Scores on Spelling
Test
Bhagya 43
Balaram 45
Rohit 32
Bhoomi 45
Basavaraj 38
Benakappa 45
Boregouda 50
Bharati 45
Busheer 31
Data
She will base her
answers off of a class
data set.
Mrs. Rohini’s 5th
Grade Class
Scores on Spelling
Test
Bhagya 43
Balaram 45
Rohit 32
Bhoomi 45
Basavaraj 38
Benakappa 45
Boregouda 50
Bharati 45
Busheer 31
Data
Set
She will base her
answers off of a class
data set.
Mrs. Rohini’s 5th
Grade Class
Scores on Spelling
Test
Bhagya 43
Balaram 45
Rohit 32
Bhoomi 45
Basavaraj 38
Benakappa 45
Boregouda 50
Bharati 45
Busheer 31
Here are the parent’s
questions with Mrs.
Graham’s answers
Mrs. Rohini’s 5th
Grade Class
Scores on Spelling
Test
Bhagya 43
Balaram 45
Rohit 32
Bhoomi 45
Basavaraj 38
Benakappa 45
Boregouda 50
Bharati 45
Busheer 31
What was
Rohit’s
score?
Mrs. Rohini’s 5th
Grade Class
Scores on Spelling
Test
Bhagya 43
Balaram 45
Rohit 32
Bhoomi 45
Basavaraj 38
Benakappa 45
Boregouda 50
Bharati 45
Busheer 31
Mrs. Rohini’s 5th
Grade Class
Scores on Spelling
Test
Bhagya 43
Balaram 45
Rohit 32
Bhoomi 45
Basavaraj 38
Benakappa 45
Boregouda 50
Bharati 45
Busheer 31
32
Mrs. Rohini’s 5th
Grade Class
Scores on Spelling
Test
Bhagya 43
Balaram 45
Rohit 32
Bhoomi 45
Basavaraj 38
Benakappa 45
Boregouda 50
Bharati 45
Busheer 31
Out of how
many
possible?
Mrs. Rohini’s 5th
Grade Class
Scores on Spelling
Test
Bhagya 43
Balaram 45
Rohit 32
Bhoomi 45
Basavaraj 38
Benakappa 45
Boregouda 50
Bharati 45
Busheer 31
50
Mrs. Rohini’s 5th
Grade Class
Scores on Spelling
Test
Bhagya 43
Balaram 45
Rohit 32
Bhoomi 45
Basavaraj 38
Benakappa 45
Boregouda 50
Bharati 45
Busheer 31
Mrs. Rohini’s 5th
Grade Class
Scores on Spelling
Test
Bhagya 43
Balaram 45
Rohit 32
Bhoomi 45
Basavaraj 38
Benakappa 45
Boregouda 50
Bharati 45
Busheer 31
What were
the highest
and lowest
scores?
Mrs. Rohini’s 5th
Grade Class
Scores on Spelling
Test
Bhagya 43
Balaram 45
Rohit 32
Bhoomi 45
Basavaraj 38
Benakappa 45
Boregouda 50
Bharati 45
Busheer 31
Highest 50,
Lowest 31
Mrs. Rohini’s 5th
Grade Class
Scores on Spelling
Test
Bhagya 43
Balaram 45
Rohit 32
Bhoomi 45
Basavaraj 38
Benakappa 45
Boregouda 50
Bharati 45
Busheer 31
What was
the class
average?
Mrs. Rohini’s 5th
Grade Class
Scores on Spelling
Test
Bhagya 43
Balaram 45
Rohit 32
Bhoomi 45
Basavaraj 38
Benakappa 45
Boregouda 50
Bharati 45
Busheer 31
About 42
What was
the most
common
score?
Mrs. Rohini’s 5th
Grade Class
Scores on Spelling
Test
Bhagya 43
Balaram 45
Rohit 32
Bhoomi 45
Basavaraj 38
Benakappa 45
Boregouda 50
Bharati 45
Busheer 31
Mrs. Rohini’s 5th
Grade Class
Scores on Spelling
Test
Bhagya 43
Balaram 45
Rohit 32
Bhoomi 45
Basavaraj 38
Benakappa 45
Boregouda 50
Bharati 45
Busheer 31
45
Look’s like
Bobby
needs
more study
time!
Mrs. Rohini’s 5th
Grade Class
Scores on Spelling
Test
Bhagya 43
Balaram 45
Rohit 32
Bhoomi 45
Basavaraj 38
Benakappa 45
Boregouda 50
Bharati 45
Busheer 31
Mrs. Rohini’s 5th
Grade Class
Scores on Spelling
Test
Bhagya 43
Balaram 45
Rohit 32
Bhoomi 45
Basavaraj 38
Benakappa 45
Boregouda 50
Bharati 45
Busheer 31
That’s
probably a
good idea.
Mrs. Rohini’s 5th
Grade Class
Scores on Spelling
Test
Bhagya 43
Balaram 45
Rohit 32
Bhoomi 45
Basavaraj 38
Benakappa 45
Boregouda 50
Bharati 45
Busheer 31
Back to our definition:
Mrs. Rohini’s 5th
Grade Class
Scores on Spelling
Test
Bhagya 43
Balaram 45
Rohit 32
Bhoomi 45
Basavaraj 38
Benakappa 45
Boregouda 50
Bharati 45
Busheer 31
descriptive statistics describe
the features of a data set using
numerical measures
Mrs. Rohini’s 5th
Grade Class
Scores on Spelling
Test
Bhagya 43
Balaram 45
Rohit 32
Bhoomi 45
Basavaraj 38
Benakappa 45
Boregouda 50
Bharati 45
Busheer 31
descriptive statistics describe
the features of a data set using
numerical measures
Data Set
Mrs. Rohini’s 5th
Grade Class
Scores on Spelling
Test
Bhagya 43
Balaram 45
Rohit 32
Bhoomi 45
Basavaraj 38
Benakappa 45
Boregouda 50
Bharati 45
Busheer 31
descriptive statistics describe
the features of a data set using
numerical measures
Data Set
Numerical Measures
Mrs. Rohini’s 5th
Grade Class
Scores on Spelling
Test
Bhagya 43
Balaram 45
Rohit 32
Bhoomi 45
Basavaraj 38
Benakappa 45
Boregouda 50
Bharati 45
Busheer 31
descriptive statistics describe
the features of a data set using
numerical measures
Data Set
Numerical Measures
Highest to Lowest Score – THE RANGE
Most Common Score – THE MODE
Average Score – THE MEAN
Etc.
Mrs. Rohini’s 5th
Grade Class
Scores on Spelling
Test
Bhagya 43
Balaram 45
Rohit 32
Bhoomi 45
Basavaraj 38
Benakappa 45
Boregouda 50
Bharati 45
Busheer 31
• While descriptive statistics focus on describing a
data set,
• Inferential statistics aims to draw conclusions
about a larger group (called a population),
• based on what is happening with a smaller group
(called a sample).
• Inferential statistics studies a statistical sample,
and from this analysis is able to say something
about the population from which the sample
came.
Now for Inferential statistics!
• While descriptive statistics focus on
describing a data set, ics aims to draw
conclusions about a larger group
(called a population),
• based on what is happening with a
smaller group (called a sample).
• Inferential statistics studies a statistical
sample, and from this analysis is able
to say something about the population
from which the sample came.
• While descriptive statistics focus on
describing a data set,
• Inferential statistics aims to draw
conclusions or INFER about a larger group
(called a population),
• based on what is happening with a smaller
group (called a sample).
• Inferential statistics studies a statistical
sample, and from this analysis is able to
say something about the population from
which the sample came.
• While descriptive statistics focus on describing a
data set,
• Inferential statistics aims to draw conclusions or
INFER about a larger group (called a population),
• based on what is happening with a smaller group
(called a sample).
• Inferential statistics studies a statistical sample,
and from this analysis is able to say something
about the population from which the sample
came.
• While descriptive statistics focus on describing a
data set,
• Inferential statistics aims to draw conclusions or
INFER about a larger group (called a population),
• based on what is happening with a smaller group
(called a sample).
• INFERential statistics studies a statistical sample,
and from this analysis is able to say something
about the population from which the sample
came.
Same example, but here come a
series of inferential questions
from the parent.
How does your
class compare
with other 5th
grade classes:
In the school?
Mrs. Rohini’s 5th
Grade Class
Scores on Spelling
Test
Bhagya 43
Balaram 45
Rohit 32
Bhoomi 45
Basavaraj 38
Benakappa 45
Boregouda 50
Bharati 45
Busheer 31
About the
same
Mrs. Rohini’s 5th
Grade Class
Scores on Spelling
Test
Bhagya 43
Balaram 45
Rohit 32
Bhoomi 45
Basavaraj 38
Benakappa 45
Boregouda 50
Bharati 45
Busheer 31
What about other
5th grade classes:
In the district?
Mrs. Rohini’s 5th
Grade Class
Scores on Spelling
Test
Bhagya 43
Balaram 45
Rohit 32
Bhoomi 45
Basavaraj 38
Benakappa 45
Boregouda 50
Bharati 45
Busheer 31
A little
better
Mrs. Rohini’s 5th
Grade Class
Scores on Spelling
Test
Bhagya 43
Balaram 45
Rohit 32
Bhoomi 45
Basavaraj 38
Benakappa 45
Boregouda 50
Bharati 45
Busheer 31
What about other
5th grade classes:
In the State
Mrs. Rohini’s 5th
Grade Class
Scores on Spelling
Test
Bhagya 43
Balaram 45
Rohit 32
Bhoomi 45
Basavaraj 38
Benakappa 45
Boregouda 50
Bharati 45
Busheer 31
We are
higher
Mrs. Rohini’s 5th
Grade Class
Scores on Spelling
Test
Bhagya 43
Balaram 45
Rohit 32
Bhoomi 45
Basavaraj 38
Benakappa 45
Boregouda 50
Bharati 45
Busheer 31
What about other
5th grade classes:
In the Country
Mrs. Rohini’s 5th
Grade Class
Scores on Spelling
Test
Bhagya 43
Balaram 45
Rohit 32
Bhoomi 45
Basavaraj 38
Benakappa 45
Boregouda 50
Bharati 45
Busheer 31
We are
much
higher
Mrs. Rohini’s 5th
Grade Class
Scores on Spelling
Test
Bhagya 43
Balaram 45
Rohit 32
Bhoomi 45
Basavaraj 38
Benakappa 45
Boregouda 50
Bharati 45
Busheer 31
Looks like
your class
does not
represent
the national
population
and is
probably
doing better.
Maybe Bobby
doesn’t have to
study as much?
Mrs. Rohini’s 5th
Grade Class
Scores on Spelling
Test
Bhagya 43
Balaram 45
Rohit 32
Bhoomi 45
Basavaraj 38
Benakappa 45
Boregouda 50
Bharati 45
Busheer 31
Maybe.
Mrs. Rohini’s 5th
Grade Class
Scores on Spelling
Test
Bhagya 43
Balaram 45
Rohit 32
Bhoomi 45
Basavaraj 38
Benakappa 45
Boregouda 50
Bharati 45
Busheer 31
Mrs. Rohini’s 5th
Grade Class
Scores on Spelling
Test
Bhagya 43
Balaram 45
Rohit 32
Bhoomi 45
Basavaraj 38
Benakappa 45
Boregouda 50
Bharati 45
Busheer 31
A descriptive study examines the data from
everyone in a group or population.
A descriptive study cannot generalize to other
like groups or populations.
An inferential study examines the data from a
sample and then generalizes the conclusions
about that group to a larger population.
In summary -
A descriptive study examines the data from
everyone in a group or population.
A descriptive study cannot generalize to other
like groups or populations.
An inferential study examines the data from a
sample and then generalizes the conclusions
about that group to a larger population.
A descriptive study examines the data from
everyone in a group or population.
A descriptive study cannot generalize to other
like groups or populations.
An inferential study examines the data from a
sample and then generalizes the conclusions
about that group to a larger population.
A descriptive study examines the data from
everyone in a group or population.
A descriptive study cannot generalize to other
like groups or populations.
An inferential study examines the data from a
sample and then generalizes the conclusions
about that group to a larger population.
A descriptive study examines the data from
everyone in a group or population.
A descriptive study cannot generalize to other
like groups or populations.
An inferential study examines the data from a
sample and then generalizes the conclusions
about that group to a larger population.
Note – inferential and descriptive studies use the
SAME statistics (e.g., mean, range, mode, etc.),
but as you can see – for DIFFERENT reasons!

Module 11-inferential and descriptive statisticsexplanation

  • 1.
  • 2.
    Welcome to thislearning module!
  • 3.
    In this moduleyou will learn the difference between
  • 4.
  • 5.
    In later modulesyou will then determine when a question should be answered with one or the other.
  • 6.
  • 7.
    Simply put, descriptivestatistics describe the features of a data set using numerical measures.
  • 8.
    Simply put, descriptivestatistics describe the features of a data set using numerical measures. And that’s it!
  • 9.
    Simply put, descriptivestatistics describe the features of a data set using numerical measures. And that’s it! Here’s an example
  • 10.
  • 11.
    a fifth Gradeteacher having a parent teacher conference.
  • 12.
    The parent hassome questions about her son Rohit.
  • 13.
    She will baseher answers off of a class data set.
  • 14.
    She will baseher answers off of a class data set. Mrs. Rohini’s 5th Grade Class Scores on Spelling Test Bhagya 43 Balaram 45 Rohit 32 Bhoomi 45 Basavaraj 38 Benakappa 45 Boregouda 50 Bharati 45 Busheer 31
  • 15.
    Data She will baseher answers off of a class data set. Mrs. Rohini’s 5th Grade Class Scores on Spelling Test Bhagya 43 Balaram 45 Rohit 32 Bhoomi 45 Basavaraj 38 Benakappa 45 Boregouda 50 Bharati 45 Busheer 31
  • 16.
    Data Set She will baseher answers off of a class data set. Mrs. Rohini’s 5th Grade Class Scores on Spelling Test Bhagya 43 Balaram 45 Rohit 32 Bhoomi 45 Basavaraj 38 Benakappa 45 Boregouda 50 Bharati 45 Busheer 31
  • 17.
    Here are theparent’s questions with Mrs. Graham’s answers Mrs. Rohini’s 5th Grade Class Scores on Spelling Test Bhagya 43 Balaram 45 Rohit 32 Bhoomi 45 Basavaraj 38 Benakappa 45 Boregouda 50 Bharati 45 Busheer 31
  • 18.
    What was Rohit’s score? Mrs. Rohini’s5th Grade Class Scores on Spelling Test Bhagya 43 Balaram 45 Rohit 32 Bhoomi 45 Basavaraj 38 Benakappa 45 Boregouda 50 Bharati 45 Busheer 31
  • 19.
    Mrs. Rohini’s 5th GradeClass Scores on Spelling Test Bhagya 43 Balaram 45 Rohit 32 Bhoomi 45 Basavaraj 38 Benakappa 45 Boregouda 50 Bharati 45 Busheer 31
  • 20.
    32 Mrs. Rohini’s 5th GradeClass Scores on Spelling Test Bhagya 43 Balaram 45 Rohit 32 Bhoomi 45 Basavaraj 38 Benakappa 45 Boregouda 50 Bharati 45 Busheer 31
  • 21.
    Out of how many possible? Mrs.Rohini’s 5th Grade Class Scores on Spelling Test Bhagya 43 Balaram 45 Rohit 32 Bhoomi 45 Basavaraj 38 Benakappa 45 Boregouda 50 Bharati 45 Busheer 31
  • 22.
    50 Mrs. Rohini’s 5th GradeClass Scores on Spelling Test Bhagya 43 Balaram 45 Rohit 32 Bhoomi 45 Basavaraj 38 Benakappa 45 Boregouda 50 Bharati 45 Busheer 31
  • 23.
    Mrs. Rohini’s 5th GradeClass Scores on Spelling Test Bhagya 43 Balaram 45 Rohit 32 Bhoomi 45 Basavaraj 38 Benakappa 45 Boregouda 50 Bharati 45 Busheer 31 What were the highest and lowest scores?
  • 24.
    Mrs. Rohini’s 5th GradeClass Scores on Spelling Test Bhagya 43 Balaram 45 Rohit 32 Bhoomi 45 Basavaraj 38 Benakappa 45 Boregouda 50 Bharati 45 Busheer 31 Highest 50, Lowest 31
  • 25.
    Mrs. Rohini’s 5th GradeClass Scores on Spelling Test Bhagya 43 Balaram 45 Rohit 32 Bhoomi 45 Basavaraj 38 Benakappa 45 Boregouda 50 Bharati 45 Busheer 31 What was the class average?
  • 26.
    Mrs. Rohini’s 5th GradeClass Scores on Spelling Test Bhagya 43 Balaram 45 Rohit 32 Bhoomi 45 Basavaraj 38 Benakappa 45 Boregouda 50 Bharati 45 Busheer 31 About 42
  • 27.
    What was the most common score? Mrs.Rohini’s 5th Grade Class Scores on Spelling Test Bhagya 43 Balaram 45 Rohit 32 Bhoomi 45 Basavaraj 38 Benakappa 45 Boregouda 50 Bharati 45 Busheer 31
  • 28.
    Mrs. Rohini’s 5th GradeClass Scores on Spelling Test Bhagya 43 Balaram 45 Rohit 32 Bhoomi 45 Basavaraj 38 Benakappa 45 Boregouda 50 Bharati 45 Busheer 31 45
  • 29.
    Look’s like Bobby needs more study time! Mrs.Rohini’s 5th Grade Class Scores on Spelling Test Bhagya 43 Balaram 45 Rohit 32 Bhoomi 45 Basavaraj 38 Benakappa 45 Boregouda 50 Bharati 45 Busheer 31
  • 30.
    Mrs. Rohini’s 5th GradeClass Scores on Spelling Test Bhagya 43 Balaram 45 Rohit 32 Bhoomi 45 Basavaraj 38 Benakappa 45 Boregouda 50 Bharati 45 Busheer 31 That’s probably a good idea.
  • 31.
    Mrs. Rohini’s 5th GradeClass Scores on Spelling Test Bhagya 43 Balaram 45 Rohit 32 Bhoomi 45 Basavaraj 38 Benakappa 45 Boregouda 50 Bharati 45 Busheer 31
  • 32.
    Back to ourdefinition: Mrs. Rohini’s 5th Grade Class Scores on Spelling Test Bhagya 43 Balaram 45 Rohit 32 Bhoomi 45 Basavaraj 38 Benakappa 45 Boregouda 50 Bharati 45 Busheer 31
  • 33.
    descriptive statistics describe thefeatures of a data set using numerical measures Mrs. Rohini’s 5th Grade Class Scores on Spelling Test Bhagya 43 Balaram 45 Rohit 32 Bhoomi 45 Basavaraj 38 Benakappa 45 Boregouda 50 Bharati 45 Busheer 31
  • 34.
    descriptive statistics describe thefeatures of a data set using numerical measures Data Set Mrs. Rohini’s 5th Grade Class Scores on Spelling Test Bhagya 43 Balaram 45 Rohit 32 Bhoomi 45 Basavaraj 38 Benakappa 45 Boregouda 50 Bharati 45 Busheer 31
  • 35.
    descriptive statistics describe thefeatures of a data set using numerical measures Data Set Numerical Measures Mrs. Rohini’s 5th Grade Class Scores on Spelling Test Bhagya 43 Balaram 45 Rohit 32 Bhoomi 45 Basavaraj 38 Benakappa 45 Boregouda 50 Bharati 45 Busheer 31
  • 36.
    descriptive statistics describe thefeatures of a data set using numerical measures Data Set Numerical Measures Highest to Lowest Score – THE RANGE Most Common Score – THE MODE Average Score – THE MEAN Etc. Mrs. Rohini’s 5th Grade Class Scores on Spelling Test Bhagya 43 Balaram 45 Rohit 32 Bhoomi 45 Basavaraj 38 Benakappa 45 Boregouda 50 Bharati 45 Busheer 31
  • 37.
    • While descriptivestatistics focus on describing a data set, • Inferential statistics aims to draw conclusions about a larger group (called a population), • based on what is happening with a smaller group (called a sample). • Inferential statistics studies a statistical sample, and from this analysis is able to say something about the population from which the sample came. Now for Inferential statistics!
  • 38.
    • While descriptivestatistics focus on describing a data set, ics aims to draw conclusions about a larger group (called a population), • based on what is happening with a smaller group (called a sample). • Inferential statistics studies a statistical sample, and from this analysis is able to say something about the population from which the sample came.
  • 39.
    • While descriptivestatistics focus on describing a data set, • Inferential statistics aims to draw conclusions or INFER about a larger group (called a population), • based on what is happening with a smaller group (called a sample). • Inferential statistics studies a statistical sample, and from this analysis is able to say something about the population from which the sample came.
  • 40.
    • While descriptivestatistics focus on describing a data set, • Inferential statistics aims to draw conclusions or INFER about a larger group (called a population), • based on what is happening with a smaller group (called a sample). • Inferential statistics studies a statistical sample, and from this analysis is able to say something about the population from which the sample came.
  • 41.
    • While descriptivestatistics focus on describing a data set, • Inferential statistics aims to draw conclusions or INFER about a larger group (called a population), • based on what is happening with a smaller group (called a sample). • INFERential statistics studies a statistical sample, and from this analysis is able to say something about the population from which the sample came.
  • 42.
    Same example, buthere come a series of inferential questions from the parent.
  • 43.
    How does your classcompare with other 5th grade classes: In the school? Mrs. Rohini’s 5th Grade Class Scores on Spelling Test Bhagya 43 Balaram 45 Rohit 32 Bhoomi 45 Basavaraj 38 Benakappa 45 Boregouda 50 Bharati 45 Busheer 31
  • 44.
    About the same Mrs. Rohini’s5th Grade Class Scores on Spelling Test Bhagya 43 Balaram 45 Rohit 32 Bhoomi 45 Basavaraj 38 Benakappa 45 Boregouda 50 Bharati 45 Busheer 31
  • 45.
    What about other 5thgrade classes: In the district? Mrs. Rohini’s 5th Grade Class Scores on Spelling Test Bhagya 43 Balaram 45 Rohit 32 Bhoomi 45 Basavaraj 38 Benakappa 45 Boregouda 50 Bharati 45 Busheer 31
  • 46.
    A little better Mrs. Rohini’s5th Grade Class Scores on Spelling Test Bhagya 43 Balaram 45 Rohit 32 Bhoomi 45 Basavaraj 38 Benakappa 45 Boregouda 50 Bharati 45 Busheer 31
  • 47.
    What about other 5thgrade classes: In the State Mrs. Rohini’s 5th Grade Class Scores on Spelling Test Bhagya 43 Balaram 45 Rohit 32 Bhoomi 45 Basavaraj 38 Benakappa 45 Boregouda 50 Bharati 45 Busheer 31
  • 48.
    We are higher Mrs. Rohini’s5th Grade Class Scores on Spelling Test Bhagya 43 Balaram 45 Rohit 32 Bhoomi 45 Basavaraj 38 Benakappa 45 Boregouda 50 Bharati 45 Busheer 31
  • 49.
    What about other 5thgrade classes: In the Country Mrs. Rohini’s 5th Grade Class Scores on Spelling Test Bhagya 43 Balaram 45 Rohit 32 Bhoomi 45 Basavaraj 38 Benakappa 45 Boregouda 50 Bharati 45 Busheer 31
  • 50.
    We are much higher Mrs. Rohini’s5th Grade Class Scores on Spelling Test Bhagya 43 Balaram 45 Rohit 32 Bhoomi 45 Basavaraj 38 Benakappa 45 Boregouda 50 Bharati 45 Busheer 31
  • 51.
    Looks like your class doesnot represent the national population and is probably doing better. Maybe Bobby doesn’t have to study as much? Mrs. Rohini’s 5th Grade Class Scores on Spelling Test Bhagya 43 Balaram 45 Rohit 32 Bhoomi 45 Basavaraj 38 Benakappa 45 Boregouda 50 Bharati 45 Busheer 31
  • 52.
    Maybe. Mrs. Rohini’s 5th GradeClass Scores on Spelling Test Bhagya 43 Balaram 45 Rohit 32 Bhoomi 45 Basavaraj 38 Benakappa 45 Boregouda 50 Bharati 45 Busheer 31
  • 53.
    Mrs. Rohini’s 5th GradeClass Scores on Spelling Test Bhagya 43 Balaram 45 Rohit 32 Bhoomi 45 Basavaraj 38 Benakappa 45 Boregouda 50 Bharati 45 Busheer 31
  • 54.
    A descriptive studyexamines the data from everyone in a group or population. A descriptive study cannot generalize to other like groups or populations. An inferential study examines the data from a sample and then generalizes the conclusions about that group to a larger population. In summary -
  • 55.
    A descriptive studyexamines the data from everyone in a group or population. A descriptive study cannot generalize to other like groups or populations. An inferential study examines the data from a sample and then generalizes the conclusions about that group to a larger population.
  • 56.
    A descriptive studyexamines the data from everyone in a group or population. A descriptive study cannot generalize to other like groups or populations. An inferential study examines the data from a sample and then generalizes the conclusions about that group to a larger population.
  • 57.
    A descriptive studyexamines the data from everyone in a group or population. A descriptive study cannot generalize to other like groups or populations. An inferential study examines the data from a sample and then generalizes the conclusions about that group to a larger population.
  • 58.
    A descriptive studyexamines the data from everyone in a group or population. A descriptive study cannot generalize to other like groups or populations. An inferential study examines the data from a sample and then generalizes the conclusions about that group to a larger population. Note – inferential and descriptive studies use the SAME statistics (e.g., mean, range, mode, etc.), but as you can see – for DIFFERENT reasons!