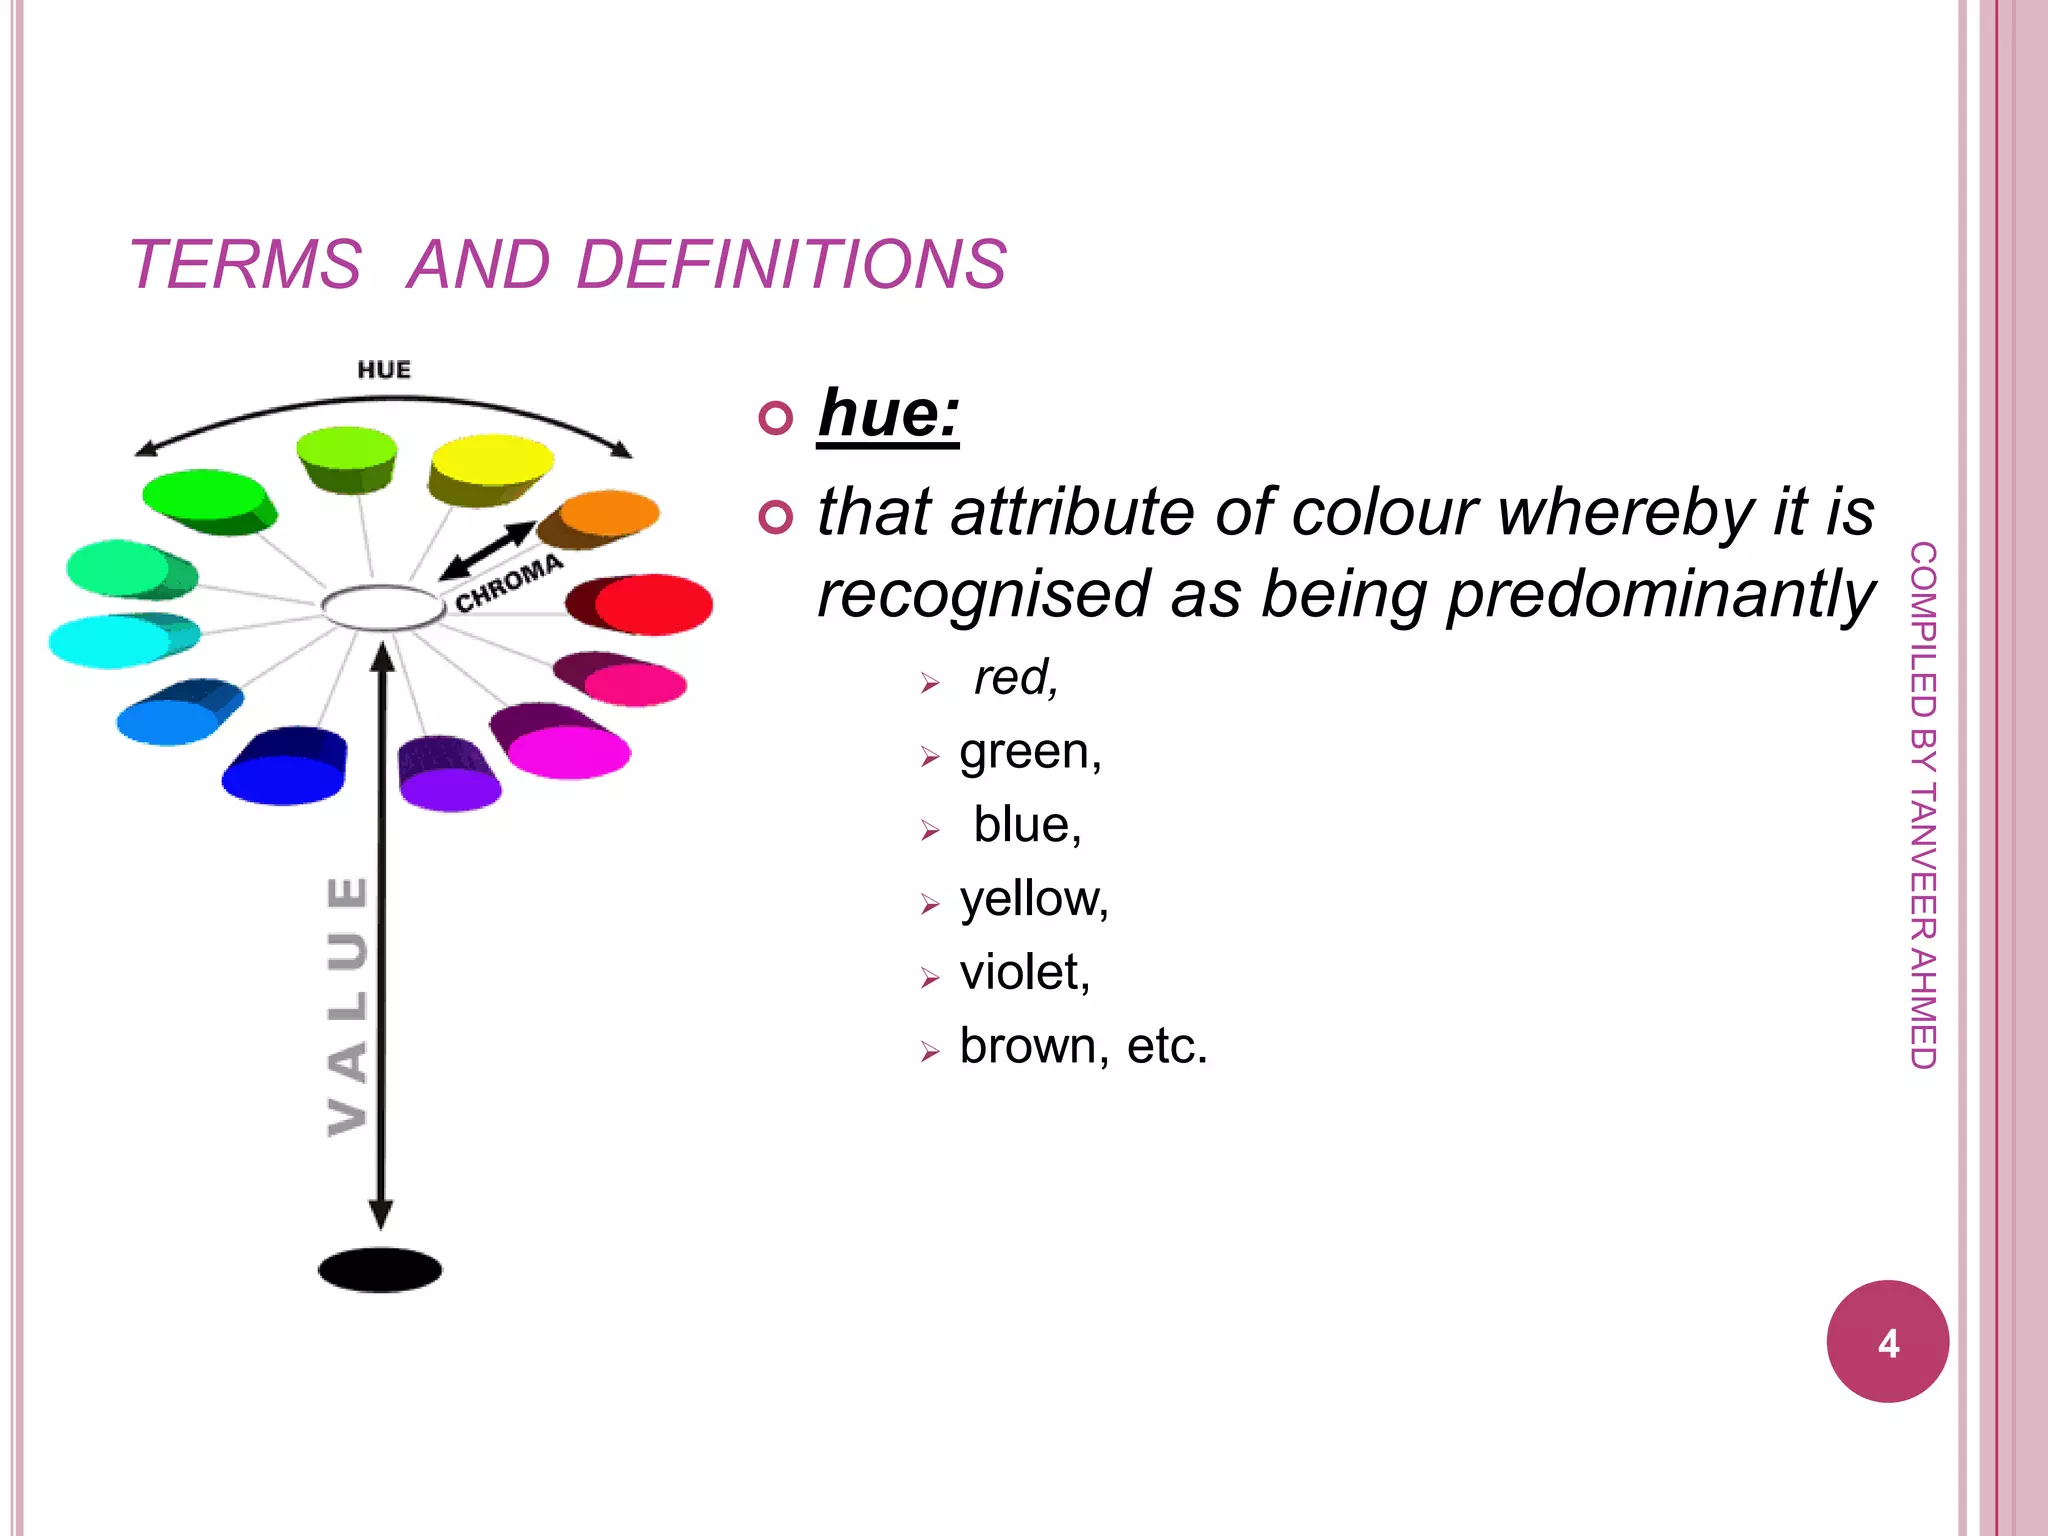
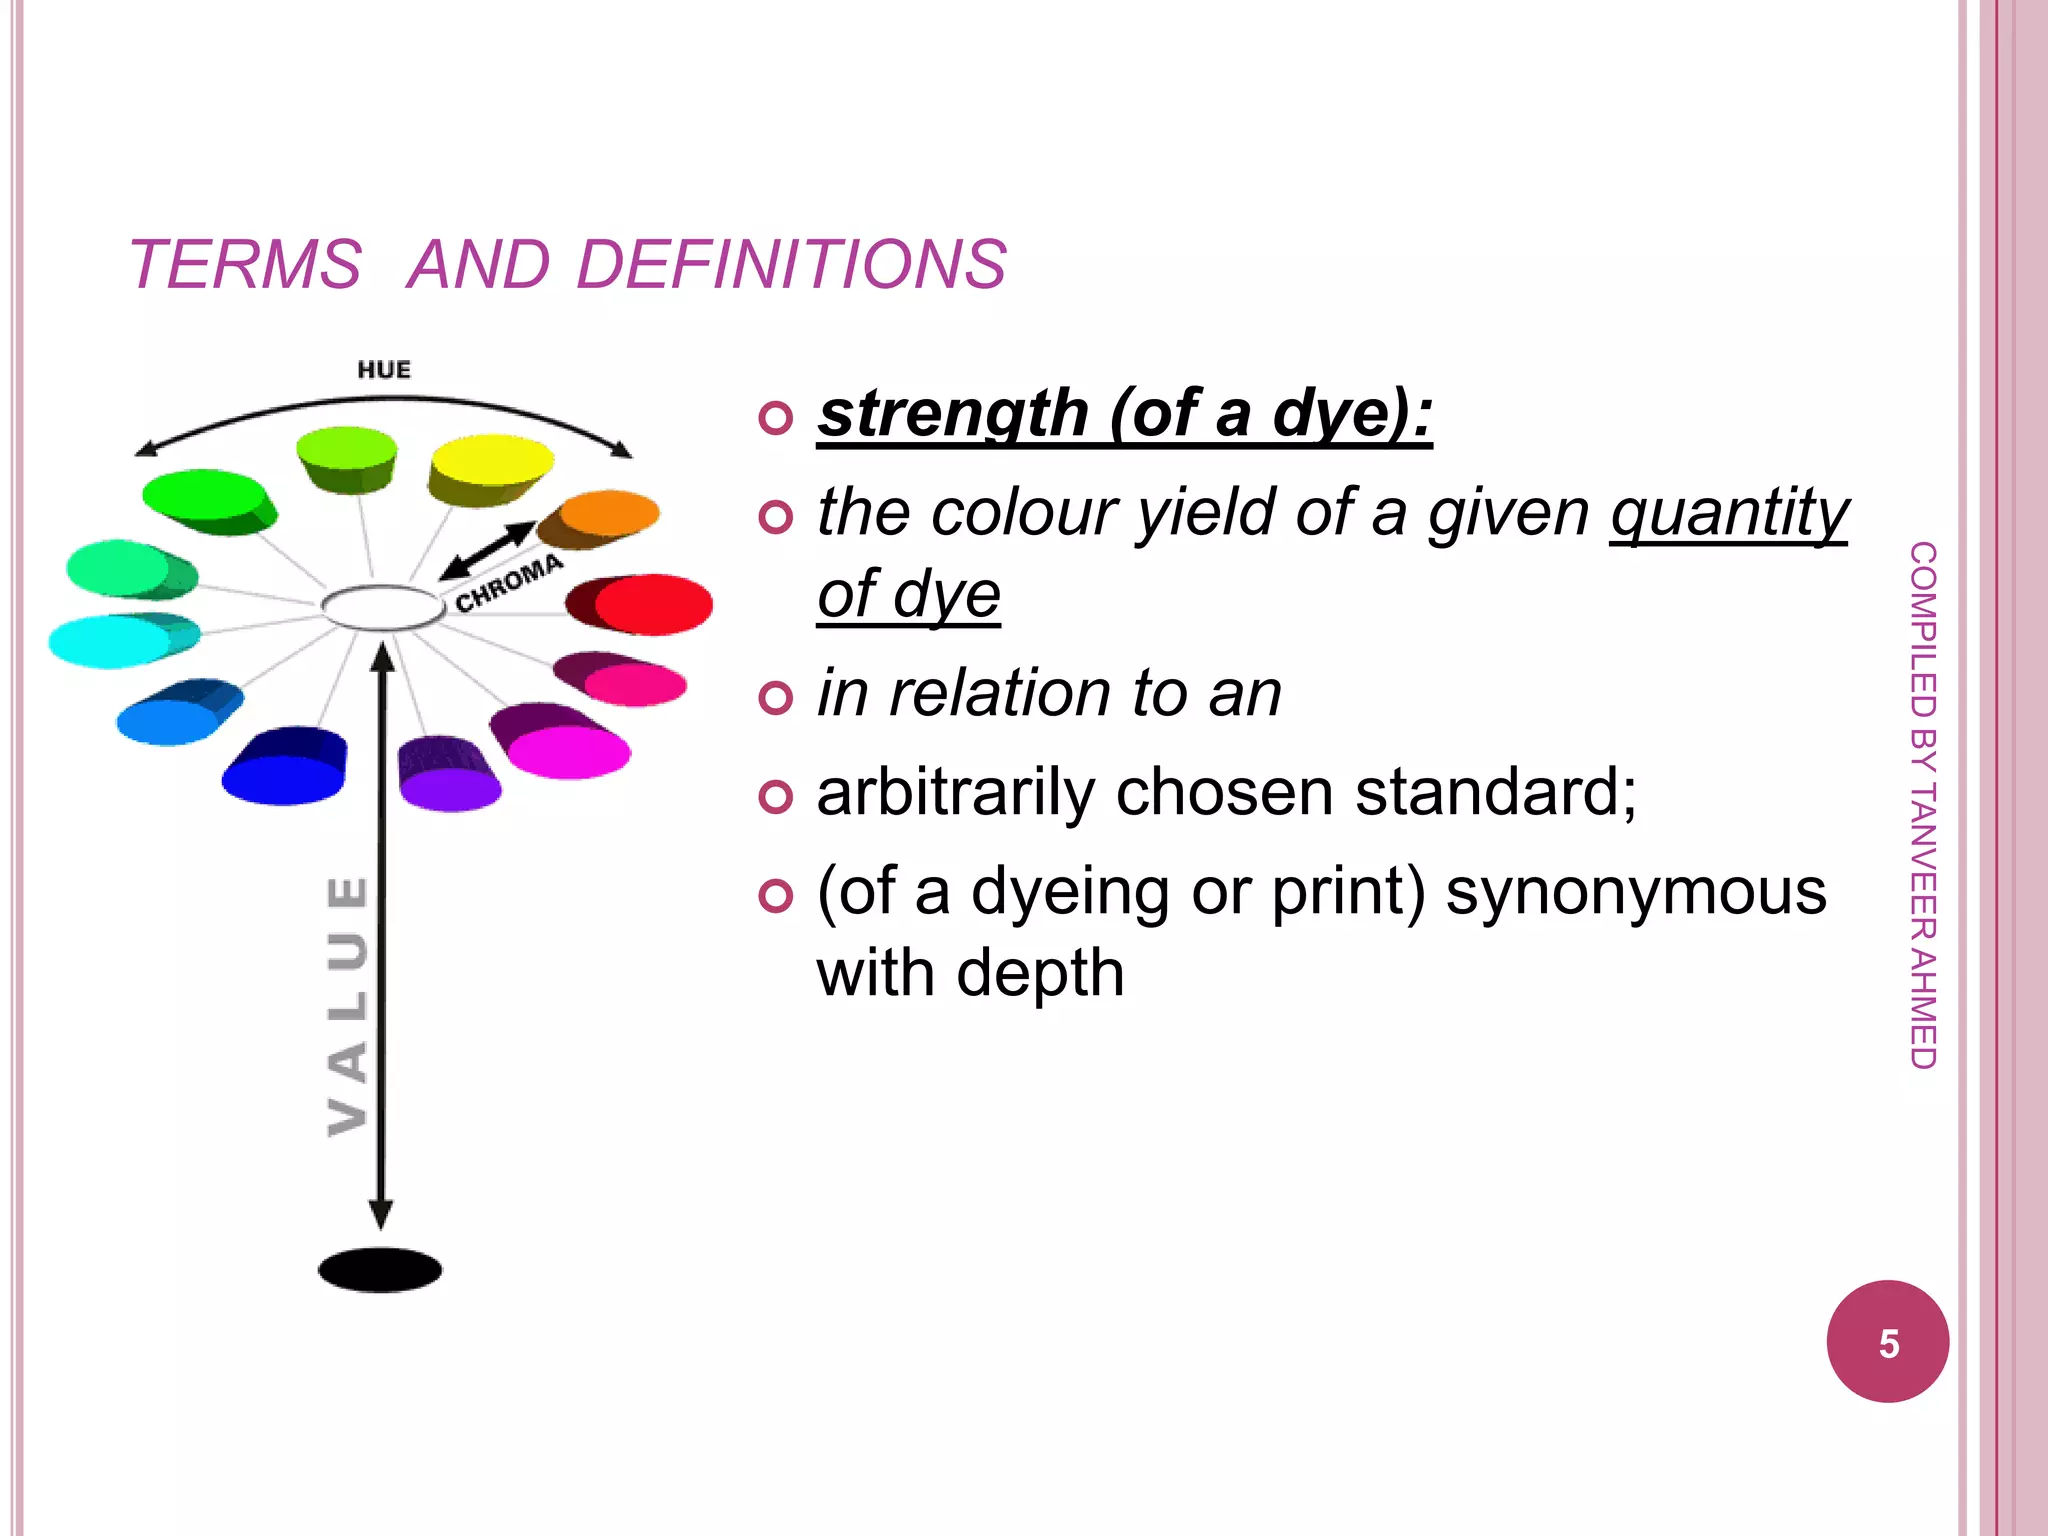
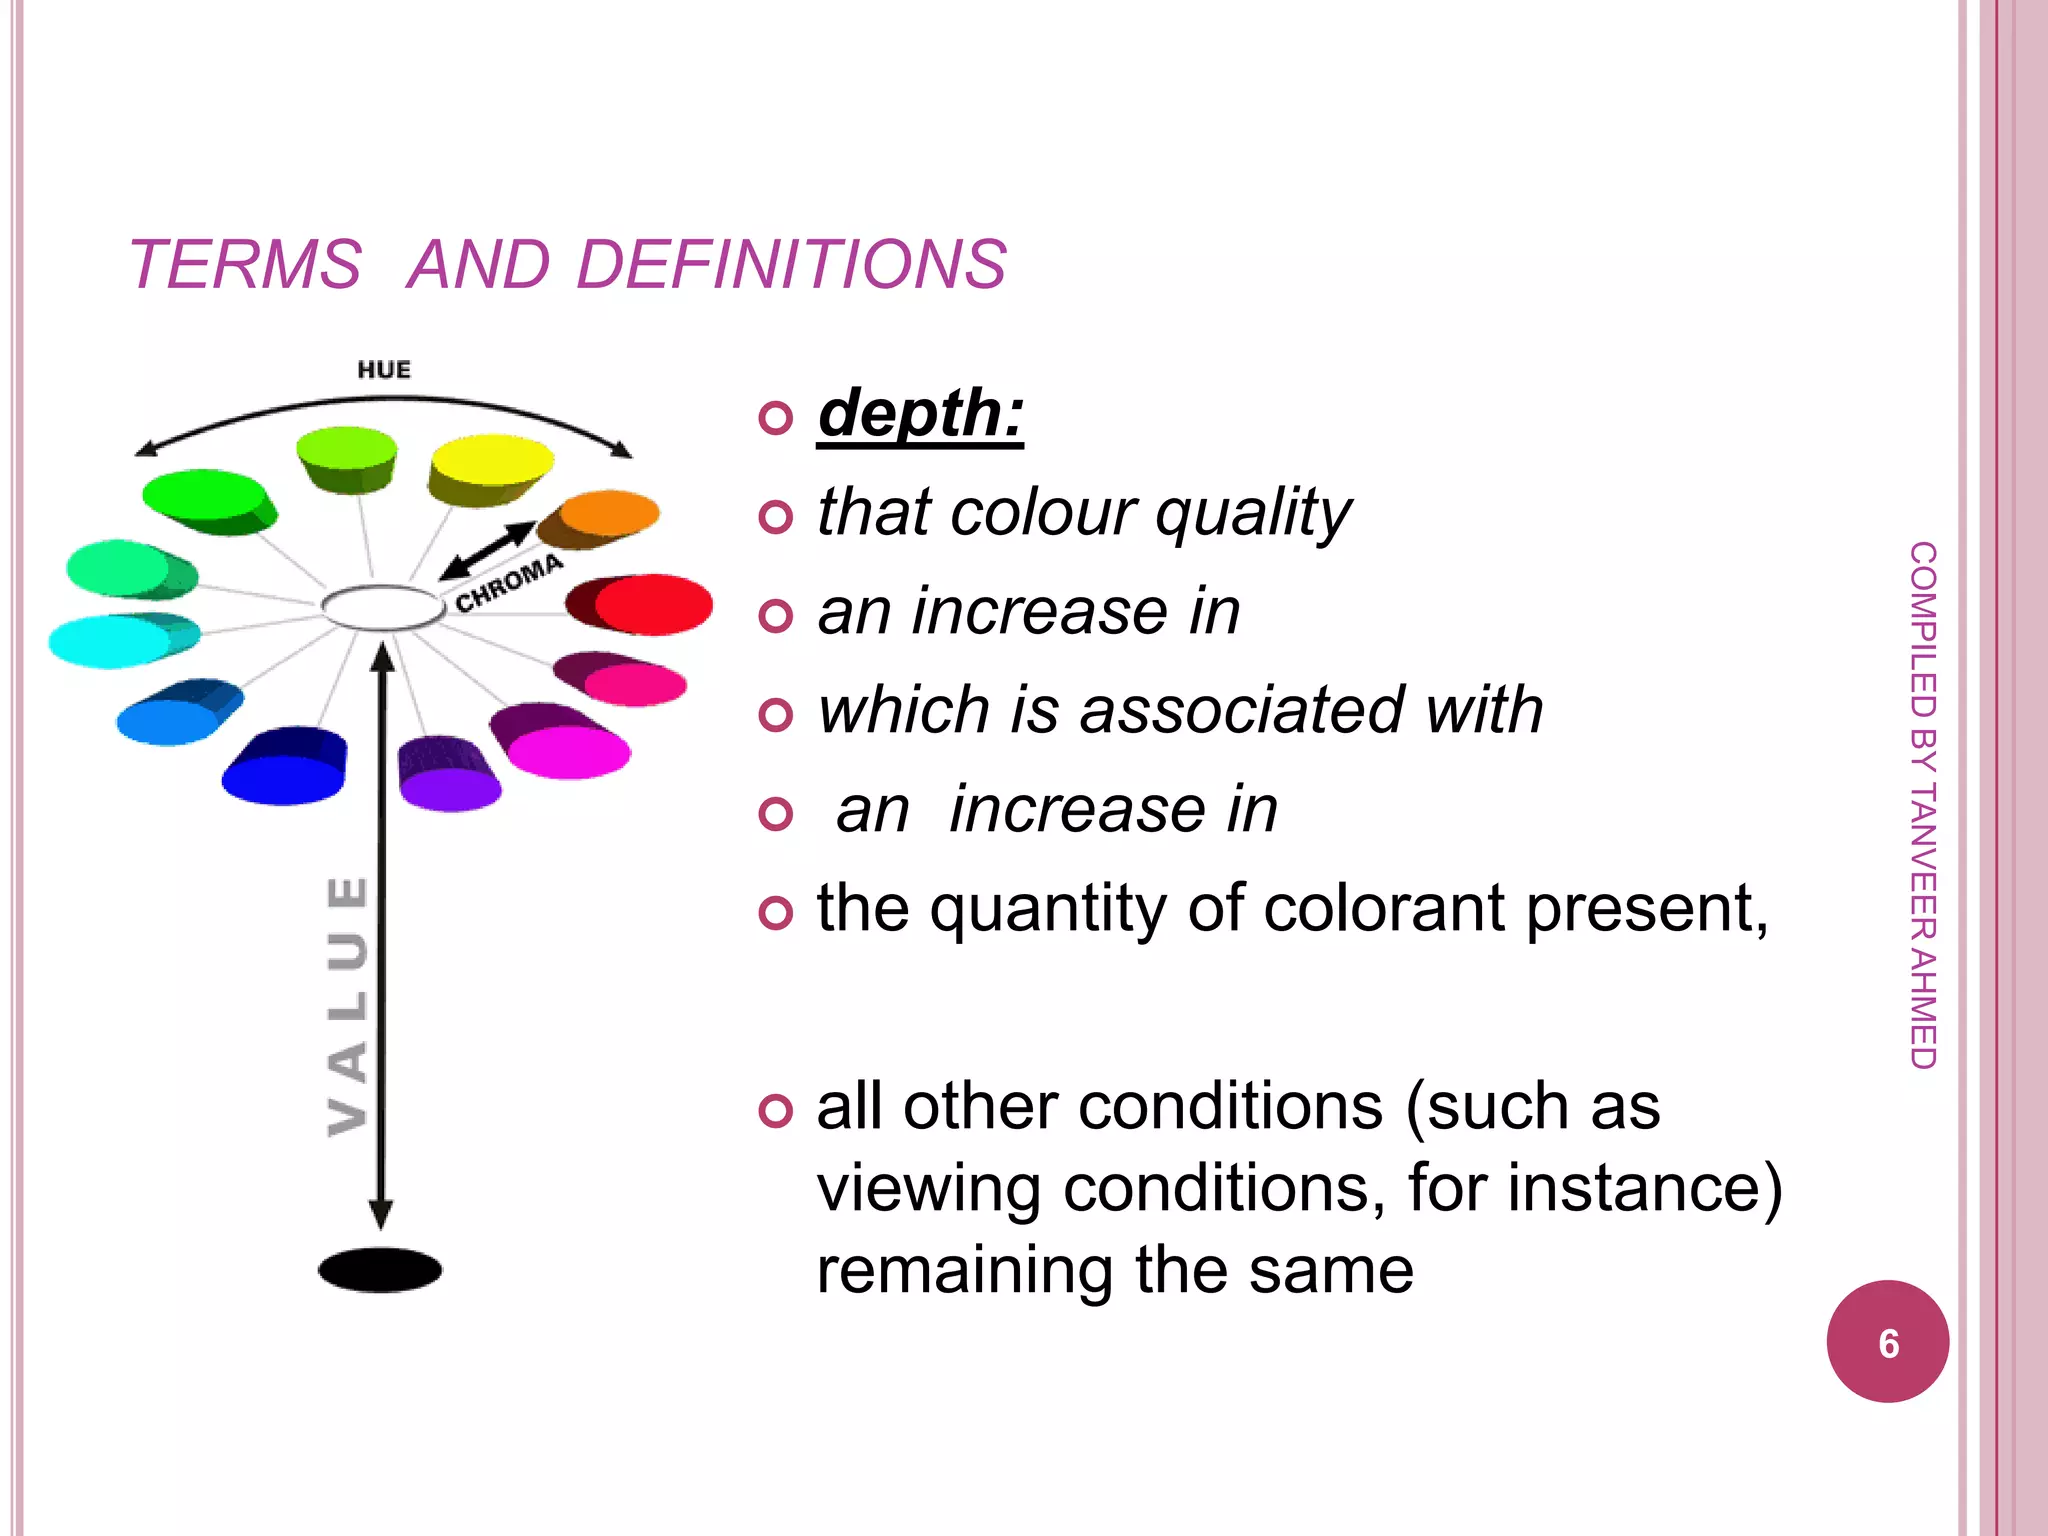
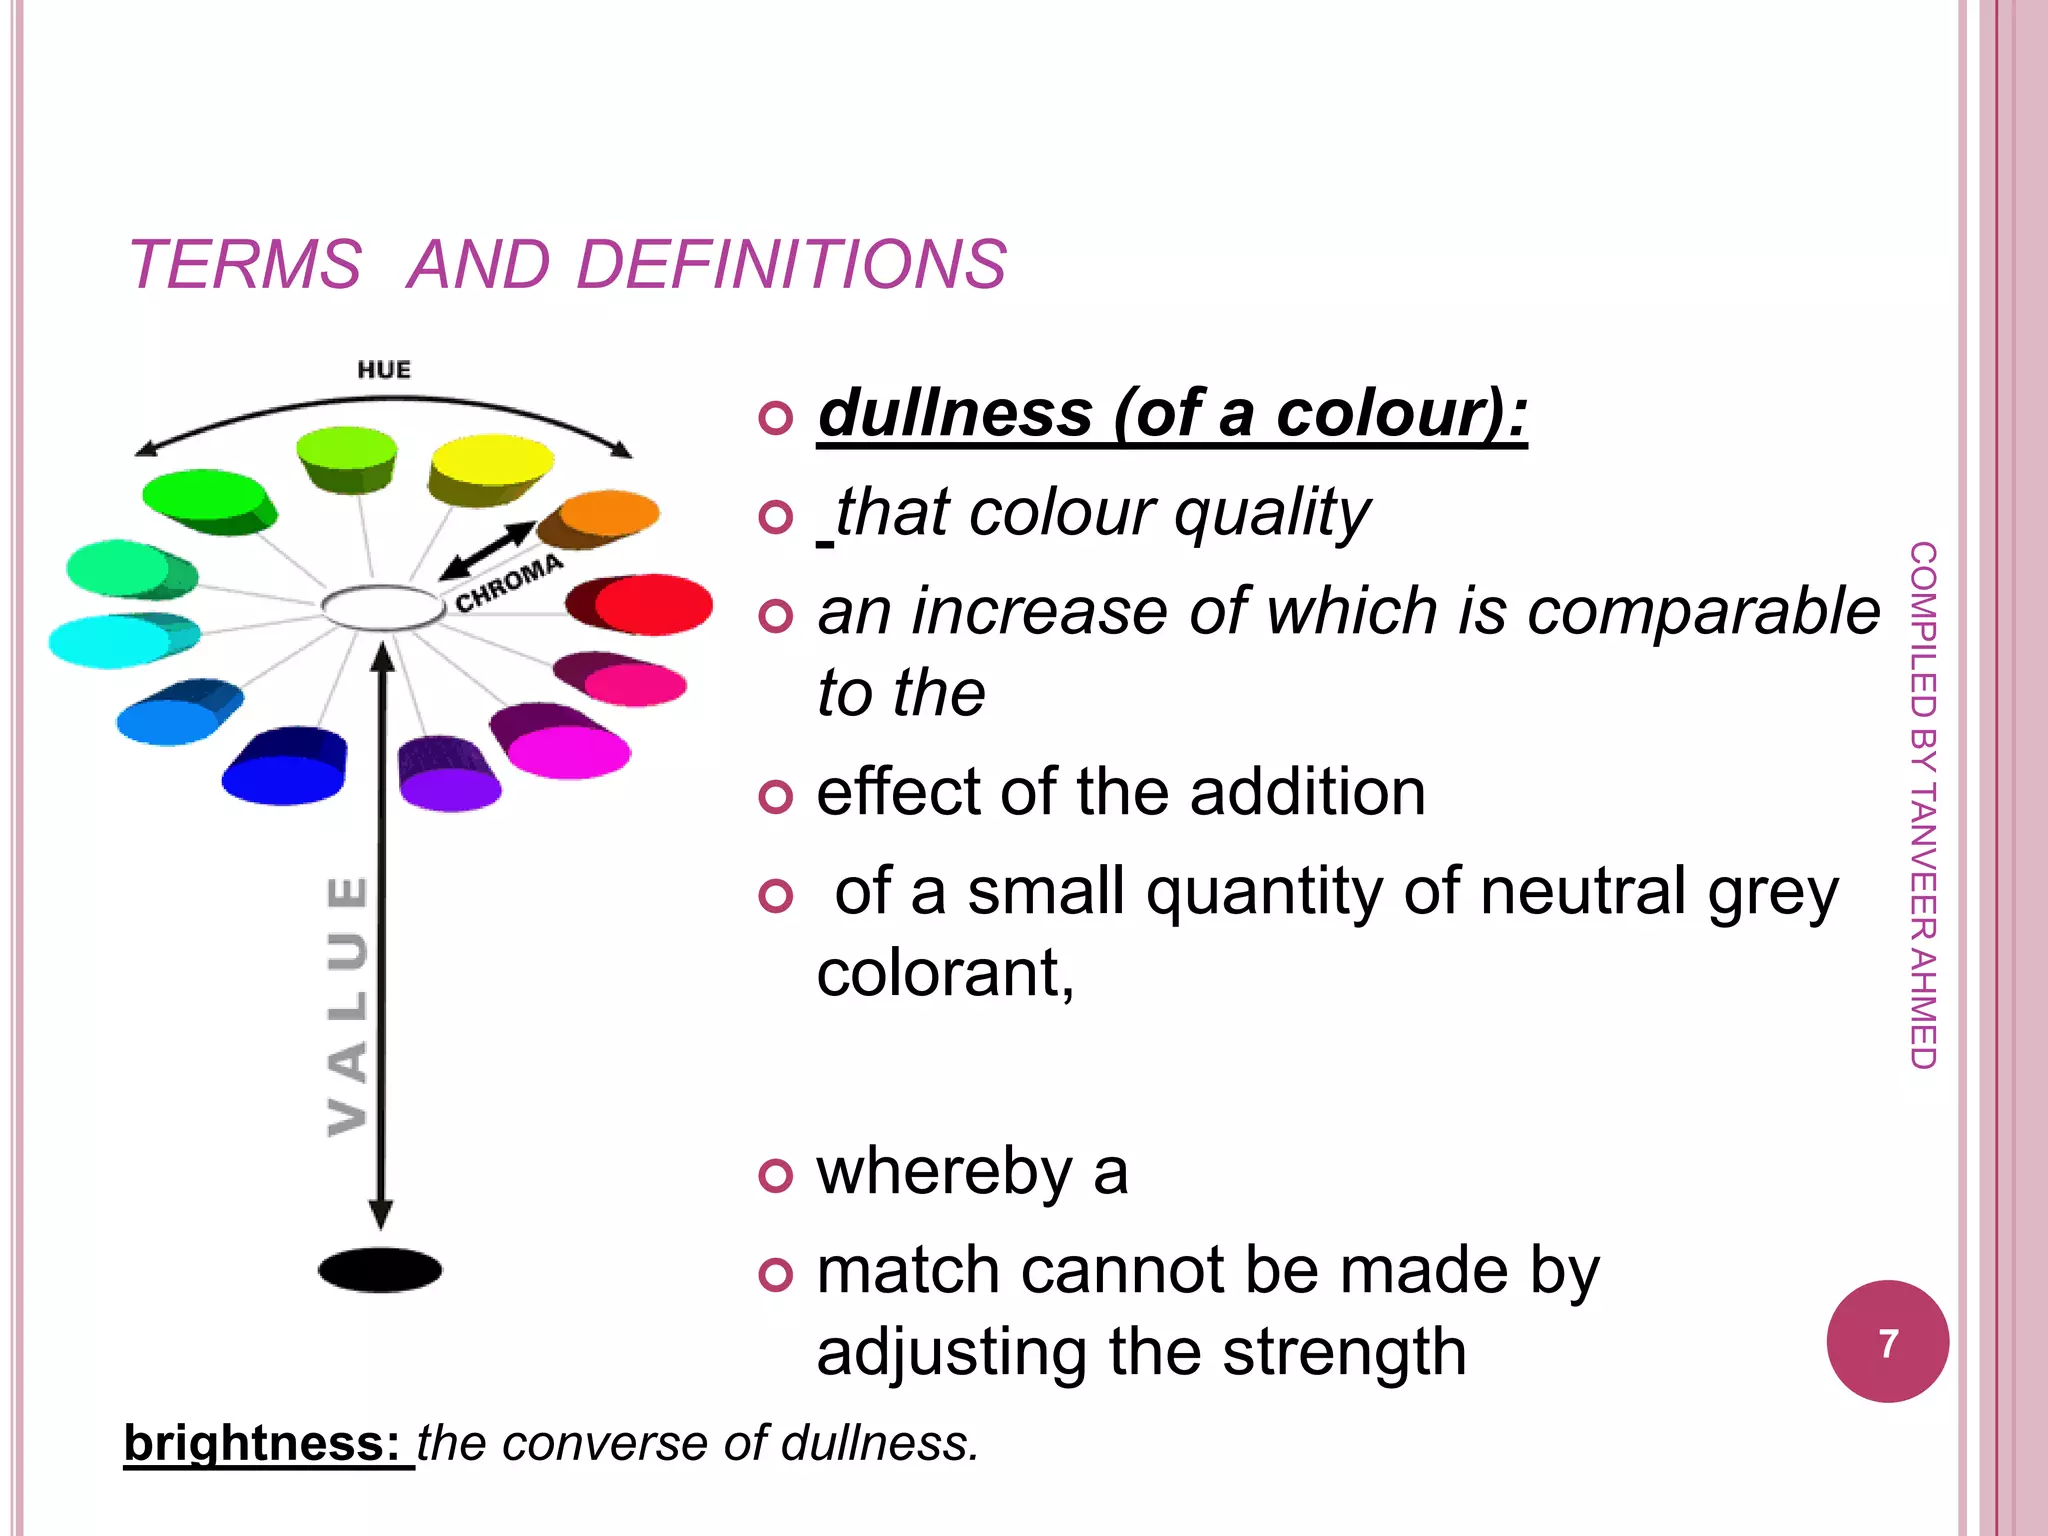
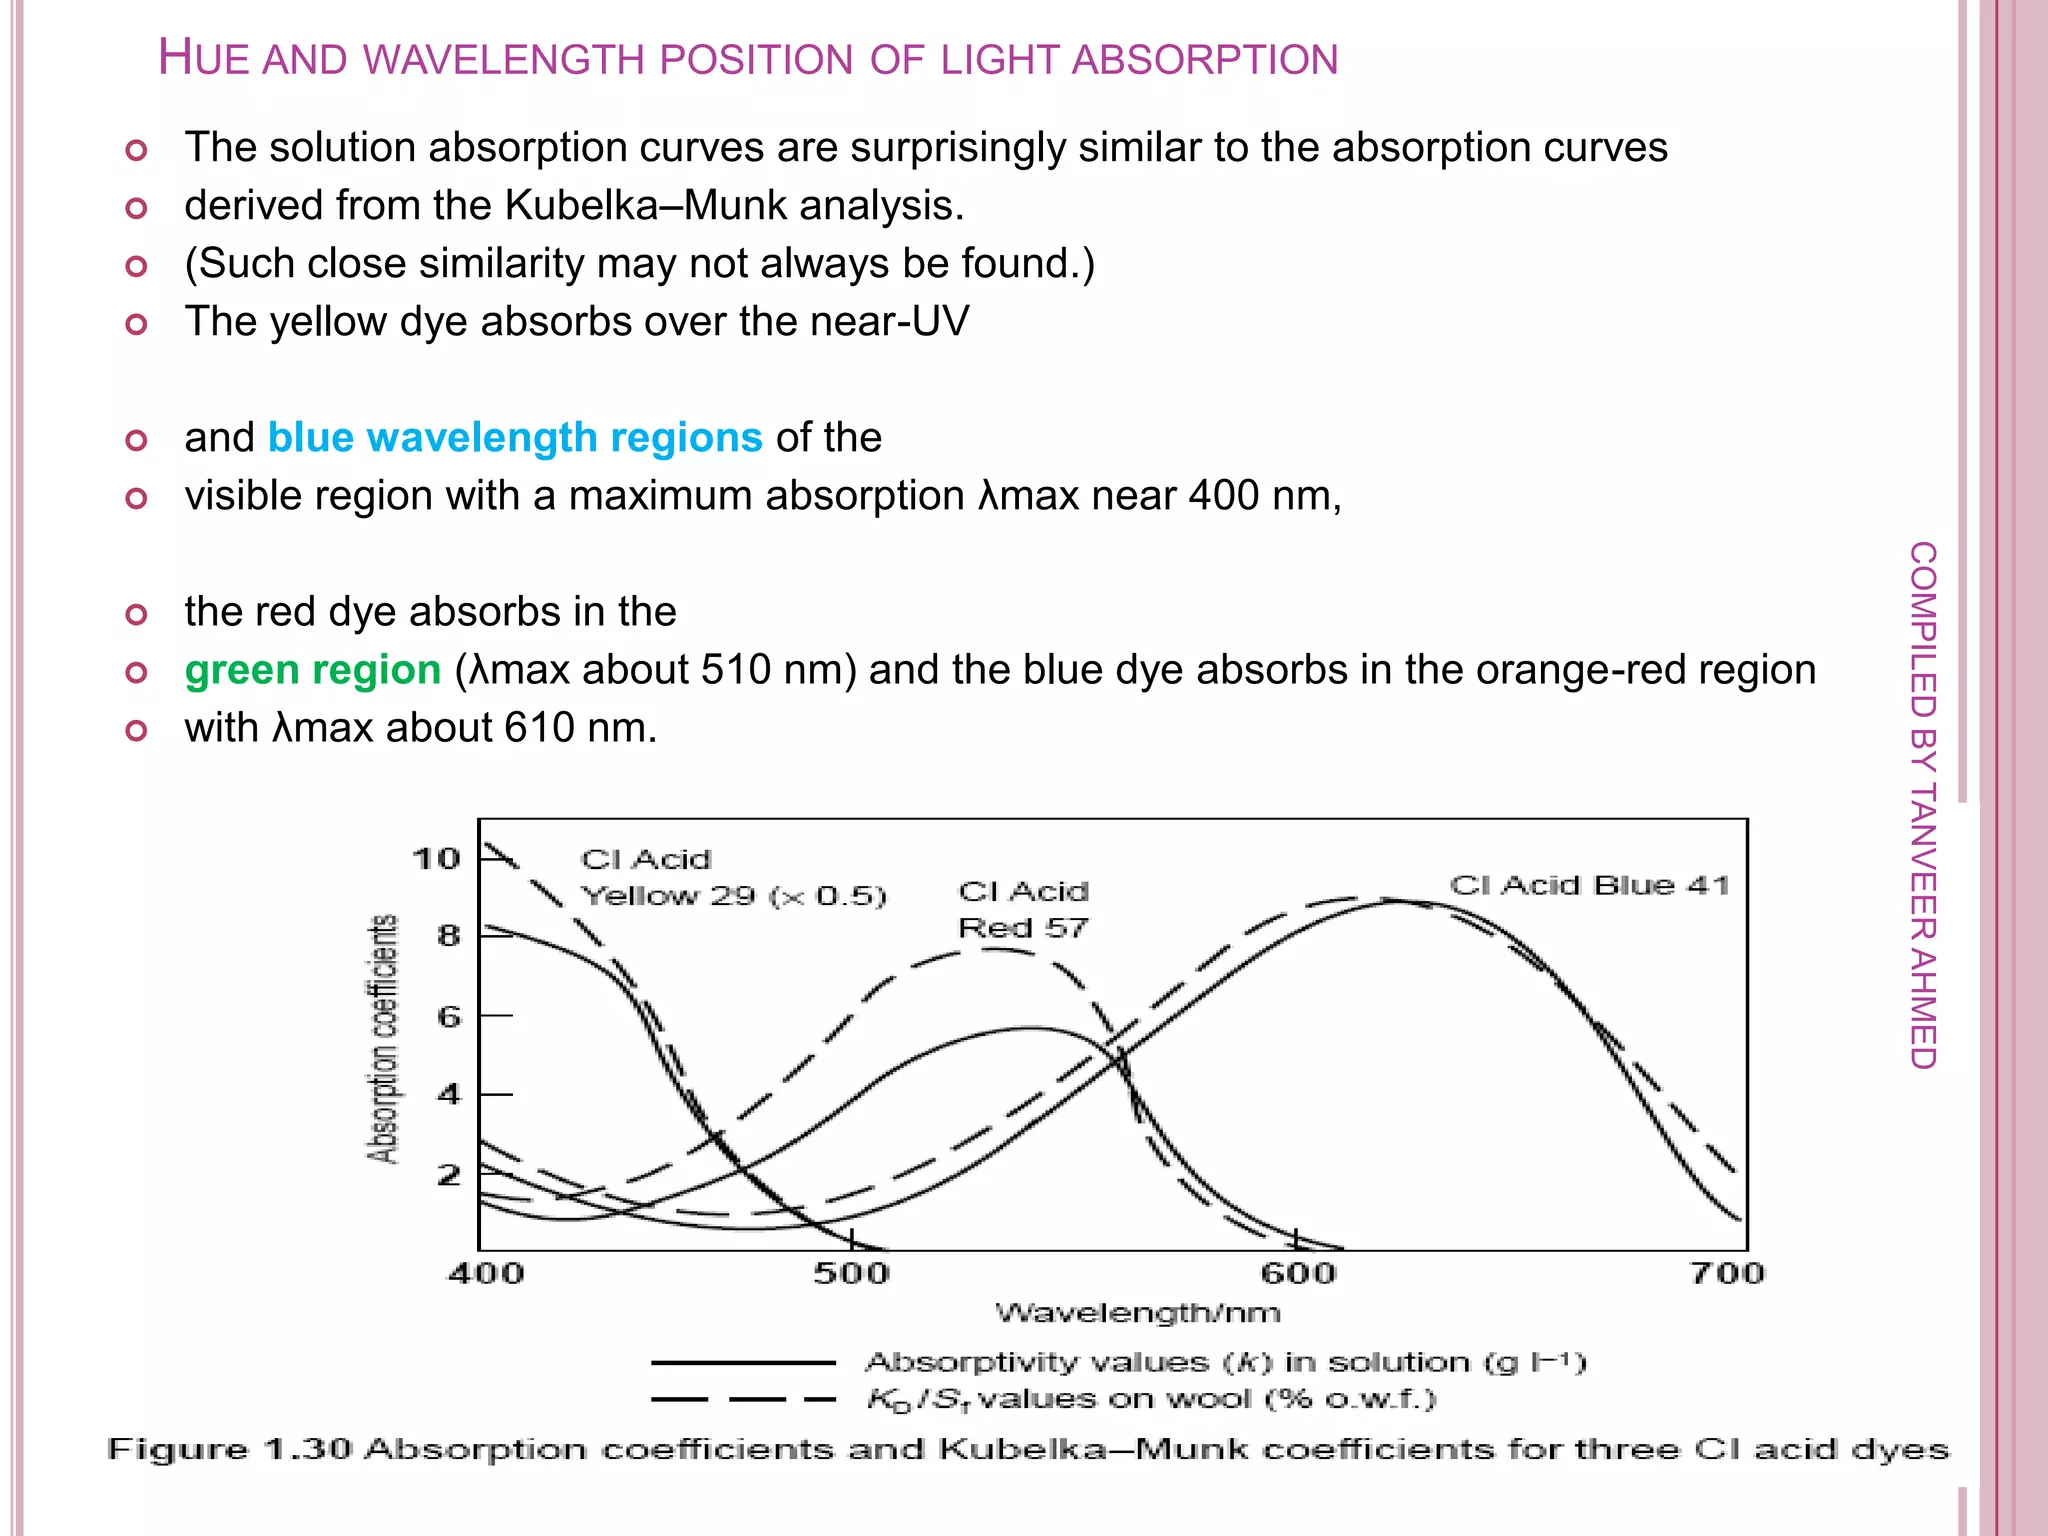
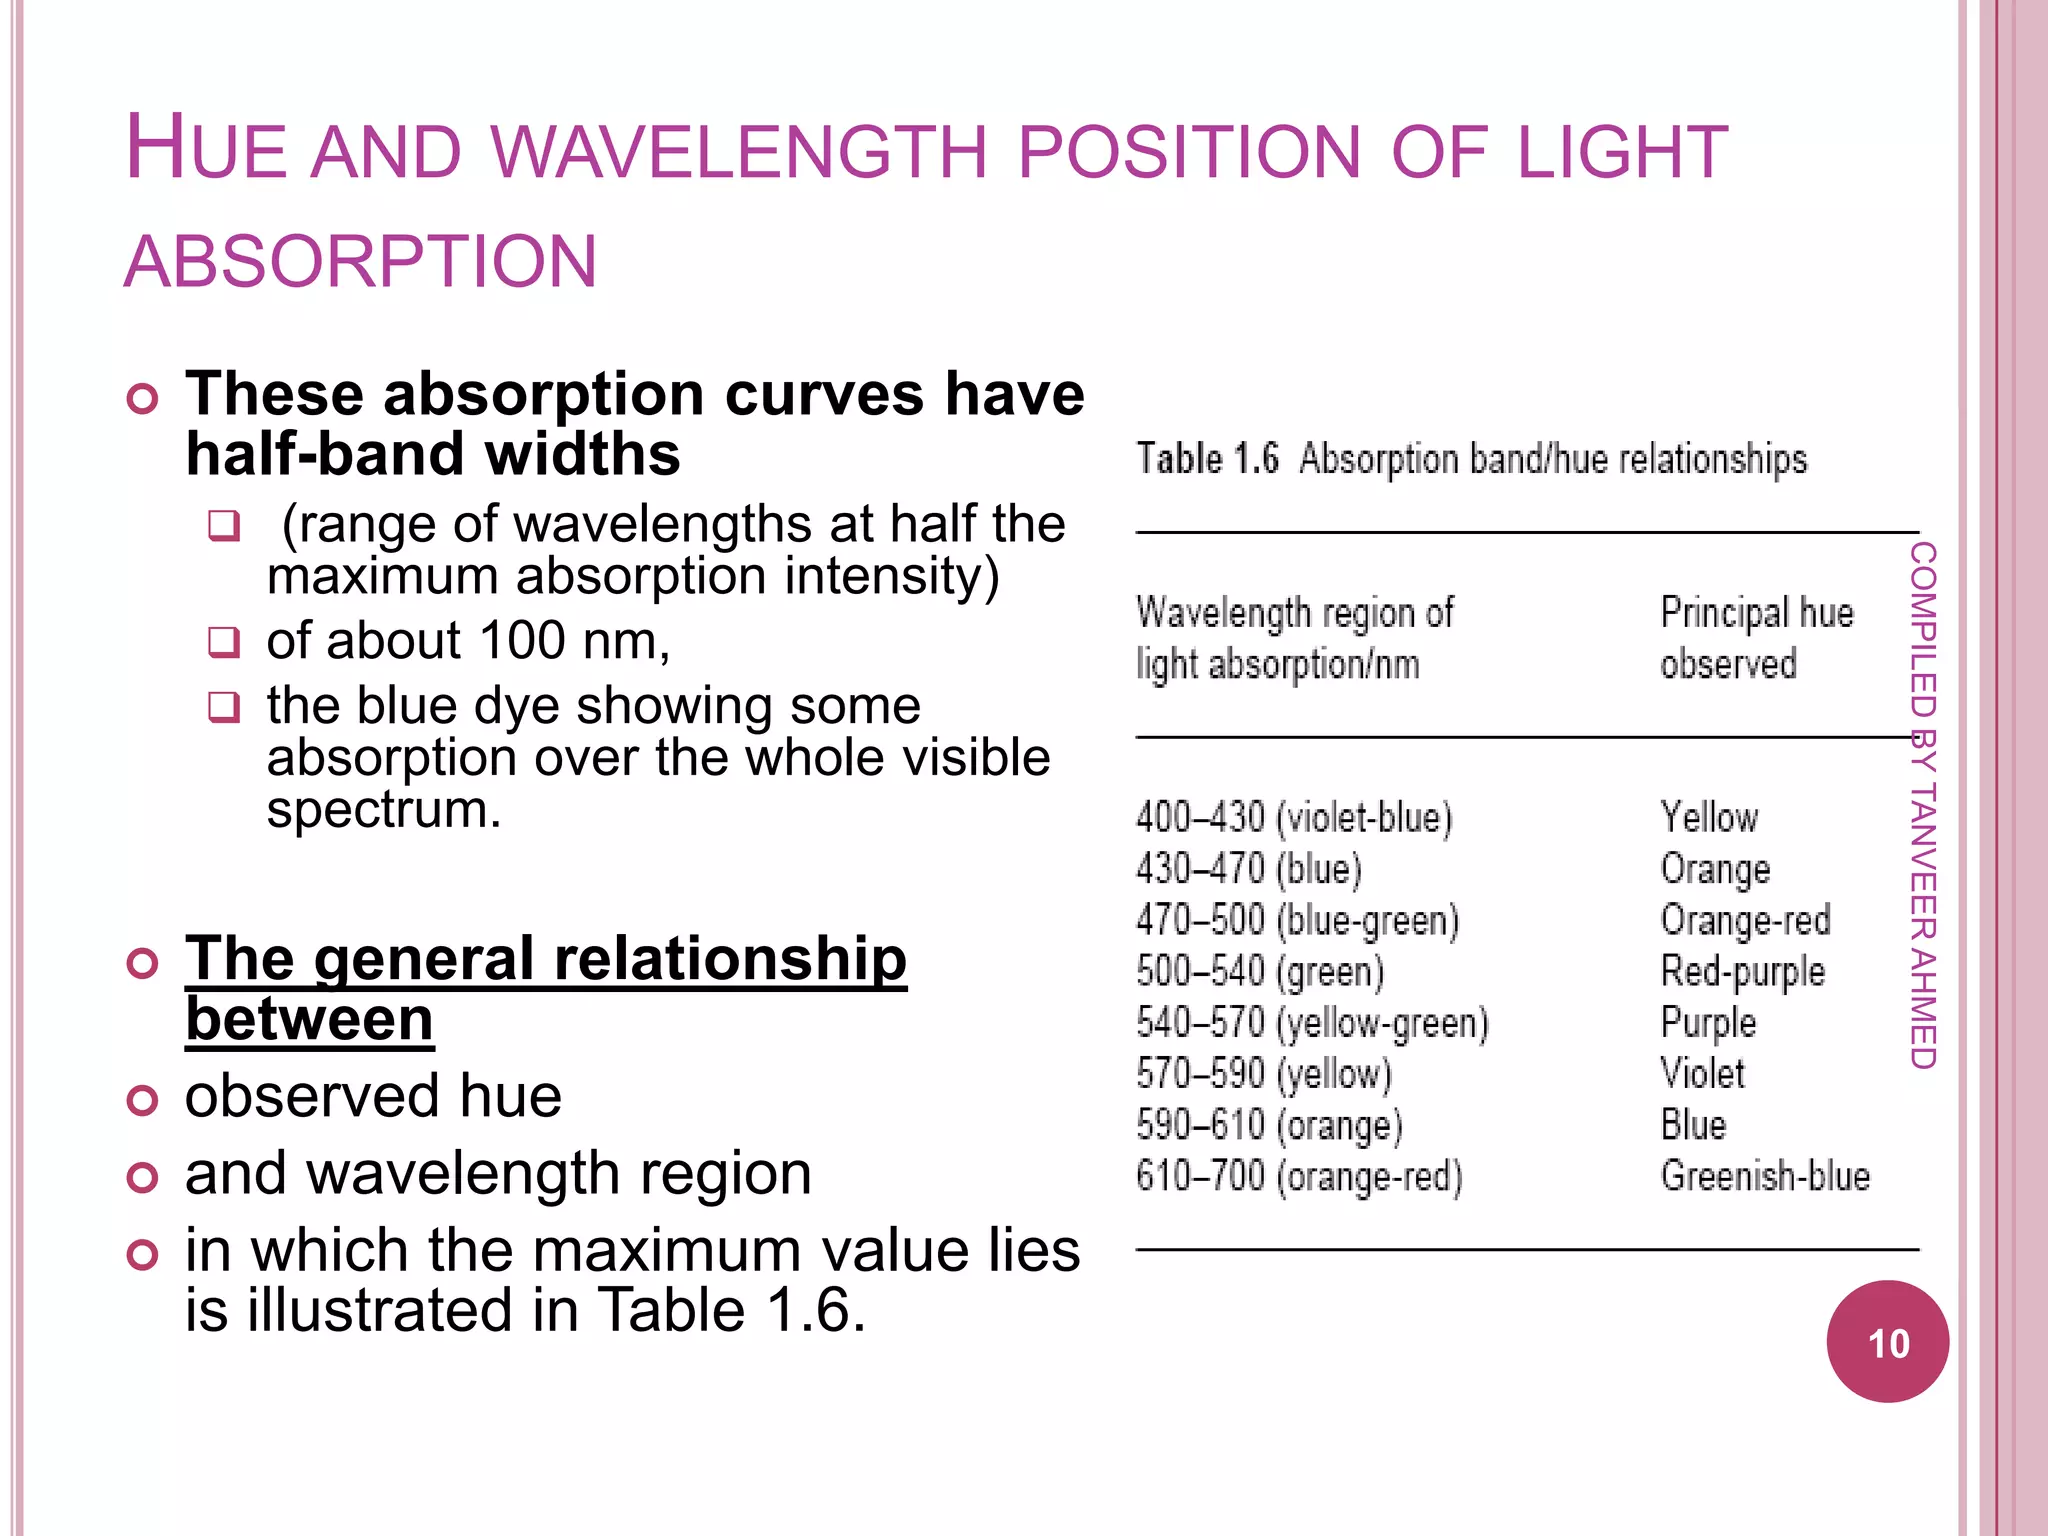
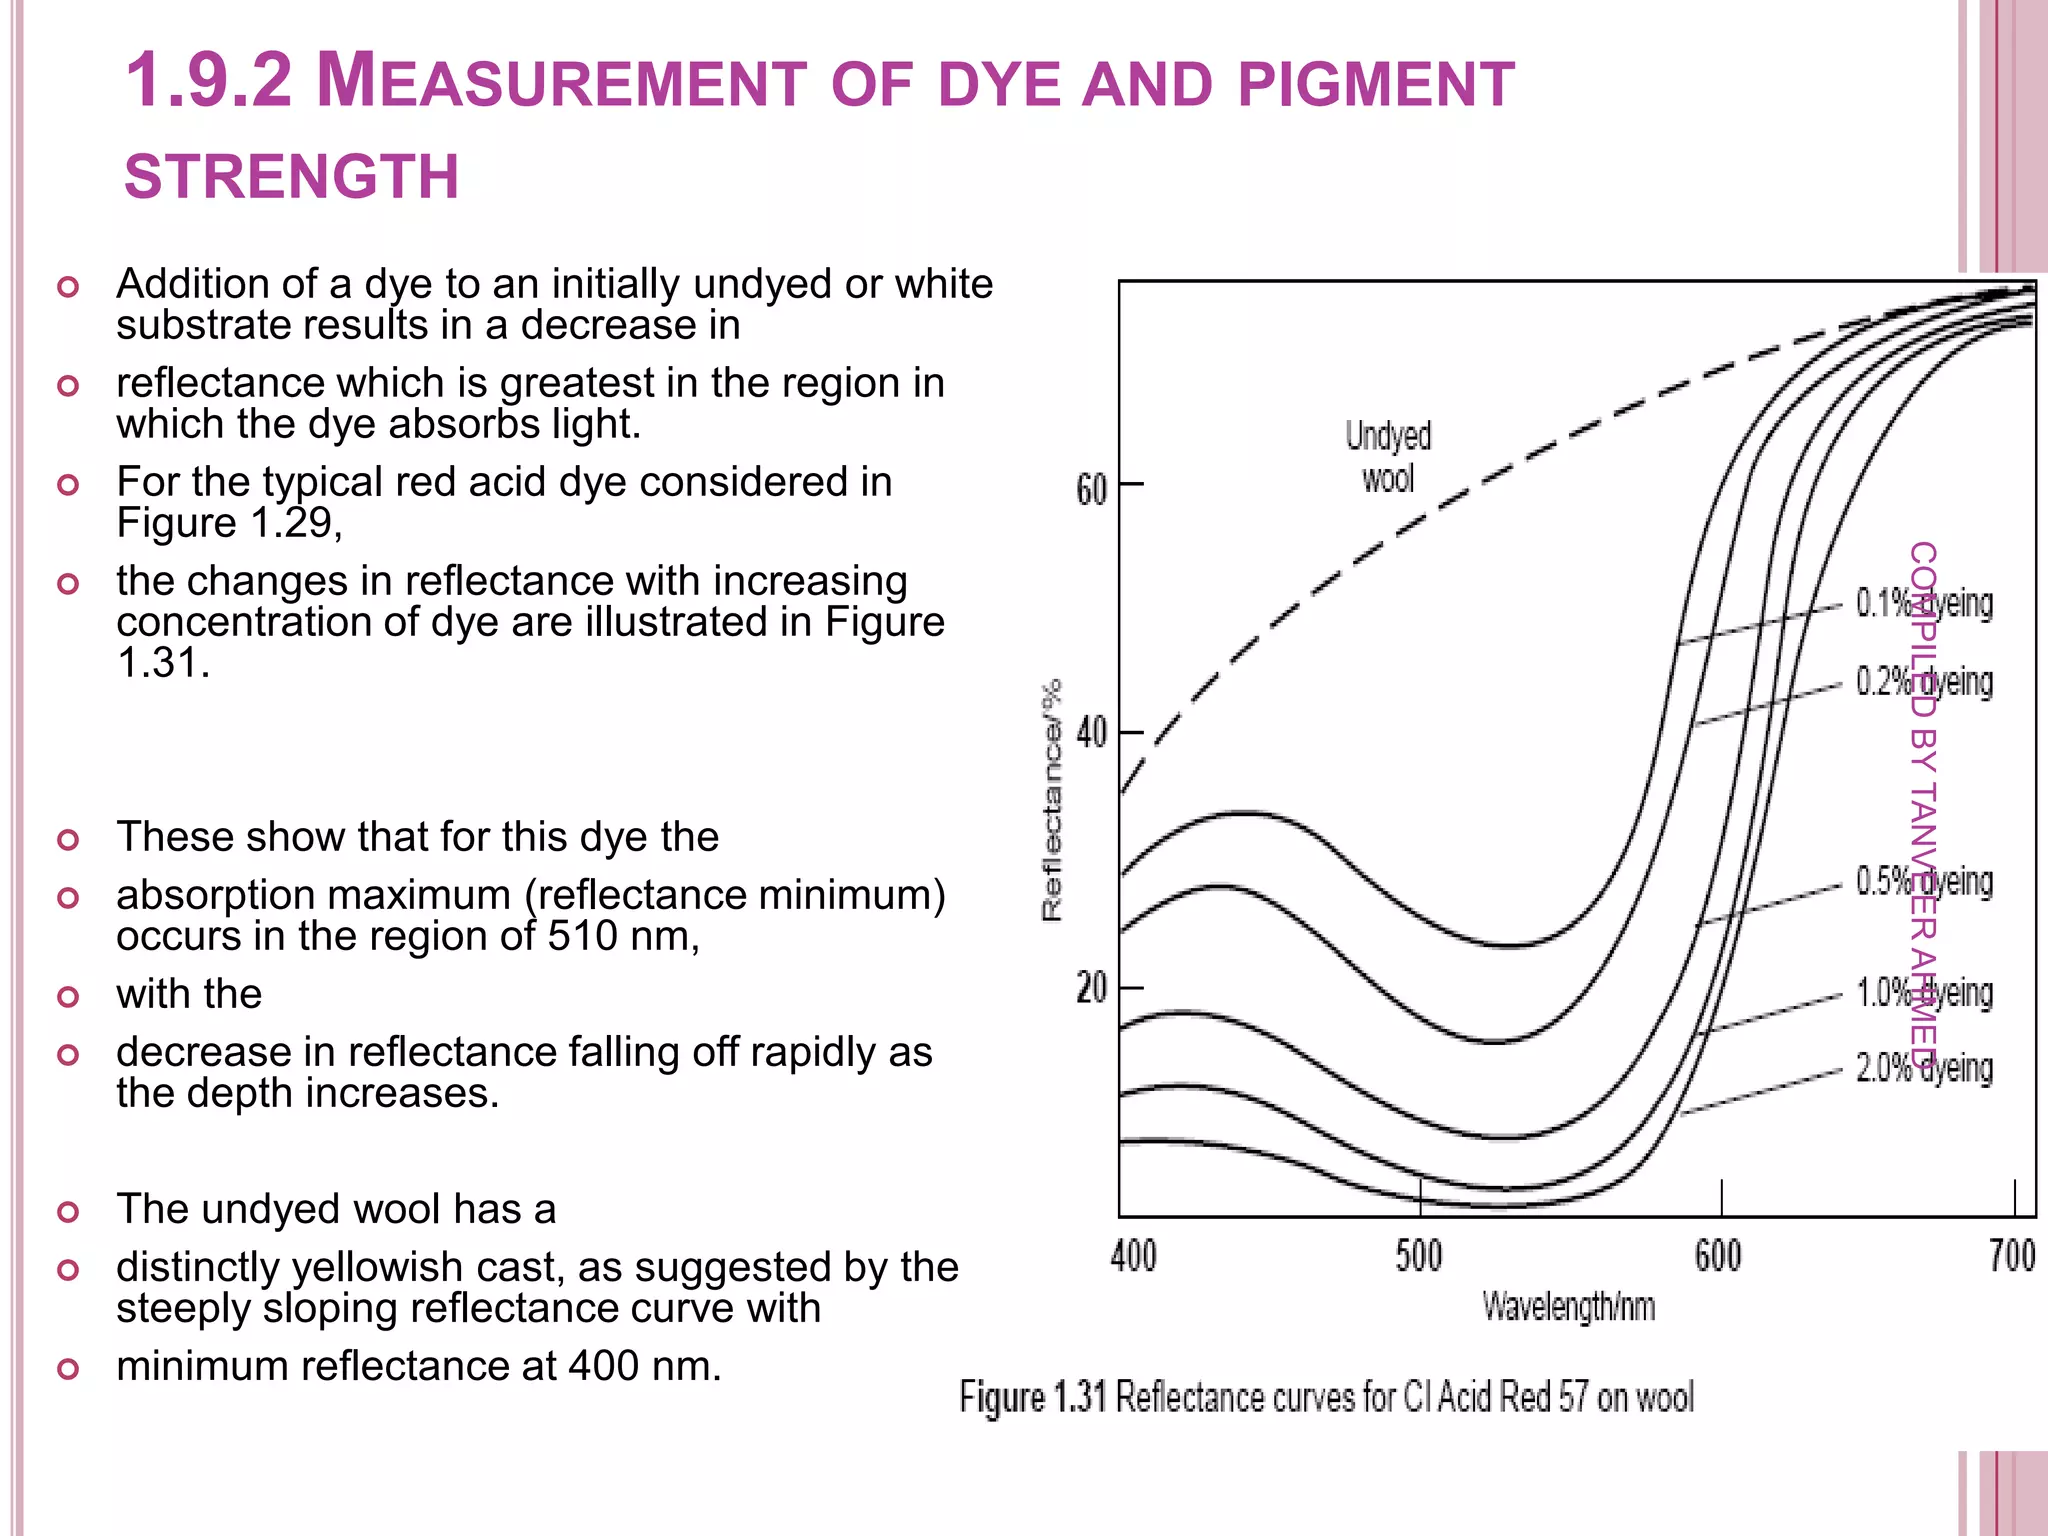
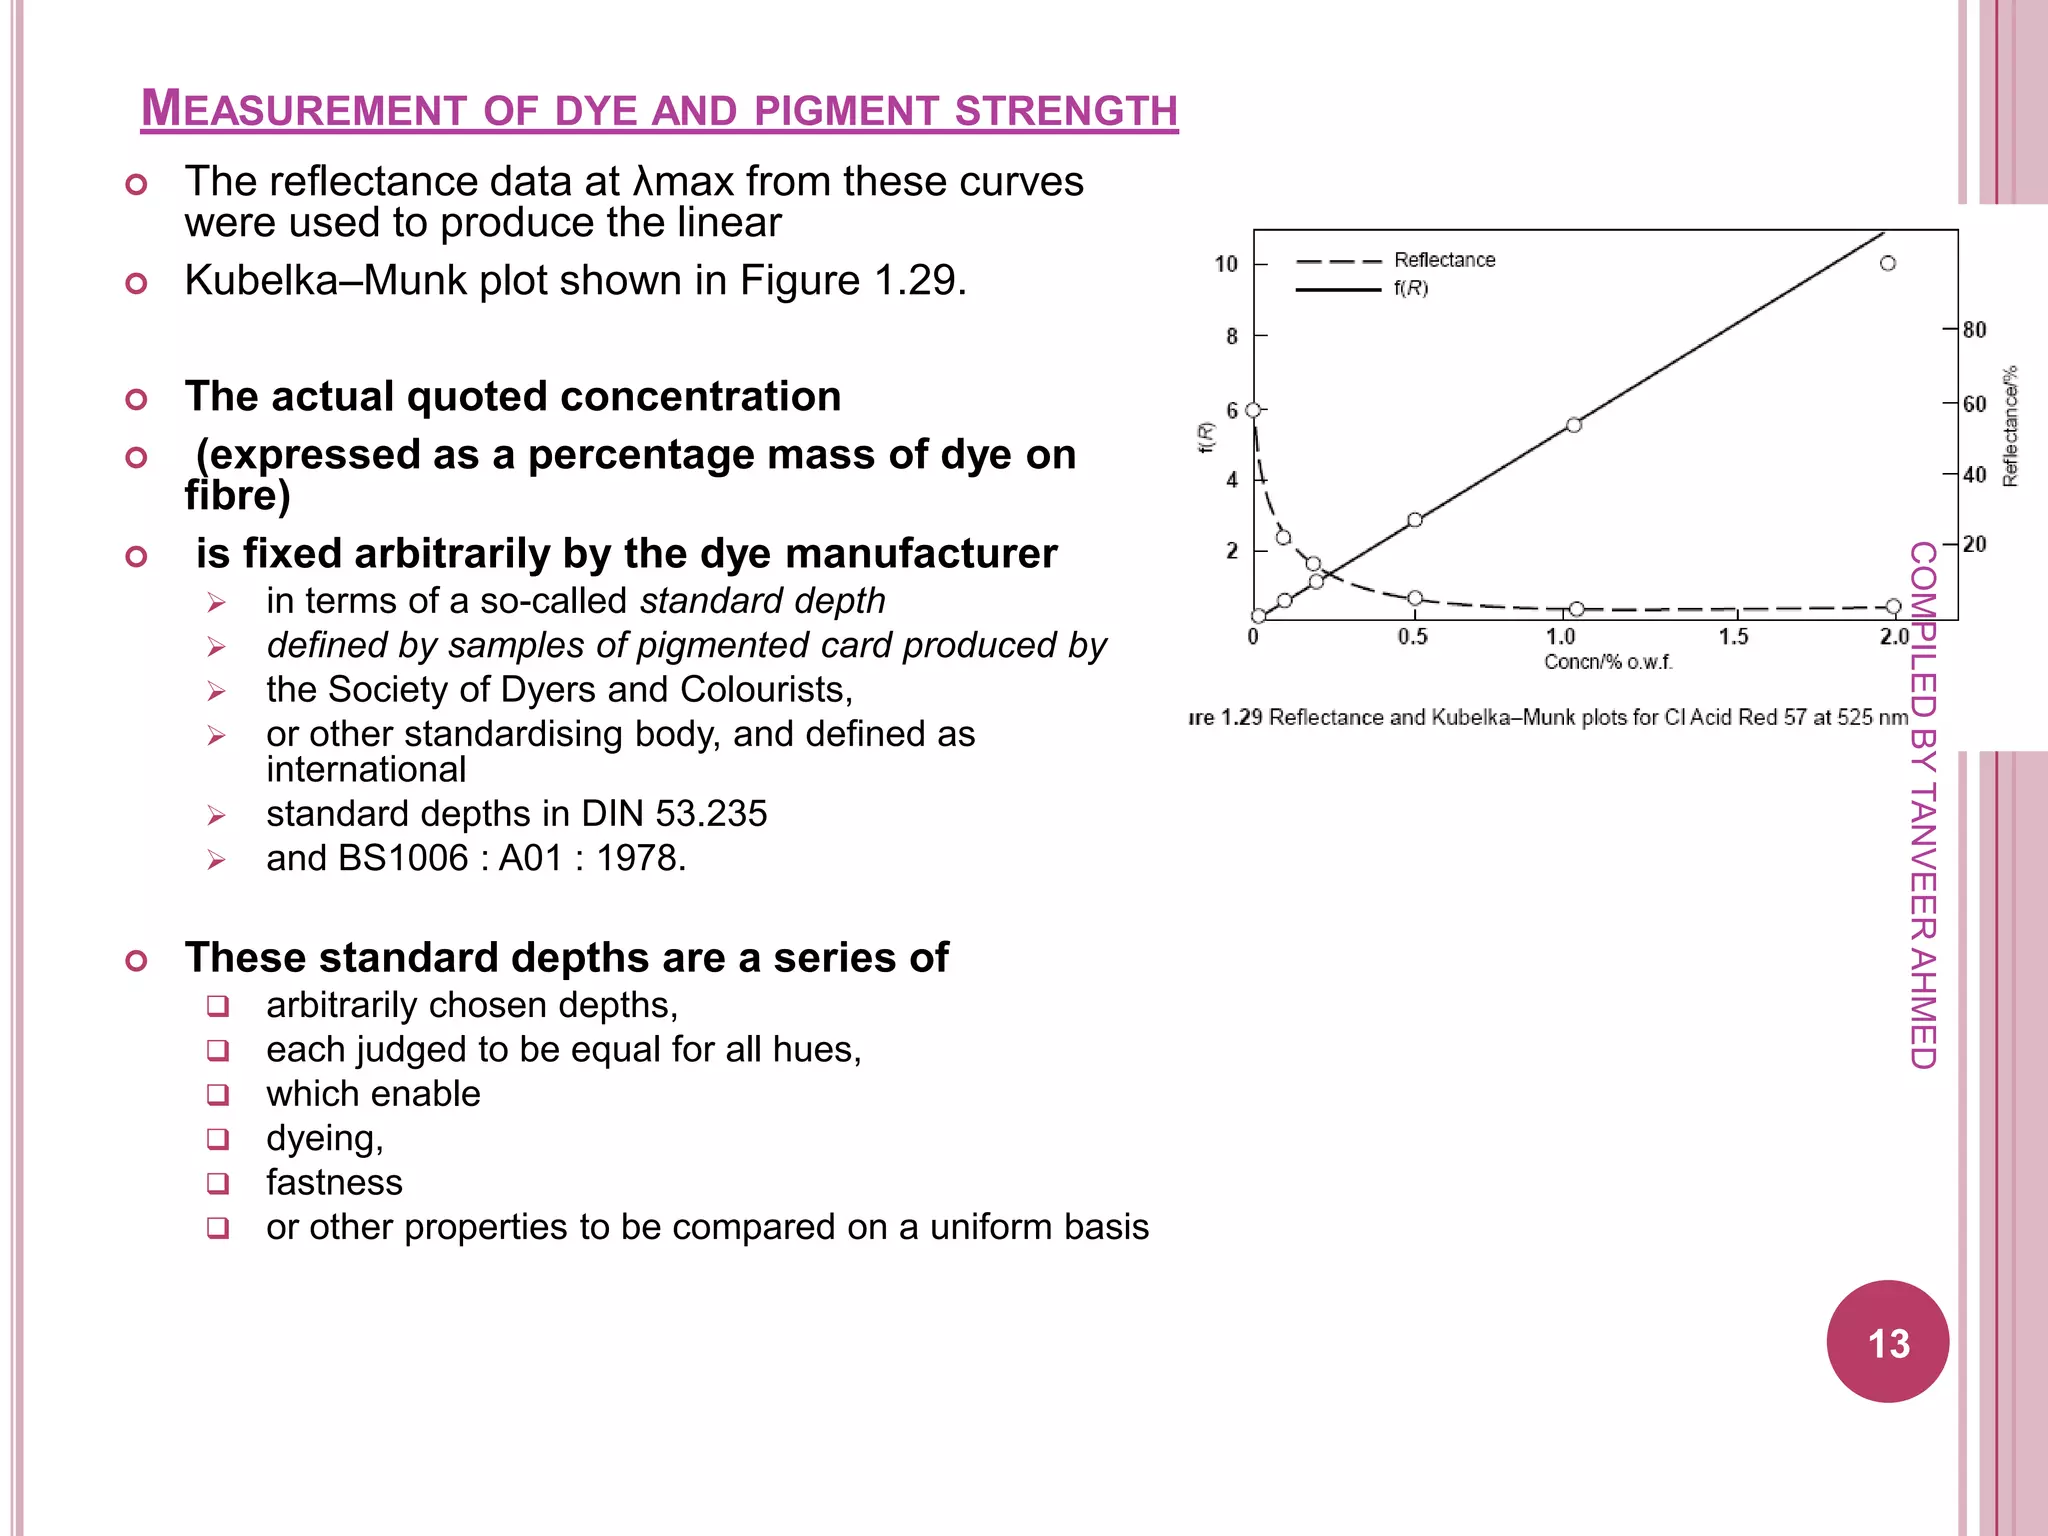
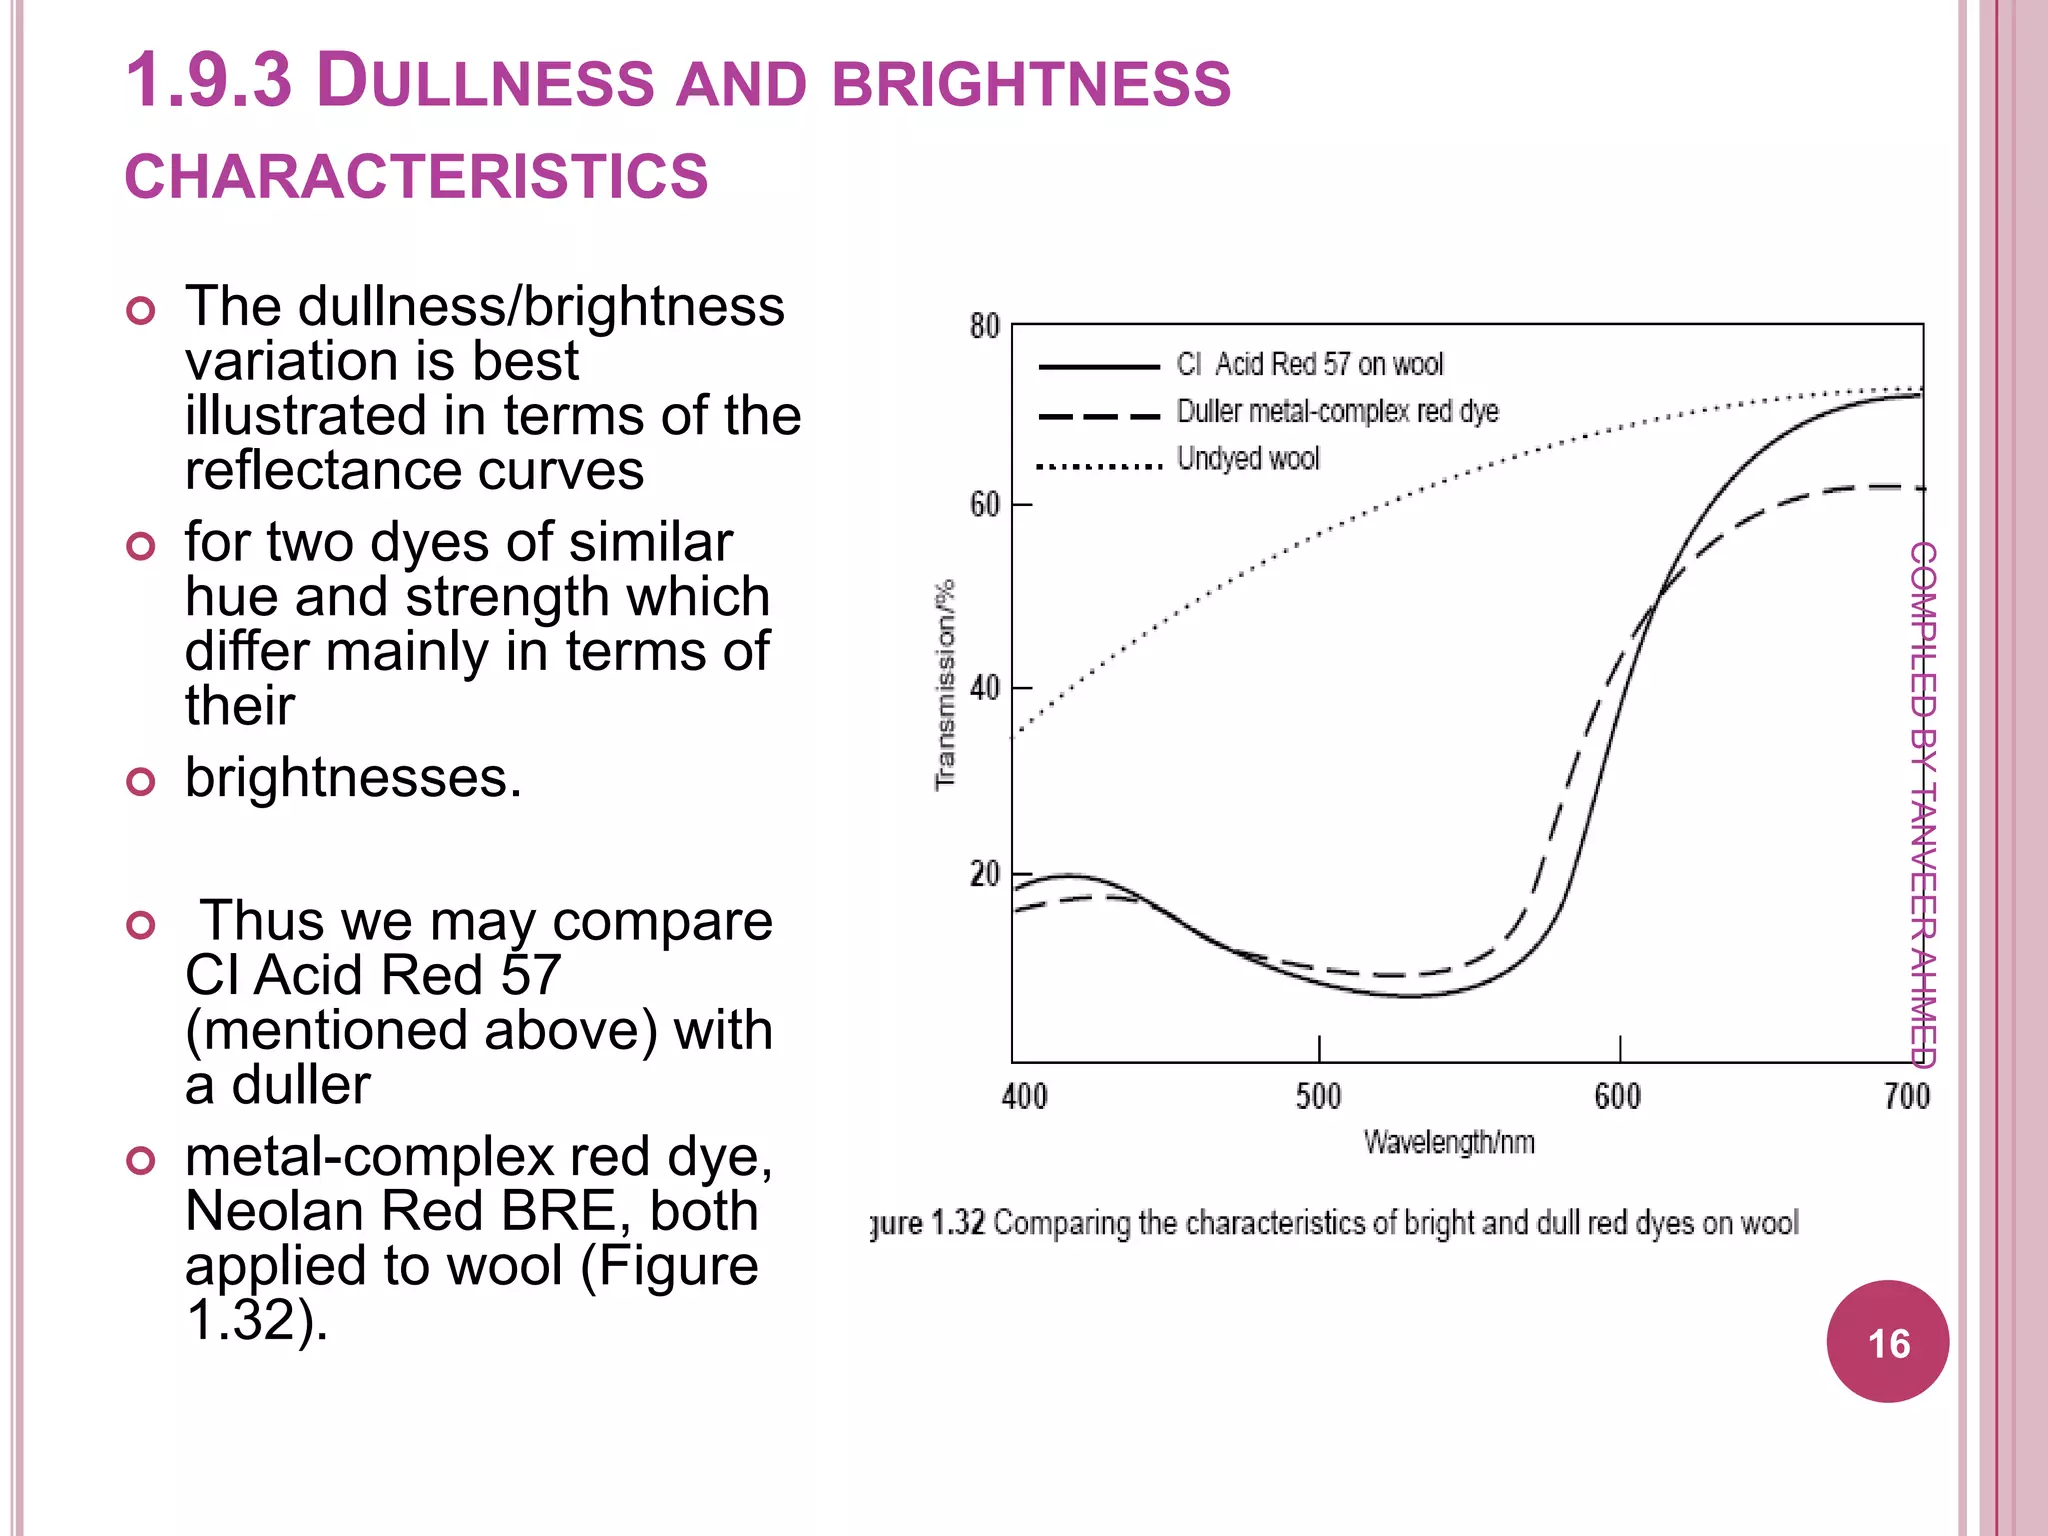
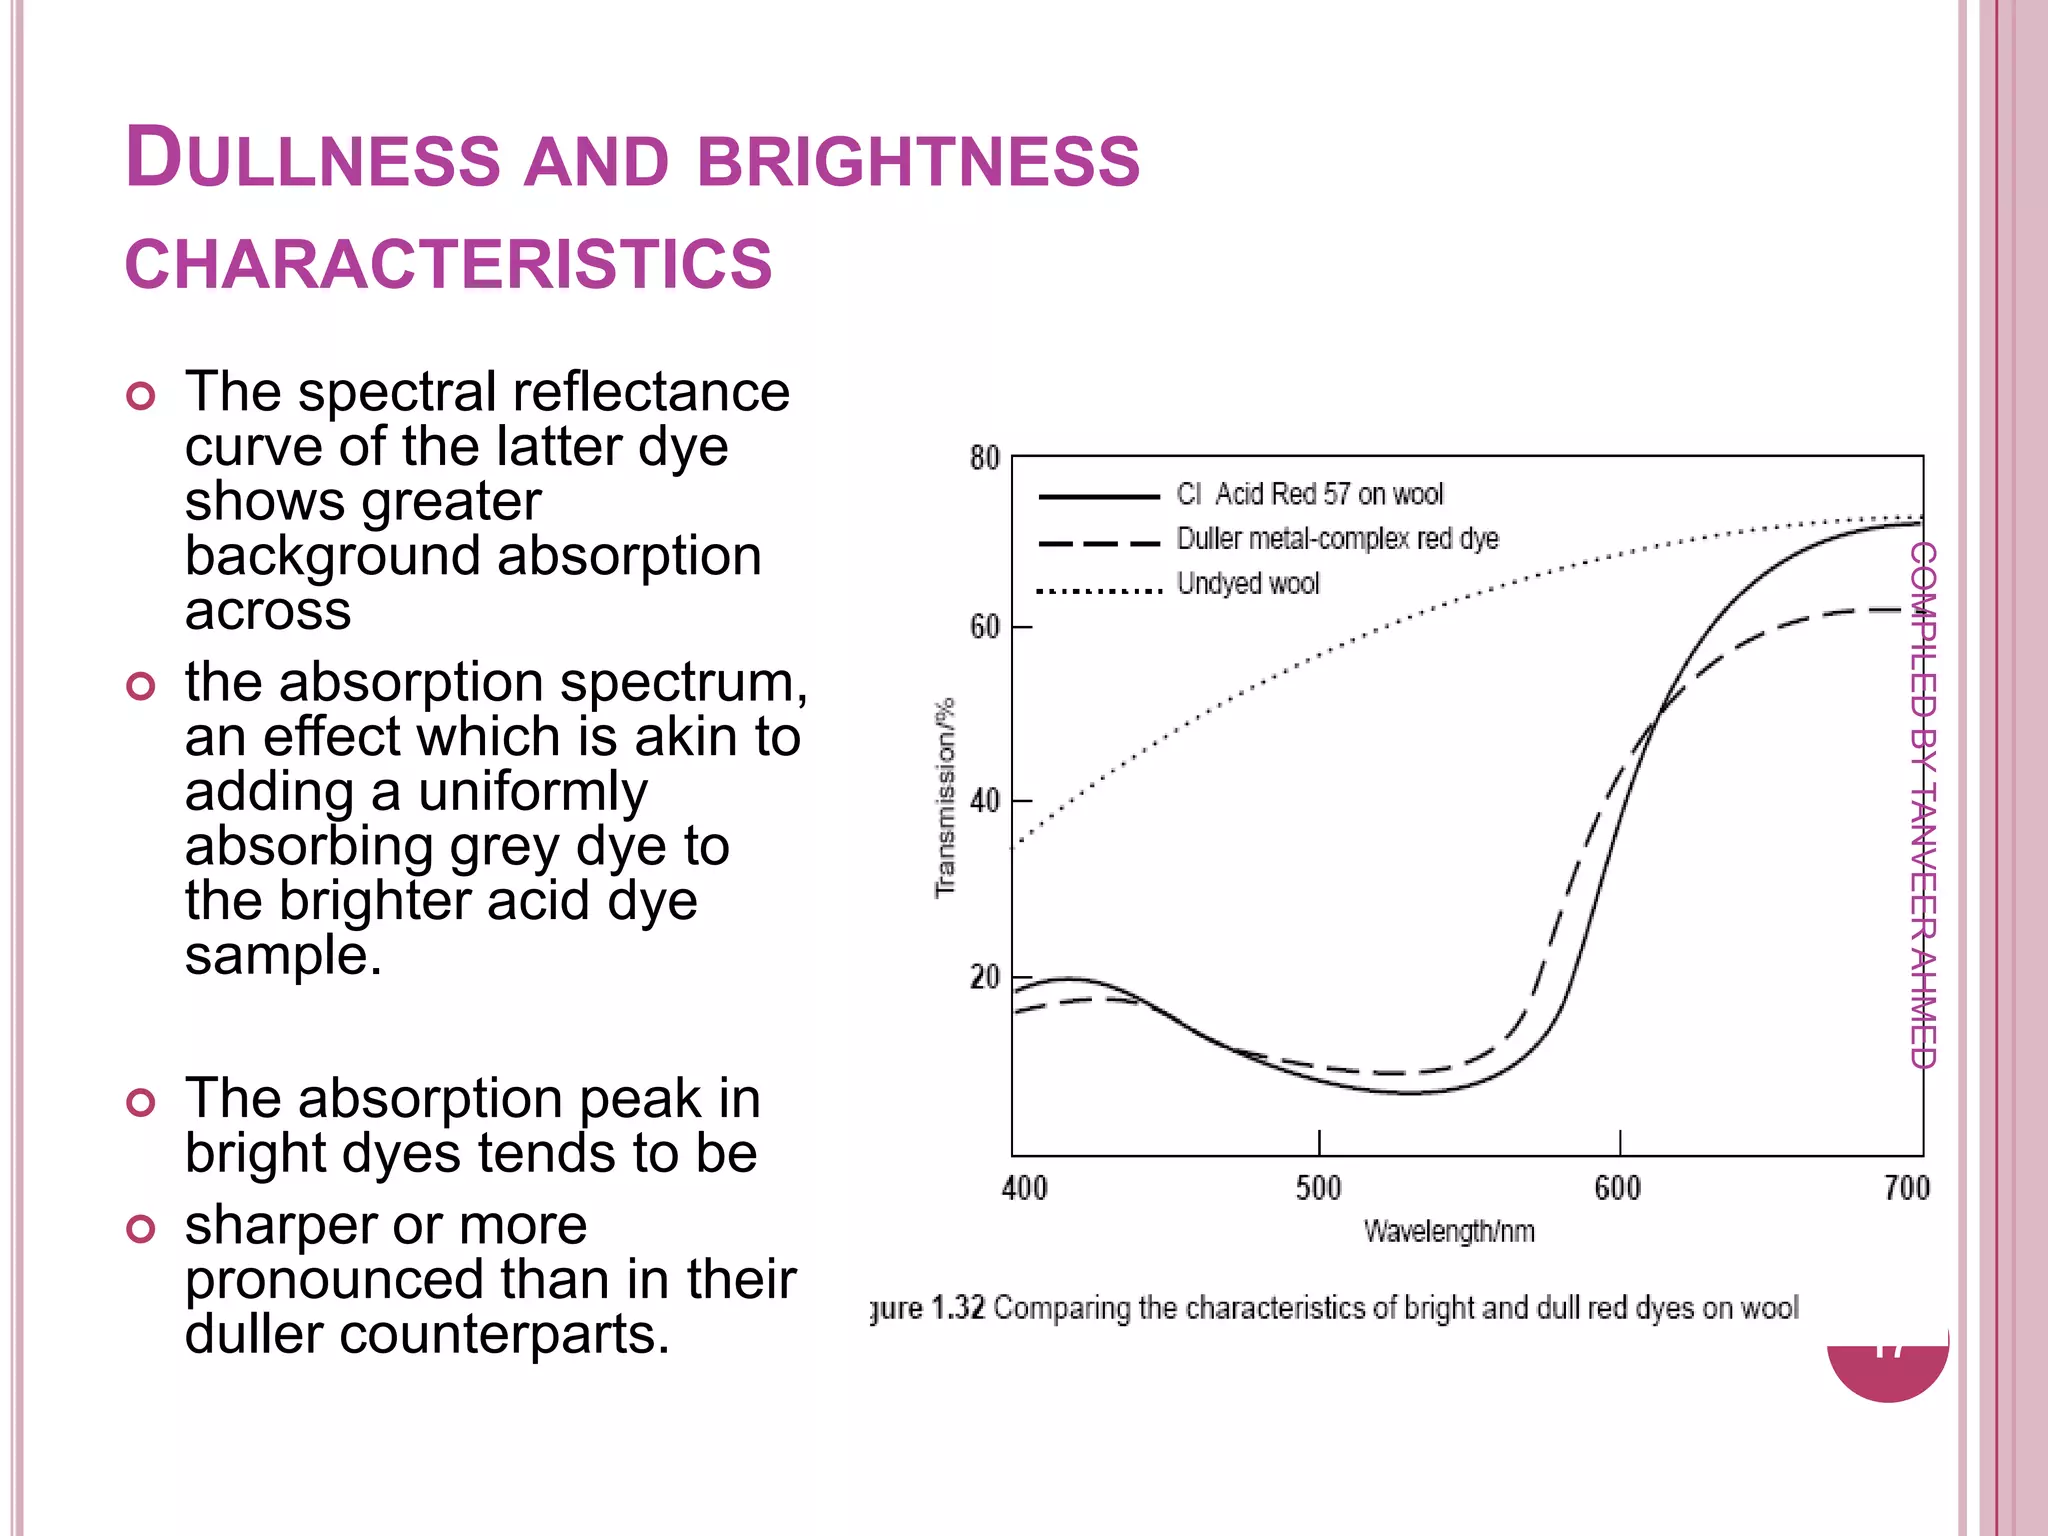
TABLE OF CONTENTS
    1.   1.9 LIGHT ABSORPTION, REFLECTION AND
         COLOUR


    2.   colour technologists in terms of three visual
         characteristics:


                                                           COMPILED BY TANVEER AHMED
    3.   Hue and wavelength position of light absorption
    4.
         1.9.2 Measurement of dye and pigment strength


    5.   1.9.3 Dullness and brightness characteristics

1
1.9 LIGHT ABSORPTION,
    REFLECTION AND COLOUR
     As we have seen, colour arises in dyed or pigmented material
     as a result of the
     Selective absorption of radiation
     within the visible region


                                                                    COMPILED BY TANVEER AHMED
     of the electromagnetic spectrum.


     It has long been recognised that a relation exists between
     the hue of a coloured sample
     and the wavelength regions
     over which light absorption is strong,


     although the colour is actually determined (at least under
2    normal conditions of illumination and viewing)
     mainly by the
     spectral energy distribution of the
     radiation reflected from the coloured opaque sample.
COLOUR TECHNOLOGISTS IN TERMS OF THREE
VISUAL CHARACTERISTICS:


 (a) hue
 (b) strength or depth


                                                             COMPILED BY TANVEER AHMED
 (c) brightness or dullness.


 The most recent edition of Colour terms and
  definitions, published by the
 Society of Dyers and Colourists, gives the following
  definitions

                                                         3
TERMS AND DEFINITIONS

                hue:
                that attribute of colour whereby it is


                                                              COMPILED BY TANVEER AHMED
                 recognised as being predominantly
                        red,
                       green,
                        blue,
                       yellow,
                       violet,
                       brown, etc.


                                                          4
TERMS AND DEFINITIONS

                strength (of a dye):
                the colour yield of a given quantity


                                                            COMPILED BY TANVEER AHMED
                 of dye
                in relation to an

                arbitrarily chosen standard;

                (of a dyeing or print) synonymous
                 with depth


                                                        5
TERMS AND DEFINITIONS

                depth:
                that colour quality


                                                           COMPILED BY TANVEER AHMED
                an increase in

                which is associated with

                an increase in

                the quantity of colorant present,


                  all other conditions (such as
                   viewing conditions, for instance)
                   remaining the same
                                                       6
TERMS AND DEFINITIONS

                            dullness (of a colour):
                            that colour quality


                                                                   COMPILED BY TANVEER AHMED
                            an increase of which is comparable
                             to the
                            effect of the addition

                            of a small quantity of neutral grey
                             colorant,

                            whereby a
                            match cannot be made by
                             adjusting the strength            7

brightness: the converse of dullness.
1.9.1 HUE AND WAVELENGTH
    POSITION OF LIGHT ABSORPTION
    Basing measurements on the Beer–Lambert law as
    discussed in section 1.8.4,


                                                        COMPILED BY TANVEER AHMED
    Figure 1.30 shows the variation of the absorption
    coefficients in solution of three acid dyes of
    different hue,


    compared with the corresponding Kubelka–Munk
    coefficients (Kd/Sf)

8
    derived from reflectance measurements of wool
    material dyed with the same three dyes
HUE AND WAVELENGTH POSITION OF LIGHT ABSORPTION
    The solution absorption curves are surprisingly similar to the absorption curves
    derived from the Kubelka–Munk analysis.
    (Such close similarity may not always be found.)
    The yellow dye absorbs over the near-UV

    and blue wavelength regions of the
    visible region with a maximum absorption λmax near 400 nm,


                                                                                              COMPILED BY TANVEER AHMED
    the red dye absorbs in the
    green region (λmax about 510 nm) and the blue dye absorbs in the orange-red region
    with λmax about 610 nm.


                                                                                          9
HUE AND WAVELENGTH POSITION OF LIGHT
ABSORPTION
   These absorption curves have
    half-band widths
      (range of wavelengths at half the


                                            COMPILED BY TANVEER AHMED
      maximum absorption intensity)
     of about 100 nm,
     the blue dye showing some
      absorption over the whole visible
      spectrum.

   The general relationship
    between
   observed hue
   and wavelength region
   in which the maximum value lies
    is illustrated in Table 1.6.           10
POSITION OF LIGHT ABSORPTION
   The precise hue description will depend
           mainly on the
           wavelength position of the absorption band
           and partly on the
           band width and the overall shape of the absorption curve,
           but also on the observer’s personal interpretation of the meaning


                                                                                 COMPILED BY TANVEER AHMED
            of the hue terms used.


   Moreover, the wavelength ranges and associated
    hue descriptions given elsewhere
   may vary from that given in Table 1.6

   (in section 1.2.1 we noted that the
       ‘true’ hues of blue, green and yellow have been observed to
        occur
       with monochromatic lights of wavelengths
        436, 517 and 577 nm respectively
       and strictly these should lie                                           11
       near the middle of the appropriate radiation hue regions).
1.9.2 MEASUREMENT OF DYE AND PIGMENT
    STRENGTH
   Addition of a dye to an initially undyed or white
    substrate results in a decrease in
   reflectance which is greatest in the region in
    which the dye absorbs light.
   For the typical red acid dye considered in
    Figure 1.29,


                                                         COMPILED BY TANVEER AHMED
   the changes in reflectance with increasing
    concentration of dye are illustrated in Figure
    1.31.


   These show that for this dye the
   absorption maximum (reflectance minimum)
    occurs in the region of 510 nm,
   with the
   decrease in reflectance falling off rapidly as
    the depth increases.

   The undyed wool has a
   distinctly yellowish cast, as suggested by the
    steeply sloping reflectance curve with
                                                        12
   minimum reflectance at 400 nm.
MEASUREMENT OF DYE AND PIGMENT STRENGTH
   The reflectance data at λmax from these curves
    were used to produce the linear
   Kubelka–Munk plot shown in Figure 1.29.

   The actual quoted concentration
    (expressed as a percentage mass of dye on
    fibre)
     is fixed arbitrarily by the dye manufacturer


                                                                  COMPILED BY TANVEER AHMED

        in terms of a so-called standard depth
        defined by samples of pigmented card produced by
        the Society of Dyers and Colourists,
        or other standardising body, and defined as
         international
        standard depths in DIN 53.235
        and BS1006 : A01 : 1978.

   These standard depths are a series of
        arbitrarily chosen depths,
        each judged to be equal for all hues,
        which enable
        dyeing,
        fastness
        or other properties to be compared on a uniform basis


                                                                 13
MEASUREMENT OF DYE AND PIGMENT
STRENGTH
   Once the standard depth of a particular dye (or pigment)
    has been defined,
          relative strength measurements


                                                                                       COMPILED BY TANVEER AHMED
          on subsequent batches are evaluated
          by preparing the dyed or pigmented sample
          under defined dyeing or application conditions,

          and testing strength variations such as 80, 90, 100, 110 and 120% for the
           sample being assessed.


    The resulting strength series of the sample colorant is
    then
          compared visually in a colourmatching booth
           with the standard sample (prepared simultaneously)
          accepted as being                                                      14
          representative of the 100% strength of the colorant.
MEASUREMENT OF DYE AND PIGMENT STRENGTH
   In many cases dye manufacturers have gradually
    replaced
           the dyeing test for strength determination
           with solution spectrophotometry
           based on a simple ratio determination
            of the absorbance values at λmax,


                                                                                         COMPILED BY TANVEER AHMED
        

           as expressed implicitly by the Beer–Lambert law.
   The full experimental details of the standard procedures
    for carrying out such solution strength tests have been
    published . Such relative strength tests based on
       optical measurements on the dye solutions
   are, however, valid only if the chemical composition of
    the dye can be
           consistently reproduced,
            and hence if the dye can be produced with reproducible affinity or uptake
            characteristics on the appropriate fibres
           and a reproducible absorption spectrum in solution.
                                                                                    15
1.9.3 DULLNESS AND BRIGHTNESS
CHARACTERISTICS

   The dullness/brightness
    variation is best
    illustrated in terms of the
    reflectance curves
   for two dyes of similar


                                   COMPILED BY TANVEER AHMED
    hue and strength which
    differ mainly in terms of
    their
   brightnesses.

    Thus we may compare
    CI Acid Red 57
    (mentioned above) with
    a duller
   metal-complex red dye,
    Neolan Red BRE, both
    applied to wool (Figure
    1.32).                        16
DULLNESS AND BRIGHTNESS
CHARACTERISTICS
   The spectral reflectance
    curve of the latter dye
    shows greater
    background absorption


                                  COMPILED BY TANVEER AHMED
    across
   the absorption spectrum,
    an effect which is akin to
    adding a uniformly
    absorbing grey dye to
    the brighter acid dye
    sample.

   The absorption peak in
    bright dyes tends to be
   sharper or more
    pronounced than in their
    duller counterparts.         17

1.9 light absorption, reflection and colour

  • 1.
    TABLE OF CONTENTS 1. 1.9 LIGHT ABSORPTION, REFLECTION AND COLOUR 2. colour technologists in terms of three visual characteristics: COMPILED BY TANVEER AHMED 3. Hue and wavelength position of light absorption 4. 1.9.2 Measurement of dye and pigment strength 5. 1.9.3 Dullness and brightness characteristics 1
  • 2.
    1.9 LIGHT ABSORPTION, REFLECTION AND COLOUR As we have seen, colour arises in dyed or pigmented material as a result of the Selective absorption of radiation within the visible region COMPILED BY TANVEER AHMED of the electromagnetic spectrum. It has long been recognised that a relation exists between the hue of a coloured sample and the wavelength regions over which light absorption is strong, although the colour is actually determined (at least under 2 normal conditions of illumination and viewing) mainly by the spectral energy distribution of the radiation reflected from the coloured opaque sample.
  • 3.
    COLOUR TECHNOLOGISTS INTERMS OF THREE VISUAL CHARACTERISTICS:  (a) hue  (b) strength or depth COMPILED BY TANVEER AHMED  (c) brightness or dullness.  The most recent edition of Colour terms and definitions, published by the  Society of Dyers and Colourists, gives the following definitions 3
  • 4.
    TERMS AND DEFINITIONS  hue:  that attribute of colour whereby it is COMPILED BY TANVEER AHMED recognised as being predominantly  red,  green,  blue,  yellow,  violet,  brown, etc. 4
  • 5.
    TERMS AND DEFINITIONS  strength (of a dye):  the colour yield of a given quantity COMPILED BY TANVEER AHMED of dye  in relation to an  arbitrarily chosen standard;  (of a dyeing or print) synonymous with depth 5
  • 6.
    TERMS AND DEFINITIONS  depth:  that colour quality COMPILED BY TANVEER AHMED  an increase in  which is associated with  an increase in  the quantity of colorant present,  all other conditions (such as viewing conditions, for instance) remaining the same 6
  • 7.
    TERMS AND DEFINITIONS  dullness (of a colour):  that colour quality COMPILED BY TANVEER AHMED  an increase of which is comparable to the  effect of the addition  of a small quantity of neutral grey colorant,  whereby a  match cannot be made by adjusting the strength 7 brightness: the converse of dullness.
  • 8.
    1.9.1 HUE ANDWAVELENGTH POSITION OF LIGHT ABSORPTION Basing measurements on the Beer–Lambert law as discussed in section 1.8.4, COMPILED BY TANVEER AHMED Figure 1.30 shows the variation of the absorption coefficients in solution of three acid dyes of different hue, compared with the corresponding Kubelka–Munk coefficients (Kd/Sf) 8 derived from reflectance measurements of wool material dyed with the same three dyes
  • 9.
    HUE AND WAVELENGTHPOSITION OF LIGHT ABSORPTION  The solution absorption curves are surprisingly similar to the absorption curves  derived from the Kubelka–Munk analysis.  (Such close similarity may not always be found.)  The yellow dye absorbs over the near-UV  and blue wavelength regions of the  visible region with a maximum absorption λmax near 400 nm, COMPILED BY TANVEER AHMED  the red dye absorbs in the  green region (λmax about 510 nm) and the blue dye absorbs in the orange-red region  with λmax about 610 nm. 9
  • 10.
    HUE AND WAVELENGTHPOSITION OF LIGHT ABSORPTION  These absorption curves have half-band widths  (range of wavelengths at half the COMPILED BY TANVEER AHMED maximum absorption intensity)  of about 100 nm,  the blue dye showing some absorption over the whole visible spectrum.  The general relationship between  observed hue  and wavelength region  in which the maximum value lies is illustrated in Table 1.6. 10
  • 11.
    POSITION OF LIGHTABSORPTION  The precise hue description will depend  mainly on the  wavelength position of the absorption band  and partly on the  band width and the overall shape of the absorption curve,  but also on the observer’s personal interpretation of the meaning COMPILED BY TANVEER AHMED of the hue terms used.  Moreover, the wavelength ranges and associated hue descriptions given elsewhere  may vary from that given in Table 1.6  (in section 1.2.1 we noted that the  ‘true’ hues of blue, green and yellow have been observed to occur  with monochromatic lights of wavelengths  436, 517 and 577 nm respectively  and strictly these should lie 11  near the middle of the appropriate radiation hue regions).
  • 12.
    1.9.2 MEASUREMENT OFDYE AND PIGMENT STRENGTH  Addition of a dye to an initially undyed or white substrate results in a decrease in  reflectance which is greatest in the region in which the dye absorbs light.  For the typical red acid dye considered in Figure 1.29, COMPILED BY TANVEER AHMED  the changes in reflectance with increasing concentration of dye are illustrated in Figure 1.31.  These show that for this dye the  absorption maximum (reflectance minimum) occurs in the region of 510 nm,  with the  decrease in reflectance falling off rapidly as the depth increases.  The undyed wool has a  distinctly yellowish cast, as suggested by the steeply sloping reflectance curve with 12  minimum reflectance at 400 nm.
  • 13.
    MEASUREMENT OF DYEAND PIGMENT STRENGTH  The reflectance data at λmax from these curves were used to produce the linear  Kubelka–Munk plot shown in Figure 1.29.  The actual quoted concentration  (expressed as a percentage mass of dye on fibre) is fixed arbitrarily by the dye manufacturer COMPILED BY TANVEER AHMED   in terms of a so-called standard depth  defined by samples of pigmented card produced by  the Society of Dyers and Colourists,  or other standardising body, and defined as international  standard depths in DIN 53.235  and BS1006 : A01 : 1978.  These standard depths are a series of  arbitrarily chosen depths,  each judged to be equal for all hues,  which enable  dyeing,  fastness  or other properties to be compared on a uniform basis 13
  • 14.
    MEASUREMENT OF DYEAND PIGMENT STRENGTH  Once the standard depth of a particular dye (or pigment) has been defined,  relative strength measurements COMPILED BY TANVEER AHMED  on subsequent batches are evaluated  by preparing the dyed or pigmented sample  under defined dyeing or application conditions,  and testing strength variations such as 80, 90, 100, 110 and 120% for the sample being assessed.  The resulting strength series of the sample colorant is then  compared visually in a colourmatching booth  with the standard sample (prepared simultaneously)  accepted as being 14  representative of the 100% strength of the colorant.
  • 15.
    MEASUREMENT OF DYEAND PIGMENT STRENGTH  In many cases dye manufacturers have gradually replaced  the dyeing test for strength determination  with solution spectrophotometry  based on a simple ratio determination of the absorbance values at λmax, COMPILED BY TANVEER AHMED   as expressed implicitly by the Beer–Lambert law.  The full experimental details of the standard procedures for carrying out such solution strength tests have been published . Such relative strength tests based on  optical measurements on the dye solutions  are, however, valid only if the chemical composition of the dye can be  consistently reproduced,  and hence if the dye can be produced with reproducible affinity or uptake characteristics on the appropriate fibres  and a reproducible absorption spectrum in solution. 15
  • 16.
    1.9.3 DULLNESS ANDBRIGHTNESS CHARACTERISTICS  The dullness/brightness variation is best illustrated in terms of the reflectance curves  for two dyes of similar COMPILED BY TANVEER AHMED hue and strength which differ mainly in terms of their  brightnesses.  Thus we may compare CI Acid Red 57 (mentioned above) with a duller  metal-complex red dye, Neolan Red BRE, both applied to wool (Figure 1.32). 16
  • 17.
    DULLNESS AND BRIGHTNESS CHARACTERISTICS  The spectral reflectance curve of the latter dye shows greater background absorption COMPILED BY TANVEER AHMED across  the absorption spectrum, an effect which is akin to adding a uniformly absorbing grey dye to the brighter acid dye sample.  The absorption peak in bright dyes tends to be  sharper or more pronounced than in their duller counterparts. 17