Downloaded 102 times


![U WAVE
• Seen in V2 to V4
• May be from late repolarization of the mid-myocardial M cells
• The amplitude of the U wave is typically less than 0.2 Mv
• Clearly separate from the T wave
• Hypokalemia and bradycardia
• U merge with T wave when the QT interval is prolonged (a QT-U wave)
• Very obvious when the QT or JT interval is shortened [ digoxin or hypercalcemia]](https://image.slidesharecdn.com/normalecg19-8am-180418174858/85/12-LEAD-NORMAL-ELECTROCARDIOGRAM-27-320.jpg)


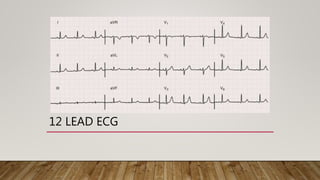
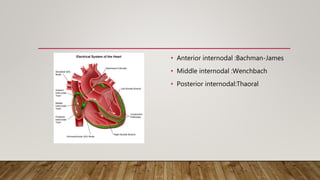
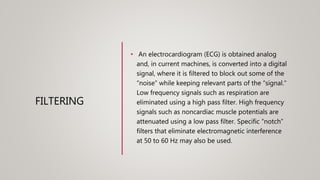
This document provides an overview of normal electrocardiography including: - The history and components of the ECG - Details on electrical conduction pathways and dipoles - Explanation of filtering techniques used to process ECG signals - Description of the 12 standard ECG leads - Identification and measurements of key complexes, intervals, and waves including P, PR, QRS, ST, T, and QT - Normal variations in ECG patterns - Approach to interpreting ECGs by analyzing rate, rhythm, axes, intervals, and overall tracings