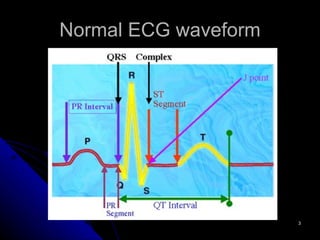
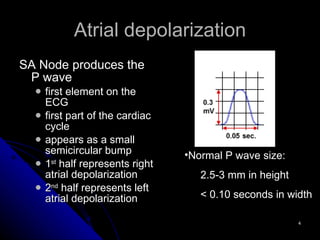
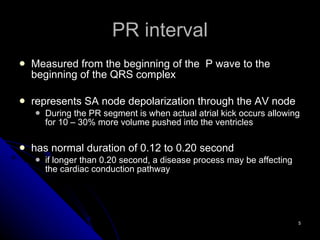
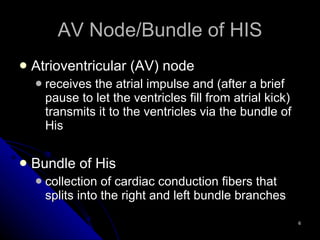
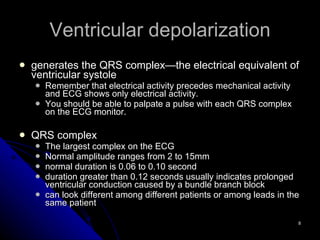
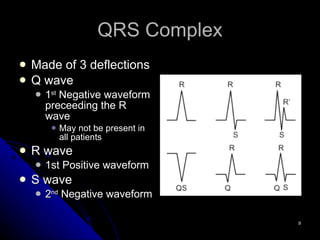
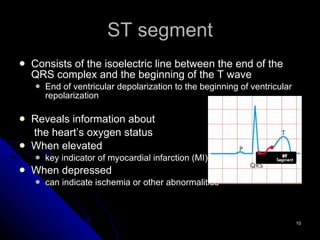
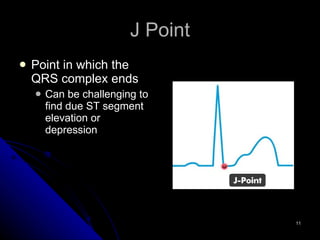
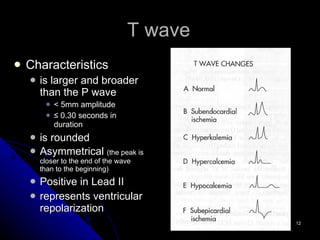
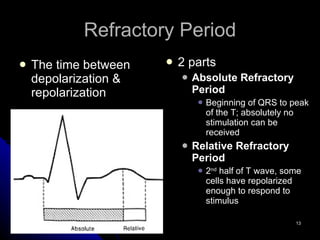
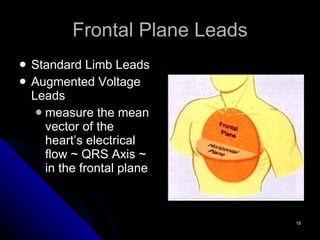
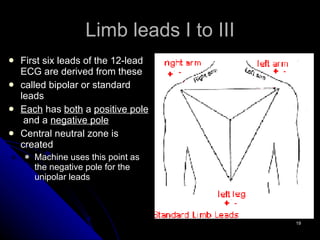
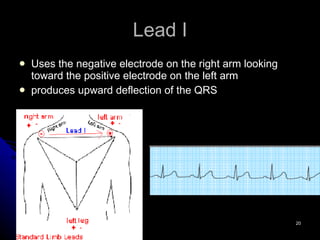
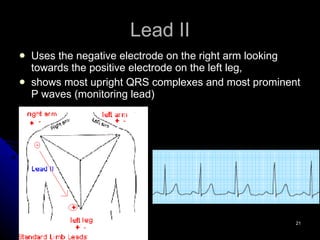
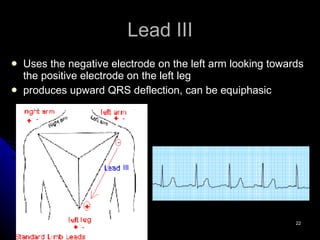
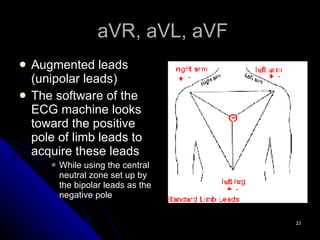
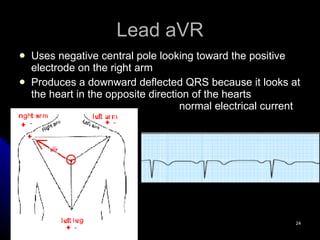
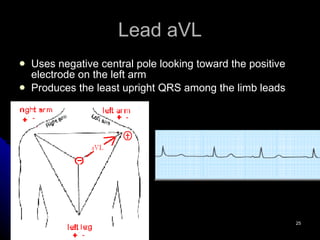
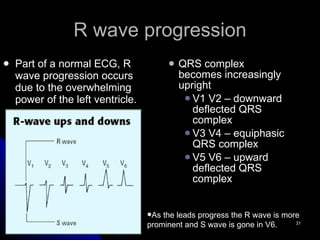
Understanding the    12-lead ECG
The heart’s electrical conduction Electrical activity precedes mechanical activity coordinates all parts of the heart to contract at the same time initiated in the sinoatrial (SA) node specialized group of cells in the right atrium depolarizes at a rate of 60 to 100 times/minute makes the atria contract and propel blood into the ventricles
Normal ECG waveform
Atrial depolarization SA Node produces the P wave first element on the ECG first part of the cardiac cycle appears as a small semicircular bump 1 st  half represents right atrial depolarization 2 nd  half represents left atrial depolarization Normal P wave size: 2.5-3 mm in height < 0.10 seconds in width
PR interval Measured from the beginning of the  P wave to the beginning of the QRS complex represents SA node depolarization through the AV node  During the PR segment is when actual atrial kick occurs allowing for 10 – 30% more volume pushed into the ventricles has normal duration of 0.12 to 0.20 second if longer than 0.20 second, a disease process may be affecting the cardiac conduction pathway
AV Node/Bundle of HIS Atrioventricular (AV) node  receives the atrial impulse and (after a brief pause to let the ventricles fill from atrial kick) transmits it to the ventricles via the bundle of His Bundle of His collection of cardiac conduction fibers that splits into the right and left bundle branches
Bundle branches high-speed conducting fibers that run down the intraventricular septum transmit cardiac impulse to the Purkinje fibers complex network that mingles with ventricular myocardial cells rapidly stimulating ventricular muscle resulting in ventricular depolarization
Ventricular depolarization generates the QRS complex—the electrical equivalent of ventricular systole Remember that electrical activity precedes mechanical activity and ECG shows only electrical activity. You should be able to palpate a pulse with each QRS complex on the ECG monitor. QRS complex The largest complex on the ECG Normal amplitude ranges from 2 to 15mm normal duration is 0.06 to 0.10 second duration greater than 0.12 seconds usually indicates prolonged ventricular conduction caused by a bundle branch block can look different among different patients or among leads in the same patient
QRS Complex Made of 3 deflections Q wave 1 st  Negative waveform preceeding the R wave May not be present in all patients R wave 1st Positive waveform S wave 2 nd  Negative waveform
ST segment Consists of the isoelectric line between the end of the QRS complex and the beginning of the T wave End of ventricular depolarization to the beginning of ventricular repolarization Reveals information about  the heart’s oxygen status When elevated key indicator of myocardial infarction (MI) When depressed  can indicate ischemia or other abnormalities
J Point Point in which the QRS complex ends Can be challenging to find due ST segment elevation or depression
T wave Characteristics is larger and broader than the P wave < 5mm amplitude ≤  0.30 seconds in duration is rounded Asymmetrical  (the peak is closer to the end of the wave than to the beginning) Positive in Lead II represents ventricular repolarization
Refractory Period The time between depolarization & repolarization 2 parts Absolute Refractory Period Beginning of QRS to peak of the T; absolutely no stimulation can be received Relative Refractory Period 2 nd  half of T wave, some cells have repolarized enough to respond to stimulus
QT Interval Measured from beginning of QRS to end of T wave Represents onset of ventricular depolarization through ventricular repolarization QT intervals varies Sex, age, heart rate Should be less than ½ the distance between 2 R waves As the heart rate increases the QT interval  usually decreases As the heart rate decreases the QT interval usually increases
U wave Small, rounded, wave sometimes seen after the T wave Amplitude < 2mm  Neither presence nor absence is considered abnormal Large U wave causes Hypokalemia Cardiomyopathy Drug effects LV enlargement
Examining a 12-lead ECG Some QRS complexes have upward spike, others have downward deflections. Each lead has a positive electrode and a negative electrode When the heart’s electrical current is directed toward the positive electrode, the QRS complex spikes up; when directed toward the negative electrode, the QRS complex spikes down.
Vectors electrical energy generated by cardiac cells Represented by arrows have strength (measured in millivolts) and direction (measured in degrees) should follow heart’s conduction pathway--downward and to the left Overall energy flows from base (atria) to the apex (ventricles) QRS Axis  refers to energy flowing down the ventricles mainly to the left ventricle due to its larger muscle mass
Frontal Plane Leads Standard Limb Leads Augmented Voltage Leads measure the mean vector of the heart’s electrical flow ~ QRS Axis ~ in the frontal plane
Limb leads I to III First six leads of the 12-lead ECG are derived from these  called bipolar or standard leads Each  has  both  a  positive pole   and a  negative pole Central neutral zone is created Machine uses this point as the negative pole for the unipolar leads
Lead I Uses the negative electrode on the right arm looking toward the positive electrode on the left arm  produces upward deflection of the QRS
Lead II Uses the negative electrode on the right arm looking towards the positive electrode on the left leg,  shows most upright QRS complexes and most prominent P waves (monitoring lead)
Lead III Uses the negative electrode on the left arm looking towards the positive electrode on the left leg produces upward QRS deflection, can be equiphasic
aVR, aVL, aVF Augmented leads (unipolar leads) The software of the ECG machine looks toward the positive pole of limb leads to acquire these leads While using the central neutral zone set up by the bipolar leads as the negative pole
Lead aVR Uses negative central pole looking toward the positive electrode on the right arm Produces a downward deflected QRS because it looks at the heart in the opposite direction of the hearts  normal electrical current
Lead aVL Uses negative central pole looking toward the positive electrode on the left arm Produces the least upright QRS among the limb leads
Lead aVF Uses negative central pole looking toward the positive electrode on the left leg has very upright QRS complexes with prominent P waves
Horizontal Plane Leads Chest or Precordial leads: Unipolar leads lie across anterior chest V1 – V6 measure the mean vector of the heart’s electrical flow ~ QRS Axis ~  in the horizontal plane
Precordial / Chest Leads The software of the ECG machine looks toward the positive pole of the chest leads While using the central neutral zone set up by the bipolar leads as the negative pole
Chest leads Lead V 1 located at right sternal border, fourth intercostal space lies above right ventricle and septum Lead V 2 located at the left side of sternum, fourth intercostal space Lead V 3 located midway between leads V 2  and V 4
Chest leads  Lead V 4 located at the midclavicular line, fifth intercostal space Lead V 5 located at the anterior axillary line, fifth intercostal space Lead V 6 located at the midaxillary line, fifth intercostal space, above lateral wall of the left ventricle
R wave progression Part of a normal ECG, R wave progression occurs due to the overwhelming power of the left ventricle. QRS complex becomes increasingly upright V1 V2 – downward deflected QRS complex V3 V4 – equiphasic QRS complex V5 V6 – upward deflected QRS complex As the leads progress the R wave is more prominent and S wave is gone in V6.

12 Lead Basics

  • 1.
    Understanding the 12-lead ECG
  • 2.
    The heart’s electricalconduction Electrical activity precedes mechanical activity coordinates all parts of the heart to contract at the same time initiated in the sinoatrial (SA) node specialized group of cells in the right atrium depolarizes at a rate of 60 to 100 times/minute makes the atria contract and propel blood into the ventricles
  • 3.
  • 4.
    Atrial depolarization SANode produces the P wave first element on the ECG first part of the cardiac cycle appears as a small semicircular bump 1 st half represents right atrial depolarization 2 nd half represents left atrial depolarization Normal P wave size: 2.5-3 mm in height < 0.10 seconds in width
  • 5.
    PR interval Measuredfrom the beginning of the P wave to the beginning of the QRS complex represents SA node depolarization through the AV node During the PR segment is when actual atrial kick occurs allowing for 10 – 30% more volume pushed into the ventricles has normal duration of 0.12 to 0.20 second if longer than 0.20 second, a disease process may be affecting the cardiac conduction pathway
  • 6.
    AV Node/Bundle ofHIS Atrioventricular (AV) node receives the atrial impulse and (after a brief pause to let the ventricles fill from atrial kick) transmits it to the ventricles via the bundle of His Bundle of His collection of cardiac conduction fibers that splits into the right and left bundle branches
  • 7.
    Bundle branches high-speedconducting fibers that run down the intraventricular septum transmit cardiac impulse to the Purkinje fibers complex network that mingles with ventricular myocardial cells rapidly stimulating ventricular muscle resulting in ventricular depolarization
  • 8.
    Ventricular depolarization generatesthe QRS complex—the electrical equivalent of ventricular systole Remember that electrical activity precedes mechanical activity and ECG shows only electrical activity. You should be able to palpate a pulse with each QRS complex on the ECG monitor. QRS complex The largest complex on the ECG Normal amplitude ranges from 2 to 15mm normal duration is 0.06 to 0.10 second duration greater than 0.12 seconds usually indicates prolonged ventricular conduction caused by a bundle branch block can look different among different patients or among leads in the same patient
  • 9.
    QRS Complex Madeof 3 deflections Q wave 1 st Negative waveform preceeding the R wave May not be present in all patients R wave 1st Positive waveform S wave 2 nd Negative waveform
  • 10.
    ST segment Consistsof the isoelectric line between the end of the QRS complex and the beginning of the T wave End of ventricular depolarization to the beginning of ventricular repolarization Reveals information about the heart’s oxygen status When elevated key indicator of myocardial infarction (MI) When depressed can indicate ischemia or other abnormalities
  • 11.
    J Point Pointin which the QRS complex ends Can be challenging to find due ST segment elevation or depression
  • 12.
    T wave Characteristicsis larger and broader than the P wave < 5mm amplitude ≤ 0.30 seconds in duration is rounded Asymmetrical (the peak is closer to the end of the wave than to the beginning) Positive in Lead II represents ventricular repolarization
  • 13.
    Refractory Period Thetime between depolarization & repolarization 2 parts Absolute Refractory Period Beginning of QRS to peak of the T; absolutely no stimulation can be received Relative Refractory Period 2 nd half of T wave, some cells have repolarized enough to respond to stimulus
  • 14.
    QT Interval Measuredfrom beginning of QRS to end of T wave Represents onset of ventricular depolarization through ventricular repolarization QT intervals varies Sex, age, heart rate Should be less than ½ the distance between 2 R waves As the heart rate increases the QT interval usually decreases As the heart rate decreases the QT interval usually increases
  • 15.
    U wave Small,rounded, wave sometimes seen after the T wave Amplitude < 2mm Neither presence nor absence is considered abnormal Large U wave causes Hypokalemia Cardiomyopathy Drug effects LV enlargement
  • 16.
    Examining a 12-leadECG Some QRS complexes have upward spike, others have downward deflections. Each lead has a positive electrode and a negative electrode When the heart’s electrical current is directed toward the positive electrode, the QRS complex spikes up; when directed toward the negative electrode, the QRS complex spikes down.
  • 17.
    Vectors electrical energygenerated by cardiac cells Represented by arrows have strength (measured in millivolts) and direction (measured in degrees) should follow heart’s conduction pathway--downward and to the left Overall energy flows from base (atria) to the apex (ventricles) QRS Axis refers to energy flowing down the ventricles mainly to the left ventricle due to its larger muscle mass
  • 18.
    Frontal Plane LeadsStandard Limb Leads Augmented Voltage Leads measure the mean vector of the heart’s electrical flow ~ QRS Axis ~ in the frontal plane
  • 19.
    Limb leads Ito III First six leads of the 12-lead ECG are derived from these called bipolar or standard leads Each has both a positive pole and a negative pole Central neutral zone is created Machine uses this point as the negative pole for the unipolar leads
  • 20.
    Lead I Usesthe negative electrode on the right arm looking toward the positive electrode on the left arm produces upward deflection of the QRS
  • 21.
    Lead II Usesthe negative electrode on the right arm looking towards the positive electrode on the left leg, shows most upright QRS complexes and most prominent P waves (monitoring lead)
  • 22.
    Lead III Usesthe negative electrode on the left arm looking towards the positive electrode on the left leg produces upward QRS deflection, can be equiphasic
  • 23.
    aVR, aVL, aVFAugmented leads (unipolar leads) The software of the ECG machine looks toward the positive pole of limb leads to acquire these leads While using the central neutral zone set up by the bipolar leads as the negative pole
  • 24.
    Lead aVR Usesnegative central pole looking toward the positive electrode on the right arm Produces a downward deflected QRS because it looks at the heart in the opposite direction of the hearts normal electrical current
  • 25.
    Lead aVL Usesnegative central pole looking toward the positive electrode on the left arm Produces the least upright QRS among the limb leads
  • 26.
    Lead aVF Usesnegative central pole looking toward the positive electrode on the left leg has very upright QRS complexes with prominent P waves
  • 27.
    Horizontal Plane LeadsChest or Precordial leads: Unipolar leads lie across anterior chest V1 – V6 measure the mean vector of the heart’s electrical flow ~ QRS Axis ~ in the horizontal plane
  • 28.
    Precordial / ChestLeads The software of the ECG machine looks toward the positive pole of the chest leads While using the central neutral zone set up by the bipolar leads as the negative pole
  • 29.
    Chest leads LeadV 1 located at right sternal border, fourth intercostal space lies above right ventricle and septum Lead V 2 located at the left side of sternum, fourth intercostal space Lead V 3 located midway between leads V 2 and V 4
  • 30.
    Chest leads Lead V 4 located at the midclavicular line, fifth intercostal space Lead V 5 located at the anterior axillary line, fifth intercostal space Lead V 6 located at the midaxillary line, fifth intercostal space, above lateral wall of the left ventricle
  • 31.
    R wave progressionPart of a normal ECG, R wave progression occurs due to the overwhelming power of the left ventricle. QRS complex becomes increasingly upright V1 V2 – downward deflected QRS complex V3 V4 – equiphasic QRS complex V5 V6 – upward deflected QRS complex As the leads progress the R wave is more prominent and S wave is gone in V6.