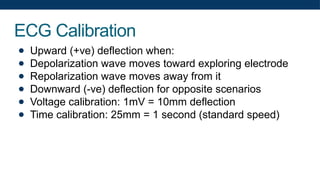
UNDERSTANDING THE
ELECTROCARDIOGRAM (ECG):
PRINCIPLES AND RECORDING
Introduction to ECG
Introduction to ECG
● ECG: Record of electrical currents generated by
myocardial activity
● Detects depolarization and repolarization through body
fluids
● Crucial for diagnosing cardiac diseases
● Recorded using an electrocardiograph:
● Consists of a sensitive galvanometer
● Uses two electrodes applied to the skin
ECG Leads: Overview
● Lead: Specific arrangement of electrodes on the skin
● Typically 12 leads used (sometimes more)
● Two main types of ECG leads:
● Bipolar limb leads (Standard limb leads of Einthoven)
● Unipolar leads
Bipolar Limb Leads
● Record potential differences between two limbs
● Three standard leads:
● Lead I: Left Arm (LA) - Right Arm (RA)
● Lead II: Left Leg (LL) - Right Arm (RA)
● Lead III: Left Leg (LL) - Left Arm (LA)
● Einthoven's Triangle: Imaginary equilateral triangle
representing these leads
Einthoven's Law
● States: Sum of voltages in leads I and III equals voltage in
lead II
● Mathematically: VI + VIII = VII
● Useful for calculating unknown lead voltage if two are
known
Unipolar Leads: Principles
● Measure absolute potential at a specific point
● Use:
● One exploring (+ve) electrode at desired point
● One indifferent (-ve) electrode at zero potential
● Indifferent electrode creation:
● Connect electrodes from 3 limbs to a common terminal
● Forms closed circuit with zero potential (Wilson's
electrode)
Types of Unipolar Leads
● Unipolar Limb Leads:
● VR: Right Arm
● VL: Left Arm
● VF: Left Leg
● Unipolar Chest Leads (Wilson's precordial or V leads):
● V1 to V6: Six standard points on anterior chest wall
Chest Lead Positions
● V1: Right sternal margin, 4th right intercostal space
● V2: Left sternal margin, 4th left intercostal space
● V3: Midway between V2 and V4
● V4: Left midclavicular line, 5th intercostal space
● V5: Left anterior axillary line, level with V4
● V6: Left midaxillary line, level with V4 and V5
Augmented Unipolar Limb Leads
● Goldberger's leads: aVR, aVL, aVF
● Magnified by 50% without changing configuration
● Easier to interpret
● Routinely recorded by modern ECG machines
● Achieved by disconnecting electrode from central terminal
ECG Calibration
● Upward (+ve) deflection when:
● Depolarization wave moves toward exploring electrode
● Repolarization wave moves away from it
● Downward (-ve) deflection for opposite scenarios
● Voltage calibration: 1mV = 10mm deflection
● Time calibration: 25mm = 1 second (standard speed)
ECG Paper Measurements
● Vertical lines (voltage):
● Small square side = 0.1mV
● Horizontal lines (time):
● Small square side = 0.04 seconds
● Large square side = 0.2 seconds
Calculating Heart Rate from ECG
Method 1:
● Measure distance between two successive R waves (in
mm)
● Multiply by 0.04 to get duration of one cardiac cycle
● Calculate beats per minute: 60 / (cycle duration)
Method 2 (at 25mm/s speed):
● Count small squares between R waves
● Heart rate = 1500 / (number of small squares)
Spread of Cardiac Excitation
● Initiated in Sinoatrial (SA) node
● Spreads through atria from right to left
● Moves to interventricular septum (left to right)
● Progresses in ventricular wall from endocardial to
epicardial surface
Last Areas of Depolarization
● Posterobasal portion of left ventricle
● Pulmonary conus
● Uppermost part of interventricular septum
Key Takeaways
● ECG is crucial for diagnosing cardiac diseases
● Uses various lead placements to capture electrical activity
● Understanding lead types and placements is essential
● ECG calibration and paper measurements are
standardized
● Heart rate can be calculated directly from ECG tracing
● Cardiac excitation follows a specific pattern of spread
Introduction to the ECG
● ECG: A graphical representation of the heart's electrical
activity
● Consists of 5 main waves: P, Q, R, S, and T
● Sometimes includes a U wave following the T wave
● Waves are separated by segments
● QRS complex: Combination of Q, R, and S waves
● J point: Termination of the QRS complex at the isoelectric
line
P Wave: Atrial Depolarization
● Represents atrial depolarization
● Normal characteristics:
● Amplitude: 0.1 mV
● Duration: ≤ 0.1 seconds
● Positive in all leads except aVR
● First part: Right atrial activation
● Terminal part: Left atrial activation
P Wave Abnormalities
● Left atrial hypertrophy (e.g., mitral stenosis):
● P mitrale: Enlarged and notched P waves
● Increased duration
● Right atrial hypertrophy (e.g., tricuspid stenosis):
● P pulmonale: Tall, peaked P waves
● Normal duration
● Other abnormalities:
● Inverted in AV nodal rhythm
● Absent in atrial fibrillation
QRS Complex: Ventricular Depolarization
● Represents ventricular depolarization
● Normal duration: 0.06-0.1 seconds
● Components:
● Q wave: Interventricular septum depolarization
● R wave: Apex and ventricular wall depolarization
● S wave: Posterobasal left ventricle and pulmonary conus
depolarization
QRS Complex Characteristics
● Q wave: Normally negative in leads facing left ventricle
● R wave:
● Large wave, amplitude ≈ 10 mm (1 mV)
● Positive in leads facing left ventricle
● S wave: Normally negative in leads facing left ventricle
● Larger amplitude than P wave due to greater ventricular
muscle mass
QRS Complex Abnormalities
● Ventricular hypertrophy
● Myocardial infarction
● Extrasystoles
● Bundle branch block
● Electrolyte disturbances
T Wave: Ventricular Repolarization
● Represents ventricular repolarization
● Normal characteristics:
● Amplitude: 0.2-0.4 mV
● Duration: 0.2-0.25 seconds
● Normally positive due to repolarization direction
T Wave Abnormalities
● Inverted or isoelectric in:
● Myocardial ischemia
● Ventricular hypertrophy
● Extrasystoles
● Bundle branch block
● Digitalis overdosage
● Increased amplitude in:
● Sympathetic overactivity
● Muscular exercise
● Hyperkalemia
U Wave
● Small positive wave following T wave
● Probable cause: Slow repolarization of Purkinje network
● Not consistently present
● Physiological significance remains uncertain
P-R Interval
● Interval from start of P wave to start of R wave
● Normal range: 0.12-0.21 seconds
● Represents AV nodal delay
● Prolonged in:
● First-degree heart block
● Increased vagal tone
● Shortened in:
● AV nodal rhythm
● Sympathetic overactivity
● Wolff-Parkinson-White syndrome
P-R Segment
● Segment between end of P wave and start of QRS
complex
● Represents conduction through AV node and bundle of
His
● Normally isoelectric (no visible waves)
● Silent due to small amount of depolarized tissue
Q-T Interval
● Interval from onset of Q wave to end of T wave
● Normal duration: 0.3-0.4 seconds
● Inversely related to heart rate
● Represents duration of ventricular action potential
S-T Segment
● Segment from end of S wave (J point) to start of T wave
● Normal duration: ≈ 0.12 seconds
● Normally isoelectric
● Deviation indicates myocardial injury or damage
ECG and Ventricular Action Potential Correlation
● QRS complex: Depolarization phase (Phase 0)
● S-T segment: Plateau phase (Phase 2)
● T wave: Repolarization phase (Phase 3)
● T-P segment: Resting phase (Phase 4)
ECG and Cardiac Cycle Events
● P wave precedes atrial systole by ≈ 0.02 seconds
● QRS complex precedes isometric ventricular contraction
by ≈ 0.02 seconds
● First heart sound coincides with R wave summit
● Second heart sound coincides with end of T wave
Lead aVR Characteristics
● P wave, QRS complex, and T wave are normally negative
(inverted)
● Due to depolarization and repolarization vectors moving
away from the right arm electrode
Precordial Leads
● Right precordial leads (V1, V2):
● Small R waves followed by deep S waves
● Left precordial leads (V5, V6):
● Small Q waves followed by large R waves
● Reflects direction of septal depolarization and
predominance of left ventricular mass
Mean Electric Axis of the Ventricles
● Represents overall direction of ventricular depolarization
● Determined from Einthoven's triangle
● Normal range: -30° to +110° (average +60°)
● Directed downwards and to the left
● Positive deflections in bipolar limb leads
Clinical Significance of ECG
● Diagnoses various cardiac abnormalities:
● Arrhythmias
● Conduction disorders
● Myocardial infarction
● Electrolyte imbalances
● Monitors cardiac function during procedures
● Screens for cardiovascular diseases
● Guides treatment decisions in cardiac patients
Introduction to Axis Deviation
● Axis deviation refers to shifts in the mean electrical axis of
the heart
● Can be right or left deviation
● Occurs normally in certain body types or pathologically in
various conditions
● Detectable through specific ECG patterns
Right Axis Deviation
● Normal in vertical hearts (e.g., tall subjects)
● Pathological in:
● Right ventricular hypertrophy
● Right bundle branch block
● ECG characteristics:
● Deep S waves in lead I
● High R waves in lead III
Left Axis Deviation
● Normal in horizontal hearts (e.g., short stout subjects,
pregnant women)
● Pathological in:
● Left ventricular hypertrophy
● Left bundle branch block
● ECG characteristics:
● High R waves in lead I
● Deep S waves in lead III
Ventricular Hypertrophy: Overview
● Refers to thickening of ventricular walls
● Can affect left or right ventricle
● Causes distinct ECG patterns
● Often associated with axis deviation
Left Ventricular Hypertrophy (LVH)
● ECG manifestations:
● High R waves in left precordial leads (V5, V6)
● Deep S waves in right precordial leads (V1, V2)
● T wave inversion in left precordial leads
● Left axis deviation
Right Ventricular Hypertrophy (RVH)
● ECG manifestations:
● High R waves in right precordial leads (V1, V2)
● Deep S waves in left precordial leads (V5, V6)
● T wave inversion in right precordial leads
● Right axis deviation
Coronary Insufficiency: Introduction
● Reduced blood supply to the heart muscle
● Can lead to ischemia, injury, or necrosis
● Each stage produces distinct ECG changes
Manifestations of Myocardial Ischemia
● Definition: Reduced oxygen supply to heart muscle
● ECG changes:
● Inverted T waves
● Mechanism:
● Hypoxia delays repolarization in epicardium
● Repolarization starts from endocardium to epicardium
Manifestations of Myocardial Injury
● Definition: Damage to heart muscle cells
● ECG changes:
● S-T segment shift (elevation or depression)
● Mechanism:
● Current of injury between damaged and healthy tissue
● Incomplete repolarization of cardiac muscle
Manifestations of Myocardial Necrosis (Infarction)
● Definition: Death of heart muscle cells
● Usually affects left ventricle or interventricular septum
● ECG changes:
● Deep Q waves (>0.2 mV) if full thickness affected
● Reduced R wave amplitude in partial necrosis
Progression of Myocardial Infarction on ECG
● S-T segment elevation (within minutes)
● Deep Q waves (after a few hours)
● T wave inversion (follows Q waves)
● S-T segments return to baseline (1-2 weeks)
● T waves become upright (after a few months)
● Deep Q waves persist (permanent sign of old MI)
Effects of Serum Sodium (Na+) on ECG
● Hyponatremia:
● Low-voltage QRS complexes
● Hypernatremia:
● Minimal effects on ECG
Effects of Serum Potassium (K+) on ECG: Hyperkalemia
● Progressive changes:
● Tall, peaked T waves
● Absence of P waves (atrial arrest)
● S-T segment depression
● QRS complex prolongation
● A-V block
● Ventricular arrhythmia
● Ventricular standstill
Effects of Serum Potassium (K+) on ECG: Hypokalemia
● ECG changes:
● Prolongation of P-R and Q-T intervals
● Prominent U waves
● T wave inversion
Clinical Significance of Axis Deviation
● Helps in diagnosing ventricular hypertrophy
● Indicates bundle branch blocks
● Assists in identifying cardiac chamber enlargement
● Guides further diagnostic tests and treatment plans
Importance of ECG in Coronary Insufficiency
● Non-invasive tool for detecting myocardial ischemia,
injury, and infarction
● Helps in determining the extent and location of damage
● Guides treatment decisions in acute coronary syndromes
● Useful for monitoring progression and recovery
Electrolyte Imbalances and ECG
● ECG changes can indicate potentially life-threatening
electrolyte disturbances
● Particularly important for monitoring potassium levels
● Guides urgent treatment in severe cases
● Helps in managing patients with renal dysfunction or on
certain medications
Limitations and Considerations
● ECG changes may not always correlate perfectly with
clinical condition
● Other diagnostic tools (e.g., cardiac enzymes, imaging)
often necessary
● Serial ECGs may be needed to detect evolving changes
● Interpretation should always be done in context of clinical
presentation
Summary and Key Points
● Axis deviation reflects changes in heart's electrical
orientation
● Ventricular hypertrophy produces characteristic ECG
patterns
● Coronary insufficiency manifests as progressive ECG
changes
● Electrolyte imbalances, especially K+, can significantly
affect ECG
● ECG is a valuable tool but should be interpreted alongside
clinical findings
Introduction to Arrhythmias
● Arrhythmias (or dysrhythmias) are abnormalities in heart
rate or rhythm
● Can affect heart's ability to pump blood effectively
● Understanding arrhythmias is crucial for diagnosing and
treating heart conditions
● This presentation will cover types, causes, and ECG
manifestations of arrhythmias
Classification of Arrhythmias
● Disturbances in impulse formation:
● Alterations of SA node rhythmicity
● Presence of ectopic foci
● Disturbances in impulse conduction:
● SA block
● AV block
● Wolff-Parkinson-White syndrome
Sinus Rhythms
● Sinus Tachycardia:
● Heart rate increases to 100-120/minute
● Caused by increased sympathetic activity (e.g., exercise)
● Sinus Bradycardia:
● Heart rate decreases below 60/minute
● Often seen in athletes due to increased vagal tone
ECG shows normal complexes with altered rate
Respiratory Sinus Arrhythmia
● Normal finding, common in children and young adults
● Heart rate increases during inspiration and decreases
during expiration
● Caused by fluctuations in vagal tone affecting SA node
rhythmicity
ECG shows normal complexes with rate variations
corresponding to respiratory phases
AV Nodal Rhythm
● Occurs when AV node becomes the pacemaker (SA node
damaged)
ECG characteristics:
● Bradycardia (AV node rhythmicity slower than SA node)
● Short PR intervals
● Inverted P waves (often buried in QRS complexes)
● P waves may follow QRS complexes (negative PR
intervals)
Extrasystoles (Premature Beats)
● Impulses from ectopic foci during normal SA rhythm
● Two main types:
● Supraventricular premature beats
● Ventricular premature beats
ECG shows complexes early in the T-P interval
Supraventricular Premature Beats
● Origin: Ectopic foci in atria or AV node
ECG characteristics:
● Abnormal P wave (often inverted)
● Normal QRST waves
● Almost normal T-Q interval (no or short compensatory
pause)
● Shortened PR interval if focus near AV node
Ventricular Premature Beats
● Origin: Ventricular ectopic foci
ECG characteristics:
● Wide, high, abnormally-shaped QRS complex (bizarre
QRS)
● No P wave
● Prolonged following T-Q interval (complete compensatory
pause)
● Inverted T wave
● Axis deviation
Paroxysmal Tachycardia
● Characterized by sudden attacks of tachycardia
● Ectopic foci discharge at 150-220/minute (avg.
200/minute)
● Suppresses SA node during attacks
● Two main types:
● Paroxysmal supraventricular tachycardia
● Paroxysmal ventricular tachycardia
Paroxysmal Supraventricular Tachycardia
ECG shows abnormal P waves in all complexes
● May occur in Wolff-Parkinson-White syndrome
● Often associated with some degree of AV block
● Ventricular rate typically 170-180/minute
Paroxysmal Ventricular Tachycardia
ECG characteristics:
● Wide, high, bizarre-shaped QRS complexes
● Inverted T waves without preceding P waves
● Ventricular rate 150-220/minute
● More dangerous than atrial type:
● Marked reduction in cardiac output
● Predisposes to ventricular fibrillation
● Atrioventricular dissociation present
Atrial Flutter
● Atria beat regularly at 250-350/minute
● Caused by hyperexcitable ectopic focus
● Physiological incomplete heart block develops
ECG characteristics:
● 2 or 3 P waves followed by one QRST
● Abnormal P waves, normal QRS and T waves
● Regular but rapid ventricular rate
Atrial Fibrillation
● Atria beat irregularly at 350-500/minute
● Caused by multiple ectopic foci or circus movement
● Irregular physiological heart block
ECG characteristics:
● No P waves (replaced by F waves)
● Normal QRS and T waves, irregular rate
● Complications: Inefficient atrial contraction, blood
stagnation, thrombosis risk
Ventricular Fibrillation
● Caused by multiple ectopic foci or re-entry/circus
movements
● Fatal due to loss of ventricular pumping power
ECG characteristics:
● Irregular QRS complexes in shape, rhythm, and amplitude
● Indistinguishable waves
● Often follows paroxysmal ventricular tachycardia or occurs
during vulnerable period
The Vulnerable Period
● Short period at end of cardiac repolarization
● Coincides with downslope of T wave
● Dangerous due to varying states of repolarization in
cardiac fibers
● Favors re-entry and circus movements
● May lead to ventricular fibrillation
Mechanisms of Cardiac Rhythm Alterations
● Abnormal automaticity of SA node
● Changes in slope of prepotential
● Re-entry phenomenon (Circus movement)
● Impulse spreads in circular pathway
● More likely during vulnerable period
● Can be triggered by weak electric shock
Atrioventricular (AV) Block
● Often due to ischemia of AV nodal or infranodal regions
● Three degrees of severity:
● First-degree heart block
● Second-degree heart block
● Third-degree (complete) heart block
Bundle Branch Block (BBB)
● Injury to right or left bundle branches
● Commonly due to ischemia
● Causes activation of one ventricle before the other
ECG characteristics:
● Prolonged, slurred QRS complexes (>0.12 sec)
● T wave inversion in leads facing affected side
● Right or left axis deviation
Conclusion
● Arrhythmias are complex disturbances in heart rhythm
● Understanding ECG patterns is crucial for diagnosis
● Various mechanisms contribute to different types of
arrhythmias
● Proper identification and treatment are essential for
patient care
● Continued research and education in this field are vital for
improving cardiac health outcomes

1.pptx ecg basic knowledge of electrocardiogram

  • 1.
  • 2.
    Introduction to ECG ●ECG: Record of electrical currents generated by myocardial activity ● Detects depolarization and repolarization through body fluids ● Crucial for diagnosing cardiac diseases ● Recorded using an electrocardiograph: ● Consists of a sensitive galvanometer ● Uses two electrodes applied to the skin
  • 3.
    ECG Leads: Overview ●Lead: Specific arrangement of electrodes on the skin ● Typically 12 leads used (sometimes more) ● Two main types of ECG leads: ● Bipolar limb leads (Standard limb leads of Einthoven) ● Unipolar leads
  • 4.
    Bipolar Limb Leads ●Record potential differences between two limbs ● Three standard leads: ● Lead I: Left Arm (LA) - Right Arm (RA) ● Lead II: Left Leg (LL) - Right Arm (RA) ● Lead III: Left Leg (LL) - Left Arm (LA) ● Einthoven's Triangle: Imaginary equilateral triangle representing these leads
  • 5.
    Einthoven's Law ● States:Sum of voltages in leads I and III equals voltage in lead II ● Mathematically: VI + VIII = VII ● Useful for calculating unknown lead voltage if two are known
  • 6.
    Unipolar Leads: Principles ●Measure absolute potential at a specific point ● Use: ● One exploring (+ve) electrode at desired point ● One indifferent (-ve) electrode at zero potential ● Indifferent electrode creation: ● Connect electrodes from 3 limbs to a common terminal ● Forms closed circuit with zero potential (Wilson's electrode)
  • 7.
    Types of UnipolarLeads ● Unipolar Limb Leads: ● VR: Right Arm ● VL: Left Arm ● VF: Left Leg ● Unipolar Chest Leads (Wilson's precordial or V leads): ● V1 to V6: Six standard points on anterior chest wall
  • 8.
    Chest Lead Positions ●V1: Right sternal margin, 4th right intercostal space ● V2: Left sternal margin, 4th left intercostal space ● V3: Midway between V2 and V4 ● V4: Left midclavicular line, 5th intercostal space ● V5: Left anterior axillary line, level with V4 ● V6: Left midaxillary line, level with V4 and V5
  • 9.
    Augmented Unipolar LimbLeads ● Goldberger's leads: aVR, aVL, aVF ● Magnified by 50% without changing configuration ● Easier to interpret ● Routinely recorded by modern ECG machines ● Achieved by disconnecting electrode from central terminal
  • 10.
    ECG Calibration ● Upward(+ve) deflection when: ● Depolarization wave moves toward exploring electrode ● Repolarization wave moves away from it ● Downward (-ve) deflection for opposite scenarios ● Voltage calibration: 1mV = 10mm deflection ● Time calibration: 25mm = 1 second (standard speed)
  • 11.
    ECG Paper Measurements ●Vertical lines (voltage): ● Small square side = 0.1mV ● Horizontal lines (time): ● Small square side = 0.04 seconds ● Large square side = 0.2 seconds
  • 12.
    Calculating Heart Ratefrom ECG Method 1: ● Measure distance between two successive R waves (in mm) ● Multiply by 0.04 to get duration of one cardiac cycle ● Calculate beats per minute: 60 / (cycle duration) Method 2 (at 25mm/s speed): ● Count small squares between R waves ● Heart rate = 1500 / (number of small squares)
  • 13.
    Spread of CardiacExcitation ● Initiated in Sinoatrial (SA) node ● Spreads through atria from right to left ● Moves to interventricular septum (left to right) ● Progresses in ventricular wall from endocardial to epicardial surface
  • 14.
    Last Areas ofDepolarization ● Posterobasal portion of left ventricle ● Pulmonary conus ● Uppermost part of interventricular septum
  • 15.
    Key Takeaways ● ECGis crucial for diagnosing cardiac diseases ● Uses various lead placements to capture electrical activity ● Understanding lead types and placements is essential ● ECG calibration and paper measurements are standardized ● Heart rate can be calculated directly from ECG tracing ● Cardiac excitation follows a specific pattern of spread
  • 16.
    Introduction to theECG ● ECG: A graphical representation of the heart's electrical activity ● Consists of 5 main waves: P, Q, R, S, and T ● Sometimes includes a U wave following the T wave ● Waves are separated by segments ● QRS complex: Combination of Q, R, and S waves ● J point: Termination of the QRS complex at the isoelectric line
  • 17.
    P Wave: AtrialDepolarization ● Represents atrial depolarization ● Normal characteristics: ● Amplitude: 0.1 mV ● Duration: ≤ 0.1 seconds ● Positive in all leads except aVR ● First part: Right atrial activation ● Terminal part: Left atrial activation
  • 18.
    P Wave Abnormalities ●Left atrial hypertrophy (e.g., mitral stenosis): ● P mitrale: Enlarged and notched P waves ● Increased duration ● Right atrial hypertrophy (e.g., tricuspid stenosis): ● P pulmonale: Tall, peaked P waves ● Normal duration ● Other abnormalities: ● Inverted in AV nodal rhythm ● Absent in atrial fibrillation
  • 19.
    QRS Complex: VentricularDepolarization ● Represents ventricular depolarization ● Normal duration: 0.06-0.1 seconds ● Components: ● Q wave: Interventricular septum depolarization ● R wave: Apex and ventricular wall depolarization ● S wave: Posterobasal left ventricle and pulmonary conus depolarization
  • 20.
    QRS Complex Characteristics ●Q wave: Normally negative in leads facing left ventricle ● R wave: ● Large wave, amplitude ≈ 10 mm (1 mV) ● Positive in leads facing left ventricle ● S wave: Normally negative in leads facing left ventricle ● Larger amplitude than P wave due to greater ventricular muscle mass
  • 21.
    QRS Complex Abnormalities ●Ventricular hypertrophy ● Myocardial infarction ● Extrasystoles ● Bundle branch block ● Electrolyte disturbances
  • 22.
    T Wave: VentricularRepolarization ● Represents ventricular repolarization ● Normal characteristics: ● Amplitude: 0.2-0.4 mV ● Duration: 0.2-0.25 seconds ● Normally positive due to repolarization direction
  • 23.
    T Wave Abnormalities ●Inverted or isoelectric in: ● Myocardial ischemia ● Ventricular hypertrophy ● Extrasystoles ● Bundle branch block ● Digitalis overdosage ● Increased amplitude in: ● Sympathetic overactivity ● Muscular exercise ● Hyperkalemia
  • 24.
    U Wave ● Smallpositive wave following T wave ● Probable cause: Slow repolarization of Purkinje network ● Not consistently present ● Physiological significance remains uncertain
  • 25.
    P-R Interval ● Intervalfrom start of P wave to start of R wave ● Normal range: 0.12-0.21 seconds ● Represents AV nodal delay ● Prolonged in: ● First-degree heart block ● Increased vagal tone ● Shortened in: ● AV nodal rhythm ● Sympathetic overactivity ● Wolff-Parkinson-White syndrome
  • 26.
    P-R Segment ● Segmentbetween end of P wave and start of QRS complex ● Represents conduction through AV node and bundle of His ● Normally isoelectric (no visible waves) ● Silent due to small amount of depolarized tissue
  • 27.
    Q-T Interval ● Intervalfrom onset of Q wave to end of T wave ● Normal duration: 0.3-0.4 seconds ● Inversely related to heart rate ● Represents duration of ventricular action potential
  • 28.
    S-T Segment ● Segmentfrom end of S wave (J point) to start of T wave ● Normal duration: ≈ 0.12 seconds ● Normally isoelectric ● Deviation indicates myocardial injury or damage
  • 29.
    ECG and VentricularAction Potential Correlation ● QRS complex: Depolarization phase (Phase 0) ● S-T segment: Plateau phase (Phase 2) ● T wave: Repolarization phase (Phase 3) ● T-P segment: Resting phase (Phase 4)
  • 30.
    ECG and CardiacCycle Events ● P wave precedes atrial systole by ≈ 0.02 seconds ● QRS complex precedes isometric ventricular contraction by ≈ 0.02 seconds ● First heart sound coincides with R wave summit ● Second heart sound coincides with end of T wave
  • 31.
    Lead aVR Characteristics ●P wave, QRS complex, and T wave are normally negative (inverted) ● Due to depolarization and repolarization vectors moving away from the right arm electrode
  • 32.
    Precordial Leads ● Rightprecordial leads (V1, V2): ● Small R waves followed by deep S waves ● Left precordial leads (V5, V6): ● Small Q waves followed by large R waves ● Reflects direction of septal depolarization and predominance of left ventricular mass
  • 33.
    Mean Electric Axisof the Ventricles ● Represents overall direction of ventricular depolarization ● Determined from Einthoven's triangle ● Normal range: -30° to +110° (average +60°) ● Directed downwards and to the left ● Positive deflections in bipolar limb leads
  • 34.
    Clinical Significance ofECG ● Diagnoses various cardiac abnormalities: ● Arrhythmias ● Conduction disorders ● Myocardial infarction ● Electrolyte imbalances ● Monitors cardiac function during procedures ● Screens for cardiovascular diseases ● Guides treatment decisions in cardiac patients
  • 35.
    Introduction to AxisDeviation ● Axis deviation refers to shifts in the mean electrical axis of the heart ● Can be right or left deviation ● Occurs normally in certain body types or pathologically in various conditions ● Detectable through specific ECG patterns
  • 36.
    Right Axis Deviation ●Normal in vertical hearts (e.g., tall subjects) ● Pathological in: ● Right ventricular hypertrophy ● Right bundle branch block ● ECG characteristics: ● Deep S waves in lead I ● High R waves in lead III
  • 37.
    Left Axis Deviation ●Normal in horizontal hearts (e.g., short stout subjects, pregnant women) ● Pathological in: ● Left ventricular hypertrophy ● Left bundle branch block ● ECG characteristics: ● High R waves in lead I ● Deep S waves in lead III
  • 38.
    Ventricular Hypertrophy: Overview ●Refers to thickening of ventricular walls ● Can affect left or right ventricle ● Causes distinct ECG patterns ● Often associated with axis deviation
  • 39.
    Left Ventricular Hypertrophy(LVH) ● ECG manifestations: ● High R waves in left precordial leads (V5, V6) ● Deep S waves in right precordial leads (V1, V2) ● T wave inversion in left precordial leads ● Left axis deviation
  • 40.
    Right Ventricular Hypertrophy(RVH) ● ECG manifestations: ● High R waves in right precordial leads (V1, V2) ● Deep S waves in left precordial leads (V5, V6) ● T wave inversion in right precordial leads ● Right axis deviation
  • 41.
    Coronary Insufficiency: Introduction ●Reduced blood supply to the heart muscle ● Can lead to ischemia, injury, or necrosis ● Each stage produces distinct ECG changes
  • 42.
    Manifestations of MyocardialIschemia ● Definition: Reduced oxygen supply to heart muscle ● ECG changes: ● Inverted T waves ● Mechanism: ● Hypoxia delays repolarization in epicardium ● Repolarization starts from endocardium to epicardium
  • 43.
    Manifestations of MyocardialInjury ● Definition: Damage to heart muscle cells ● ECG changes: ● S-T segment shift (elevation or depression) ● Mechanism: ● Current of injury between damaged and healthy tissue ● Incomplete repolarization of cardiac muscle
  • 44.
    Manifestations of MyocardialNecrosis (Infarction) ● Definition: Death of heart muscle cells ● Usually affects left ventricle or interventricular septum ● ECG changes: ● Deep Q waves (>0.2 mV) if full thickness affected ● Reduced R wave amplitude in partial necrosis
  • 45.
    Progression of MyocardialInfarction on ECG ● S-T segment elevation (within minutes) ● Deep Q waves (after a few hours) ● T wave inversion (follows Q waves) ● S-T segments return to baseline (1-2 weeks) ● T waves become upright (after a few months) ● Deep Q waves persist (permanent sign of old MI)
  • 46.
    Effects of SerumSodium (Na+) on ECG ● Hyponatremia: ● Low-voltage QRS complexes ● Hypernatremia: ● Minimal effects on ECG
  • 47.
    Effects of SerumPotassium (K+) on ECG: Hyperkalemia ● Progressive changes: ● Tall, peaked T waves ● Absence of P waves (atrial arrest) ● S-T segment depression ● QRS complex prolongation ● A-V block ● Ventricular arrhythmia ● Ventricular standstill
  • 48.
    Effects of SerumPotassium (K+) on ECG: Hypokalemia ● ECG changes: ● Prolongation of P-R and Q-T intervals ● Prominent U waves ● T wave inversion
  • 49.
    Clinical Significance ofAxis Deviation ● Helps in diagnosing ventricular hypertrophy ● Indicates bundle branch blocks ● Assists in identifying cardiac chamber enlargement ● Guides further diagnostic tests and treatment plans
  • 50.
    Importance of ECGin Coronary Insufficiency ● Non-invasive tool for detecting myocardial ischemia, injury, and infarction ● Helps in determining the extent and location of damage ● Guides treatment decisions in acute coronary syndromes ● Useful for monitoring progression and recovery
  • 51.
    Electrolyte Imbalances andECG ● ECG changes can indicate potentially life-threatening electrolyte disturbances ● Particularly important for monitoring potassium levels ● Guides urgent treatment in severe cases ● Helps in managing patients with renal dysfunction or on certain medications
  • 52.
    Limitations and Considerations ●ECG changes may not always correlate perfectly with clinical condition ● Other diagnostic tools (e.g., cardiac enzymes, imaging) often necessary ● Serial ECGs may be needed to detect evolving changes ● Interpretation should always be done in context of clinical presentation
  • 53.
    Summary and KeyPoints ● Axis deviation reflects changes in heart's electrical orientation ● Ventricular hypertrophy produces characteristic ECG patterns ● Coronary insufficiency manifests as progressive ECG changes ● Electrolyte imbalances, especially K+, can significantly affect ECG ● ECG is a valuable tool but should be interpreted alongside clinical findings
  • 54.
    Introduction to Arrhythmias ●Arrhythmias (or dysrhythmias) are abnormalities in heart rate or rhythm ● Can affect heart's ability to pump blood effectively ● Understanding arrhythmias is crucial for diagnosing and treating heart conditions ● This presentation will cover types, causes, and ECG manifestations of arrhythmias
  • 55.
    Classification of Arrhythmias ●Disturbances in impulse formation: ● Alterations of SA node rhythmicity ● Presence of ectopic foci ● Disturbances in impulse conduction: ● SA block ● AV block ● Wolff-Parkinson-White syndrome
  • 56.
    Sinus Rhythms ● SinusTachycardia: ● Heart rate increases to 100-120/minute ● Caused by increased sympathetic activity (e.g., exercise) ● Sinus Bradycardia: ● Heart rate decreases below 60/minute ● Often seen in athletes due to increased vagal tone ECG shows normal complexes with altered rate
  • 57.
    Respiratory Sinus Arrhythmia ●Normal finding, common in children and young adults ● Heart rate increases during inspiration and decreases during expiration ● Caused by fluctuations in vagal tone affecting SA node rhythmicity ECG shows normal complexes with rate variations corresponding to respiratory phases
  • 58.
    AV Nodal Rhythm ●Occurs when AV node becomes the pacemaker (SA node damaged) ECG characteristics: ● Bradycardia (AV node rhythmicity slower than SA node) ● Short PR intervals ● Inverted P waves (often buried in QRS complexes) ● P waves may follow QRS complexes (negative PR intervals)
  • 59.
    Extrasystoles (Premature Beats) ●Impulses from ectopic foci during normal SA rhythm ● Two main types: ● Supraventricular premature beats ● Ventricular premature beats ECG shows complexes early in the T-P interval
  • 60.
    Supraventricular Premature Beats ●Origin: Ectopic foci in atria or AV node ECG characteristics: ● Abnormal P wave (often inverted) ● Normal QRST waves ● Almost normal T-Q interval (no or short compensatory pause) ● Shortened PR interval if focus near AV node
  • 61.
    Ventricular Premature Beats ●Origin: Ventricular ectopic foci ECG characteristics: ● Wide, high, abnormally-shaped QRS complex (bizarre QRS) ● No P wave ● Prolonged following T-Q interval (complete compensatory pause) ● Inverted T wave ● Axis deviation
  • 62.
    Paroxysmal Tachycardia ● Characterizedby sudden attacks of tachycardia ● Ectopic foci discharge at 150-220/minute (avg. 200/minute) ● Suppresses SA node during attacks ● Two main types: ● Paroxysmal supraventricular tachycardia ● Paroxysmal ventricular tachycardia
  • 63.
    Paroxysmal Supraventricular Tachycardia ECGshows abnormal P waves in all complexes ● May occur in Wolff-Parkinson-White syndrome ● Often associated with some degree of AV block ● Ventricular rate typically 170-180/minute
  • 64.
    Paroxysmal Ventricular Tachycardia ECGcharacteristics: ● Wide, high, bizarre-shaped QRS complexes ● Inverted T waves without preceding P waves ● Ventricular rate 150-220/minute ● More dangerous than atrial type: ● Marked reduction in cardiac output ● Predisposes to ventricular fibrillation ● Atrioventricular dissociation present
  • 65.
    Atrial Flutter ● Atriabeat regularly at 250-350/minute ● Caused by hyperexcitable ectopic focus ● Physiological incomplete heart block develops ECG characteristics: ● 2 or 3 P waves followed by one QRST ● Abnormal P waves, normal QRS and T waves ● Regular but rapid ventricular rate
  • 66.
    Atrial Fibrillation ● Atriabeat irregularly at 350-500/minute ● Caused by multiple ectopic foci or circus movement ● Irregular physiological heart block ECG characteristics: ● No P waves (replaced by F waves) ● Normal QRS and T waves, irregular rate ● Complications: Inefficient atrial contraction, blood stagnation, thrombosis risk
  • 67.
    Ventricular Fibrillation ● Causedby multiple ectopic foci or re-entry/circus movements ● Fatal due to loss of ventricular pumping power ECG characteristics: ● Irregular QRS complexes in shape, rhythm, and amplitude ● Indistinguishable waves ● Often follows paroxysmal ventricular tachycardia or occurs during vulnerable period
  • 68.
    The Vulnerable Period ●Short period at end of cardiac repolarization ● Coincides with downslope of T wave ● Dangerous due to varying states of repolarization in cardiac fibers ● Favors re-entry and circus movements ● May lead to ventricular fibrillation
  • 69.
    Mechanisms of CardiacRhythm Alterations ● Abnormal automaticity of SA node ● Changes in slope of prepotential ● Re-entry phenomenon (Circus movement) ● Impulse spreads in circular pathway ● More likely during vulnerable period ● Can be triggered by weak electric shock
  • 70.
    Atrioventricular (AV) Block ●Often due to ischemia of AV nodal or infranodal regions ● Three degrees of severity: ● First-degree heart block ● Second-degree heart block ● Third-degree (complete) heart block
  • 71.
    Bundle Branch Block(BBB) ● Injury to right or left bundle branches ● Commonly due to ischemia ● Causes activation of one ventricle before the other ECG characteristics: ● Prolonged, slurred QRS complexes (>0.12 sec) ● T wave inversion in leads facing affected side ● Right or left axis deviation
  • 72.
    Conclusion ● Arrhythmias arecomplex disturbances in heart rhythm ● Understanding ECG patterns is crucial for diagnosis ● Various mechanisms contribute to different types of arrhythmias ● Proper identification and treatment are essential for patient care ● Continued research and education in this field are vital for improving cardiac health outcomes