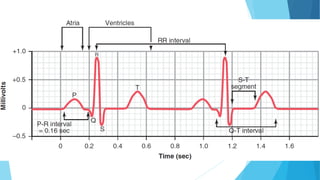
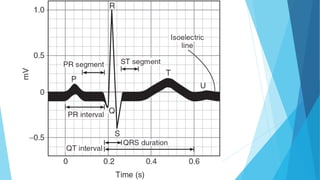
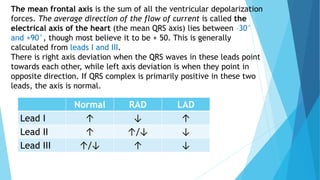
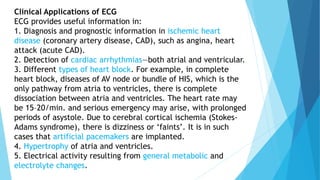
This document discusses the electrocardiogram (ECG) and its components. It begins by describing the myocardial action potential and its phases. It then discusses the pacemaker action potential and ECG waves including the P, QRS, T, and U waves. It explains ECG intervals such as the PR, QT, and ST segments. The document also covers ECG leads, normal values, procedures for recording an ECG, interpreting ECG findings, and clinical applications of the ECG.
Non infarction Q waves
Precise guide for Allied Health Science Students especially cardiac specialty students, DGNM, B.Sc Nursing & M.Sc Nursing Students regarding Non Infarction Q waves
Non infarction Q waves
Precise guide for Allied Health Science Students especially cardiac specialty students, DGNM, B.Sc Nursing & M.Sc Nursing Students regarding Non Infarction Q waves
Biatrial enlargement is diagnosed when criteria for both right and left atrial enlargement are present on the same ECG.
The diagnosis of biatrial enlargement requires criteria for LAE and RAE to be met in either lead II, lead V1 or a combination of leads.
Electrocardiography: is the recording of the electrical impulses that are generated in the heart. These impulses initiate the contraction of cardiac muscles.
Brief Presentation on clinical examination of Respiratory System with Report of Normal case
references:
macleod's clinical examination 13th edition
hutchinson clinical methods
R Alagappan - Manual of Practical Medicine, 4th Edition
Brief Presentation on clinical examination of Cardio Vascular System with Report of Normal case
references:
macleod's clinical examination 13th edition
hutchinson clinical methods
Knee anatomy and clinical tests 2024.pdfvimalpl1234
This includes all relevant anatomy and clinical tests compiled from standard textbooks, Campbell,netter etc..It is comprehensive and best suited for orthopaedicians and orthopaedic residents.
Basavarajeeyam is a Sreshta Sangraha grantha (Compiled book ), written by Neelkanta kotturu Basavaraja Virachita. It contains 25 Prakaranas, First 24 Chapters related to Rogas& 25th to Rasadravyas.
263778731218 Abortion Clinic /Pills In Harare ,sisternakatoto
263778731218 Abortion Clinic /Pills In Harare ,ABORTION WOMEN’S CLINIC +27730423979 IN women clinic we believe that every woman should be able to make choices in her pregnancy. Our job is to provide compassionate care, safety,affordable and confidential services. That’s why we have won the trust from all generations of women all over the world. we use non surgical method(Abortion pills) to terminate…Dr.LISA +27730423979women Clinic is committed to providing the highest quality of obstetrical and gynecological care to women of all ages. Our dedicated staff aim to treat each patient and her health concerns with compassion and respect.Our dedicated group ABORTION WOMEN’S CLINIC +27730423979 IN women clinic we believe that every woman should be able to make choices in her pregnancy. Our job is to provide compassionate care, safety,affordable and confidential services. That’s why we have won the trust from all generations of women all over the world. we use non surgical method(Abortion pills) to terminate…Dr.LISA +27730423979women Clinic is committed to providing the highest quality of obstetrical and gynecological care to women of all ages. Our dedicated staff aim to treat each patient and her health concerns with compassion and respect.Our dedicated group of receptionists, nurses, and physicians have worked together as a teamof receptionists, nurses, and physicians have worked together as a team wwww.lisywomensclinic.co.za/
Integrating Ayurveda into Parkinson’s Management: A Holistic ApproachAyurveda ForAll
Explore the benefits of combining Ayurveda with conventional Parkinson's treatments. Learn how a holistic approach can manage symptoms, enhance well-being, and balance body energies. Discover the steps to safely integrate Ayurvedic practices into your Parkinson’s care plan, including expert guidance on diet, herbal remedies, and lifestyle modifications.
Rasamanikya is a excellent preparation in the field of Rasashastra, it is used in various Kushtha Roga, Shwasa, Vicharchika, Bhagandara, Vatarakta, and Phiranga Roga. In this article Preparation& Comparative analytical profile for both Formulationon i.e Rasamanikya prepared by Kushmanda swarasa & Churnodhaka Shodita Haratala. The study aims to provide insights into the comparative efficacy and analytical aspects of these formulations for enhanced therapeutic outcomes.
Adv. biopharm. APPLICATION OF PHARMACOKINETICS : TARGETED DRUG DELIVERY SYSTEMSAkankshaAshtankar
MIP 201T & MPH 202T
ADVANCED BIOPHARMACEUTICS & PHARMACOKINETICS : UNIT 5
APPLICATION OF PHARMACOKINETICS : TARGETED DRUG DELIVERY SYSTEMS By - AKANKSHA ASHTANKAR
NVBDCP.pptx Nation vector borne disease control programSapna Thakur
NVBDCP was launched in 2003-2004 . Vector-Borne Disease: Disease that results from an infection transmitted to humans and other animals by blood-feeding arthropods, such as mosquitoes, ticks, and fleas. Examples of vector-borne diseases include Dengue fever, West Nile Virus, Lyme disease, and malaria.
These lecture slides, by Dr Sidra Arshad, offer a quick overview of the physiological basis of a normal electrocardiogram.
Learning objectives:
1. Define an electrocardiogram (ECG) and electrocardiography
2. Describe how dipoles generated by the heart produce the waveforms of the ECG
3. Describe the components of a normal electrocardiogram of a typical bipolar lead (limb II)
4. Differentiate between intervals and segments
5. Enlist some common indications for obtaining an ECG
6. Describe the flow of current around the heart during the cardiac cycle
7. Discuss the placement and polarity of the leads of electrocardiograph
8. Describe the normal electrocardiograms recorded from the limb leads and explain the physiological basis of the different records that are obtained
9. Define mean electrical vector (axis) of the heart and give the normal range
10. Define the mean QRS vector
11. Describe the axes of leads (hexagonal reference system)
12. Comprehend the vectorial analysis of the normal ECG
13. Determine the mean electrical axis of the ventricular QRS and appreciate the mean axis deviation
14. Explain the concepts of current of injury, J point, and their significance
Study Resources:
1. Chapter 11, Guyton and Hall Textbook of Medical Physiology, 14th edition
2. Chapter 9, Human Physiology - From Cells to Systems, Lauralee Sherwood, 9th edition
3. Chapter 29, Ganong’s Review of Medical Physiology, 26th edition
4. Electrocardiogram, StatPearls - https://www.ncbi.nlm.nih.gov/books/NBK549803/
5. ECG in Medical Practice by ABM Abdullah, 4th edition
6. Chapter 3, Cardiology Explained, https://www.ncbi.nlm.nih.gov/books/NBK2214/
7. ECG Basics, http://www.nataliescasebook.com/tag/e-c-g-basics
3. Myocardial action potential
Phase 0 = rapid upstroke and depolarization—voltage-
gated Na+ channels open.
Phase 1 = initial repolarization—inactivation of voltage-
gated Na+ channels. Voltage-gated K+ channels begin
to open.
Phase 2 = plateau—Ca2+ influx through voltage-gated
Ca2+ channels balances K+ efflux. Ca2+ influx triggers
Ca2+ release from sarcoplasmic reticulum and myocyte
contraction.
Phase 3 = rapid repolarization—massive K+ efflux due to
opening of voltage-gated slow K+ channels and closure
of voltage-gated Ca2+ channels.
Phase 4 = resting potential—high K+ permeability
through K+ channels.
4.
5. Top, Monophasic action potential from a ventricular muscle fiber
Bottom, Electrocardiogram recorded simultaneously.
6. Pacemaker action potential
Occurs in the SA and AV nodes. Key differences from the
ventricular action potential include:
Phase 0 = upstroke—opening of voltage-gated Ca2+
channels. Fast voltage-gated Na+ channels are permanently
inactivated. Results in a slow conduction velocity that is
used by the AV node to prolong transmission from the atria
to ventricles.
Phases 1 and 2 are absent.
Phase 3 = inactivation of the Ca2+ channels and ↑
activation of K+ channels → ↑K+ efflux.
Phase 4 = slow spontaneous diastolic depolarization due to
If (“funny current”). If channels responsible for a slow,
mixed Na+/K+ inward current. Accounts for automaticity of
SA and AV nodes. The slope of phase 4 in the SA node
determines HR.
11. Transmission of the cardiac impulse through the heart,
showing the time of appearance
12.
13. P wave. Commonly called the “atrial complex”, represents the start of depolarization at the SA node
(the first part of the heart to be depolarized), and depolarization of atria. Normally, it is upwards
except in lead aVR where it is inverted. Duration = 0.11 sec; Amplitude = usually less than 2.5 mm.
QRS complex (Ventricular complex). The QRS complex represents ventricular depolarization.
Duration = less than 0.08 sec (maximum=0.12 sec), i.e. 2 small squares. Amplitude = 1.5 – 2 mV
The Q wave is the first negative wave after P wave and represents excitation of upper
interventricular septum. It is often inconspicuous.
The R wave is the first prominent positive wave after P wave. It represents excitation of major part
of myocardium.
The S wave, the negative wave after R, represents activation of posterior basal part of
ventricles. (These three waves represent three instantaneous vectors ). If the entire QRS
complex is negative, it is called QS complex.
T wave. This wave is due to ventricular repolarization. Normally, it is in the same
direction as the QRS complex because repolarization follows a path that is opposite to
that of depolarization, i.e. it occurs from epicardium to endocardium. (One of the
reasons for this is that the endocardial areas have a longer period of contraction and are
thus slow to repolarize).
U wave. The U wave is seen just after the T wave in some individuals. It is due possibly
to slow repolarization of the intraventricular contracting system (papillary muscles).
14.
15.
16. P-R segment. It extends from the end of P wave to the start of
QRS complex and is usually isoelectric.
J point. The J point occurs at the end of QRS complex. At this
point, the entire ventricular muscle is depolarized. Normally, the
J point is on the isoelectric line but it is displaced up or down by
the current of injury resulting from myocardial ischemia or
infarction.
ST Segment. This segment extends from the J point to the onset
of T wave. Normally it is isoelectric but may vary from + 0.5 to +
2.0 mm in chest leads. Elevation or depression of ST segment (due
to current of injury), indicates myocardial damage. (Since the
current of injury continues to flow during diastole of the heart
(TP interval), it shifts the zero potential line (drawn through the J
point) up or down, giving the impression of elevation or
depression of the ST segment.
During the ST segment interval, the entire ventricular
myocardium is depolarized.
17. PR or PQ Interval if Q wave is present. It is the interval
between the beginning of P wave to the start of QRS
complex It is a measure of atriovenrtricular (AV)
conduction time, ie, the time taken by the excitatory wave
to pass from the atria to the ventricles, including the delay
at the AV node. Thus it indicates the conduction time of
the bundle of HIS which connects the atria and the
ventricles. The AV node is activated at the top of P wave.
Normal duration = 0.12–0.2 sec. depending on the heart
rate. The PR interval is prolonged in various types of heart
block.
18. ST interval. It is measured from the end of S wave to the end
of T wave. It represents the ventricular repolarization.
Duration = 0.32 sec.
TP segment. It is measured from the end of T wave to
beginning of the next P wave.
Duration = 0.2 sec (depending inversely on heart rate.
PP interval. It is the interval between beginning or peaks of
two successive P waves.
RR interval. This is the interval between the peaks of two
successive R waves. It is measured for calculating heart rate
(ventricular rate).
19. QT interval. It is measured from the beginning of Q (or R
wave) to the end of T wave.
Duration = 0.40 to 0.43 sec. It represents ventricular
depolarization and repolarization. It corresponds to the
duration of electrical systole.
QT interval varies with Heart Rate
Therefore corrected QT interval (QTc) is measured by
using Bazett’s formula
QTc =
𝑄𝑇
𝑅𝑅
20. Electrocardiographic Leads
The term lead is used for the specific points of
electrical contacts, as well as the actual record
obtained from any two points.
Two types of leads can be employed:
Direct leads. they are applied directly to the exposed
heart, as during heart surgery, or during an
experiment.
Indirect leads. These are applied away from the
heart, ie, on the skin surface They are limb leads,
chest leads, and esophageal lead. These leads are
used in routine ECG procedures.
21. Electrode Positions
The ECG leads (electrodes) are of two types:
bipolar and unipolar.
In bipolar leads, the potential difference is
recorded between two active electrodes.
In unipolar leads, one electrode is kept at zero
potential while the other is the exploring
electrode.
22. Bipolar limb leads (Standard leads or “classical” limb leads)
These were the earliest leads to be used (Wilhelm Einthoven of
Leyden, 1860–1927). These leads measure the potential using two
active electrodes placed on any two limbs and represent the
algebraic sum of the potentials of two constituent active
(electrodes) leads.
There are three bipolar limb leads:
a. Lead I. It records the potential at the left arm (LA) minus the
potential at the right arm (RA), or LA–RA (left arm positive) .
b. Lead II. is the potential at the left leg (LL) minus the potential at
right arm (RA), or LL–RA (left leg positive).
c. Lead III. This leads records the potential at the left leg (LL) minus
the potential at the left arm (LA), or LL–LA (left leg positive).
25. Einthoven’s Law. Einthoven’s law states that if the ECGs
are recorded simultaneously with the three limb leads, the
sum of the potentials recorded in leads I and III will equal
the potential in lead II.
Lead I potential Lead III potential + = Lead II potential
Einthoven Triangle
the two shoulders and the left leg (left foot) form the apices
of an equilateral triangle – the Einthoven triangle – that
surrounds the heart. The heart is thus placed approximately
in the center of a volume conductor. Lines that bisect each
side of the triangle (i.e. at the zero axis of each side, where
the potential is zero at all times), meet the center of the
triangle at the heart.
26. Unipolar leads
These leads record the potential from a single
region of the body (limbs or chest). One electrode,
the indifferent electrode, is kept at zero potential
by connecting the three limb leads to a common
central terminal in the machine where the currents
from the limbs neutralize each other. The other
electrode can be on a limb or on the chest. Thus,
there are three such limb leads and a number of
chest leads.
27. Unipolar limb leads
Any of the limb electrodes can be used to record
cardiac potentials in comparison to the indifferent
electrode kept at zero potential. Thus, there are
three limb leads, each denoted by the letter V
(vector)—VR, VL, VF (left foot).
Augmented limb leads. Since the recorded
voltages are small. indifferent electrode is
connected through high resistance to other two
electrodes, Thus, the augmented limb leads are :
aVR= between RA and (LA+LL); aVL = between LA
and (RA+LL); and aVF = between LL and (RA+LA).
V=IxR
28.
29. Unipolar chest leads (also called unipolar
precordial leads).
These leads record the potentials from the
anterior surface of the heart, from the right
side to the left side of the chest, in relation
to the indifferent electrode (RA + LA + LL).
Esophageal leads
E18, E20
30.
31. The mean frontal axis is the sum of all the ventricular depolarization
forces. The average direction of the flow of current is called the
electrical axis of the heart (the mean QRS axis) lies between –30°
and +90°, though most believe it to be + 50. This is generally
calculated from leads I and III.
There is right axis deviation when the QRS waves in these leads point
towards each other, while left axis deviation is when they point in
opposite direction. If QRS complex is primarily positive in these two
leads, the axis is normal.
Normal RAD LAD
Lead I ↑ ↓ ↑
Lead II ↑ ↑/↓ ↓
Lead III ↑/↓ ↑ ↓
32.
33.
34.
35.
36.
37. The standardized sites for the unipolar chest leads are as
follows:
V1 is in the 4th intercostal space (ICS), just to the right of the
sternum
V2 is in the 4th ICS, just to the left of the sternum
V3 is halfway between V2 and V4
V4 is at the midclavicular line in the 5th ICS
V5 is in the anterior axillary line at the same level as V4
V6 is in the mid-axillary line in the same level as V4 (5th ICS)
V7 is in the posterior axillary line in the 5th ICS
V8 is on the infrascapular line, just below the angle of the
scapula.
38.
39.
40.
41.
42.
43. QTc prolongation (ms) Men Women
Normal ≤ 430 ≤ 450
Borderline 431-450 451-470
Abnormal > 450 > 470
QTcB =
𝑄𝑇(𝑠)
𝑅𝑅(𝑠)
Bazett's formula
QTcF =
𝑄𝑇(𝑠)
3
𝑅𝑅(𝑠)
Fridericia's formula
44. Normal values for waves and intervals are as follows:
RR interval: 0.6-1.2 seconds
P wave: 80 milliseconds
PR interval: 120-200 milliseconds
PR segment: 50-120 milliseconds
QRS complex: 80-100 milliseconds
J-point: N/A
ST segment: 80-120 milliseconds
T wave: 160 milliseconds
ST interval: 320 milliseconds
QT interval: 420 milliseconds or less if heart rate is
60 beats per minute (bpm)
References
Schlant RC, Adolph RJ, DiMarco JP, Dreifus LS, Dunn MI, Fisch C, et al. Guidelines for electrocardiography.
A report of the American College of Cardiology/American Heart Association Task Force on Assessment of
Diagnostic and Therapeutic Cardiovascular Procedures (Committee on Electrocardiography). Circulation.
45. PROCEDURE
1. Ask the subject to lie down supine on the bed and be comfortable and
relaxed, no electronic gadgets with the subject.
2. Check that the ECG machine is properly earthed. Rub small amounts of
electrolyte jelly on the fronts of wrists and just above the ankles.
3. Apply the limb electrodes firmly on these points and fix them in place
with rubber straps. Fix the lead wires, identified with the letters- RA, LA,
LL, and RL electrodes. Connect the connector cable to the machine.
4. Switch on the machine and “center” the stylus (pen); run the paper
and, using the CAL (calibration) push the button 2–3 times and adjust the
pen deflection to 10 mm.
5. Using the lead selector switch, record 4–6 ECG complexes in the
standard order—leads I, II, III, aVR, aVL, aVF—in this order. (Figure 2-18)
6. Stop the machine and apply the electrode jelly on the chest positions
for V1 to V6. Using the chest electrode, record the ECG from these
positions one after the other.
7. Tear off the paper from the machine and label the various leads. Note
down the name of the person and date.
46. 1. Heart rate. It can be determined by any of the following
method:
a. By dividing 1500 by the number of small squares between 2
successive R waves.
(1500 small squares represent 1 minute)
For example, number of small squares between 2 R waves = 21
Heart rate = 1500/21 = 70 per min.
2. Rhythm. In normal sinus rhythm, P waves precede each QRS
complex. Atrial, junctional and ventricular arrhythmias are
detected by in-hospital and ambulatory ECG monitoring.
3. Mean cardiac vector. Evaluation of the frontal plane QRS axis
provides the information.
4. Morphology of various waves, intervals, and segments are
carefully studied.
57. Clinical Applications of ECG
ECG provides useful information in:
1. Diagnosis and prognostic information in ischemic heart
disease (coronary artery disease, CAD), such as angina, heart
attack (acute CAD).
2. Detection of cardiac arrhythmias—both atrial and ventricular.
3. Different types of heart block. For example, in complete
heart block, diseases of AV node or bundle of HIS, which is the
only pathway from atria to ventricles, there is complete
dissociation between atria and ventricles. The heart rate may
be 15–20/min. and serious emergency may arise, with prolonged
periods of asystole. Due to cerebral cortical ischemia (Stokes-
Adams syndrome), there is dizziness or ‘faints’. It is in such
cases that artificial pacemakers are implanted.
4. Hypertrophy of atria and ventricles.
5. Electrical activity resulting from general metabolic and
electrolyte changes.
58. Special Uses of ECG
1. In-hospital ECG monitoring. Cardiac arrest or
severe arrhythmia patients who are shifted to the
hospital need special care.
2. Ambulatory ECG monitoring (Holter). Patients
with episodic palpitation and dizziness or
unstable angina, are given a Holter monitor to
wear for 24 hours. Analysis of the recorded tape
often identifies the cause of the condition.
3. Exercise ECG. The ECG recorded during
exercise (Treadmill test, TMT), as per Bruce
protocol in otherwise normal. Arrhythmias and ST
segment changes are more likely to be detected
during TMT
59. Causes of ST Segment Elevation
1. Coronary vasospasm (Prinzmetal’s angina)
2. Organic stenosis of coronary arteries (MI)
3. LV aneurysm
4. Pericarditis (elevated concave upwards S-T segment
associated with tall, peaked T-waves and no
reciprocal changes in the opposite leads)
5. Early repolarisation.
68. 4. Waves, Segments & Intervals
Waves Duration(s) Amplitude(mV) Comment
P Wave ? ? Normal
QRS Complex ? ? Normal
T Wave ? ? Normal
U Wave ? ? Normal
Segment Duration(s) Comment
PR segment ? Normal
ST segment ? Isoelectric
69. Interval Duration(s) Comment
PR interval ? Normal
ST interval ? Normal
RR interval ? Normal
QT interval ? Normal
QTc =
𝑄𝑇(𝑠)
𝑅𝑅(𝑠)
? Normal
Report: ECG of the given subject appears Normal
70. QTc prolongation (ms) Men Women
Normal ≤ 430 ≤ 450
Borderline 431-450 451-470
Abnormal > 450 > 470
QTcB =
𝑄𝑇(𝑠)
𝑅𝑅(𝑠)
Bazett's formula
QTcF =
𝑄𝑇(𝑠)
3
𝑅𝑅(𝑠)
Fridericia's formula
71.
72. Diagrammatic illustration of serial electrocardiographic patterns in anterior infarction.
A) Normal tracing. B) Very early pattern (hours after infarction). C) Later pattern (many
hours to a few days D) Late established pattern (many days to weeks E) Very late pattern:
This may occur many months to years after the infarction.
73. Diagrammatic illustration of serial electrocardiographic patterns in anterior infarction.
A) Normal tracing. B) Very early pattern (hours after infarction). C) Later pattern (many
hours to a few days D) Late established pattern (many days to weeks E) Very late pattern:
This may occur many months to years after the infarction.
74. Diagrammatic illustration of serial electrocardiographic patterns in anterior infarction.
A) Normal tracing. B) Very early pattern (hours after infarction). C) Later pattern (many
hours to a few days D) Late established pattern (many days to weeks E) Very late pattern:
This may occur many months to years after the infarction.
75.
76.
77.
78. Normal values for waves and intervals are as follows:
RR interval: 0.6-1.2 seconds
P wave: 80 milliseconds
PR interval: 120-200 milliseconds
PR segment: 50-120 milliseconds
QRS complex: 80-100 milliseconds
J-point: N/A
ST segment: 80-120 milliseconds
T wave: 160 milliseconds
ST interval: 320 milliseconds
QT interval: 420 milliseconds or less if heart rate is
60 beats per minute (bpm)
References
Schlant RC, Adolph RJ, DiMarco JP, Dreifus LS, Dunn MI, Fisch C, et al. Guidelines for electrocardiography.
A report of the American College of Cardiology/American Heart Association Task Force on Assessment of
Diagnostic and Therapeutic Cardiovascular Procedures (Committee on Electrocardiography). Circulation.
79.
80.
81.
82.
83.
84.
85.
86.
87.
88.
89.
90. Myocardial action potential
Phase 0 = rapid upstroke and depolarization—voltage-
gated Na+ channels open.
Phase 1 = initial repolarization—inactivation of voltage-
gated Na+ channels. Voltage-gated K+ channels begin
to open.
Phase 2 = plateau—Ca2+ influx through voltage-gated
Ca2+ channels balances K+ efflux. Ca2+ influx triggers
Ca2+ release from sarcoplasmic reticulum and myocyte
contraction.
Phase 3 = rapid repolarization—massive K+ efflux due to
opening of voltage-gated slow K+ channels and closure
of voltage-gated Ca2+ channels.
Phase 4 = resting potential—high K+ permeability
through K+ channels.
91.
92.
93.
94.
95.
96.
97.
98.
99.
100.
101.
102.
103.
104.
105.
106.
107.
108.
109.
110.
111.
112.
113.
114.
115.
116. HIS BUNDLE ELECTROGRAM
The record of the electrical activity obtained with the catheter is the His bundle
electrogram (HBE).
It normally shows an A deflection when the AV node is activated, an H spike during
transmission through the His bundle, and a V deflection during ventricular
depolarization.
With the HBE and the standard electrocardiographic leads, it is possible to time three
intervals accurately:
(1) the PA interval, the time from the first appearance of atrial depolarization to the A
wave in the HBE, which represents conduction time from the SA node to the AV
node;
(2) the AH interval, from the A wave to the start of the H spike, which represents the
AV nodal conduction time; and
(3) the HV interval, the time from the start of the H spike to the start of the QRS
deflection in the ECG, which represents conduction in the bundle of His and the
bundle branches.
The approximate normal values for these intervals in adults are PA, 27 ms; AH, 92 ms;
and HV, 43 ms. These values illustrate the relative slowness of conduction in the AV
node.
117.
118. Delta waves seen in
a) Brugada syndrome
b) Hypothermia
c) Torsades de pointes
d) WPW Syndrome
Editor's Notes
Diagrammatic illustration of serial electrocardiographic patterns in anterior infarction. A) Normal tracing. B) Very early pattern (hours after infarction): ST segment elevation in I, aVL, and V3–6; reciprocal ST depression in II, III, and aVF. C) Later pattern (many hours to a few days): Q waves have appeared in I, aVL, and V5–6. QS complexes are present in V3–4. This indicates that the major transmural infarction is underlying the area recorded by V3–4; ST segment changes persist but are of lesser degree, and the T waves are beginning to invert in the leads in which the ST segments are elevated. D) Late established pattern (many days to weeks): The Q waves and QS complexes persist, the ST segments are isoelectric, and the T waves are symmetric and deeply inverted in leads that had ST elevation and tall in leads that had ST depression. This pattern may persist for the remainder of the patient’s life. E) Very late pattern: This may occur many months to years after the infarction. The abnormal Q waves and QS complexes persist. The T waves have gradually returned to normal.
Lateral wall mi
Calculate Heart rate
Acute pericarditis with diffuse ST elevations in I, II, III, aVF, V3–V6, without T-wave inversions. Also note concomitant PR-segment elevation in aVR and PR depression in the inferolateral leads.
In patients with heart block, the electrical events in the AV node, bundle of His, and Purkinje system are frequently studied with a catheter containing an electrode at its tip that is passed through a vein to the right side of the heart and manipulated into a position close to the tricuspid valve. Three or more standard electrocardiographic leads are recorded simultaneously.