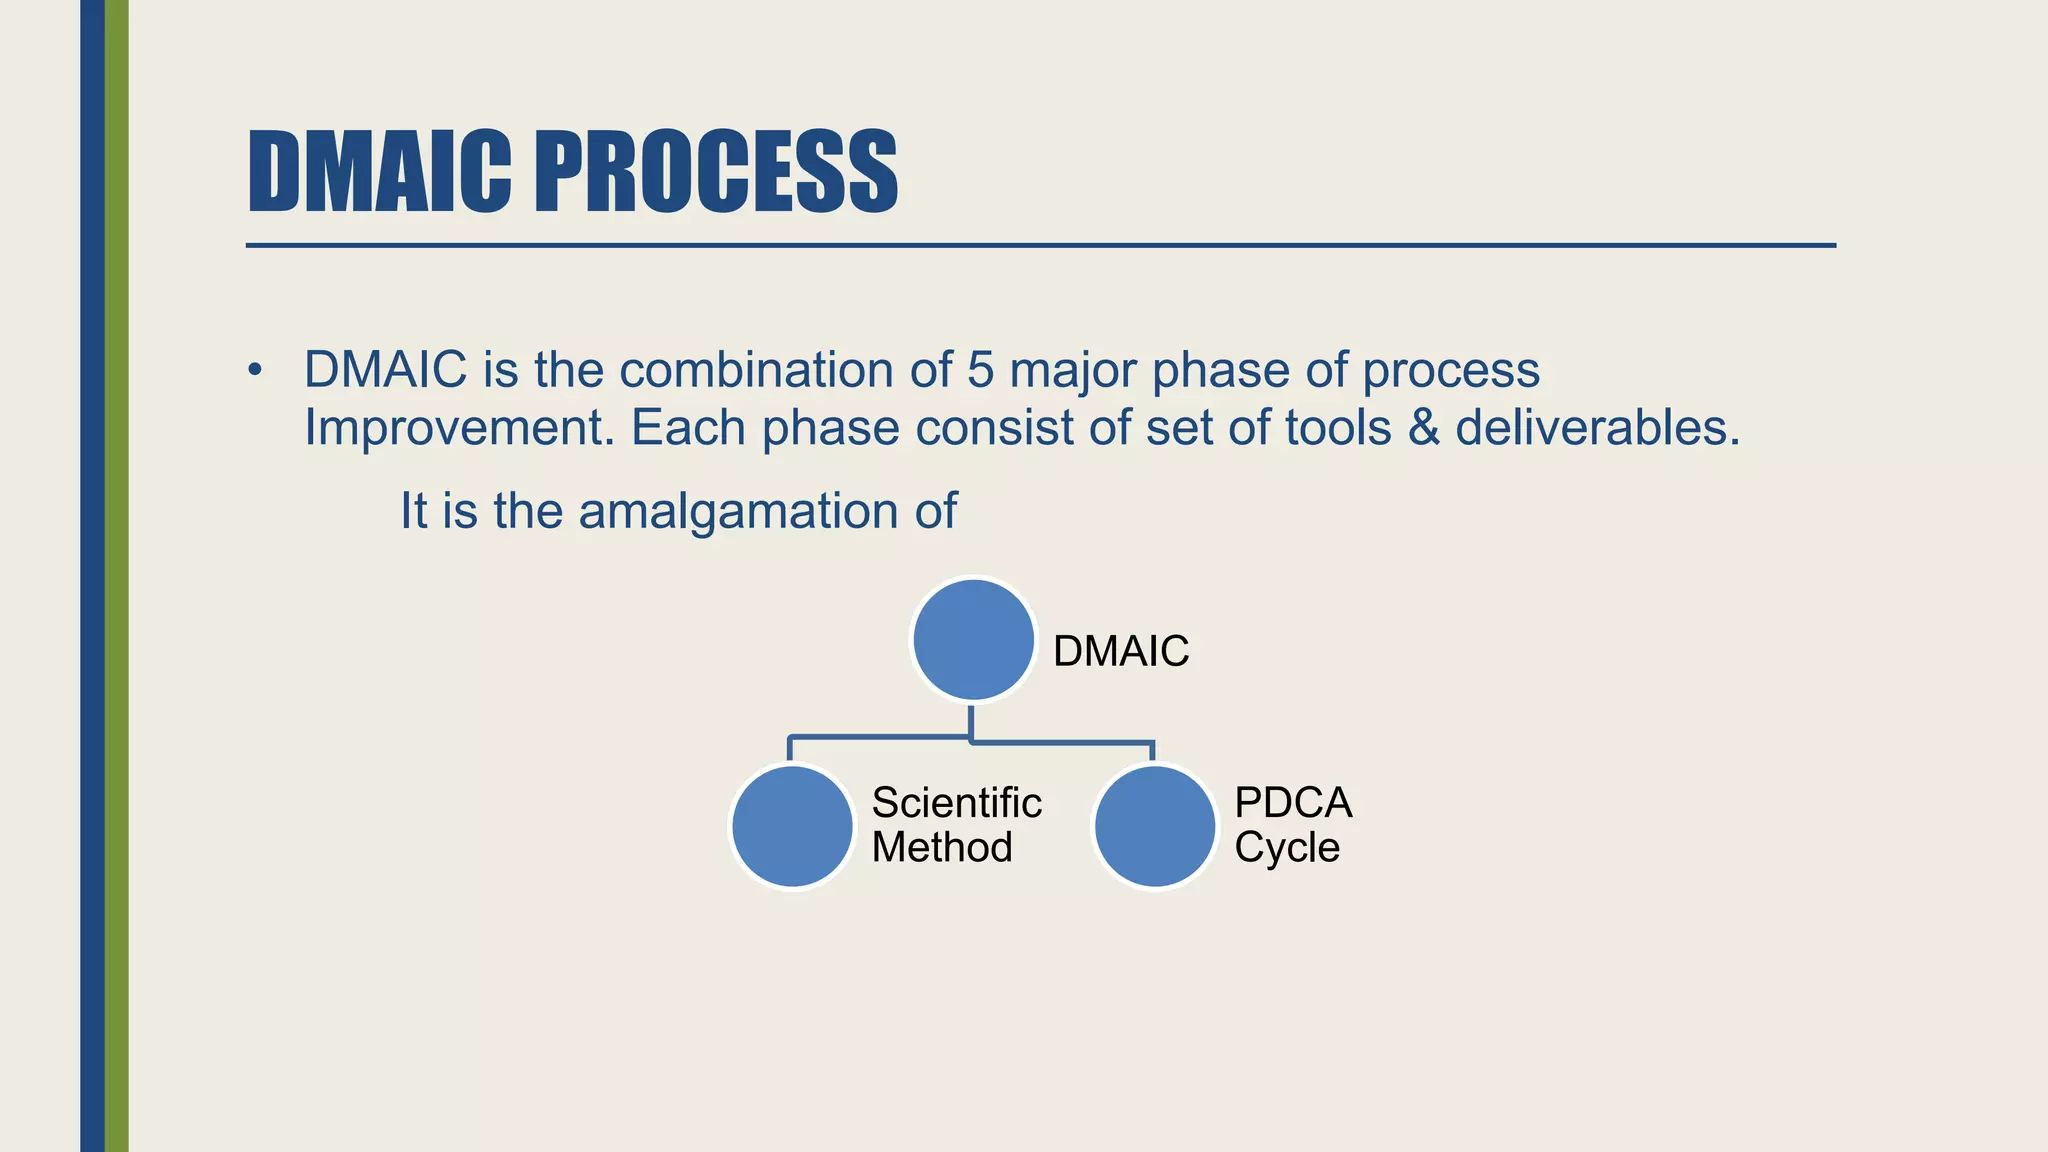
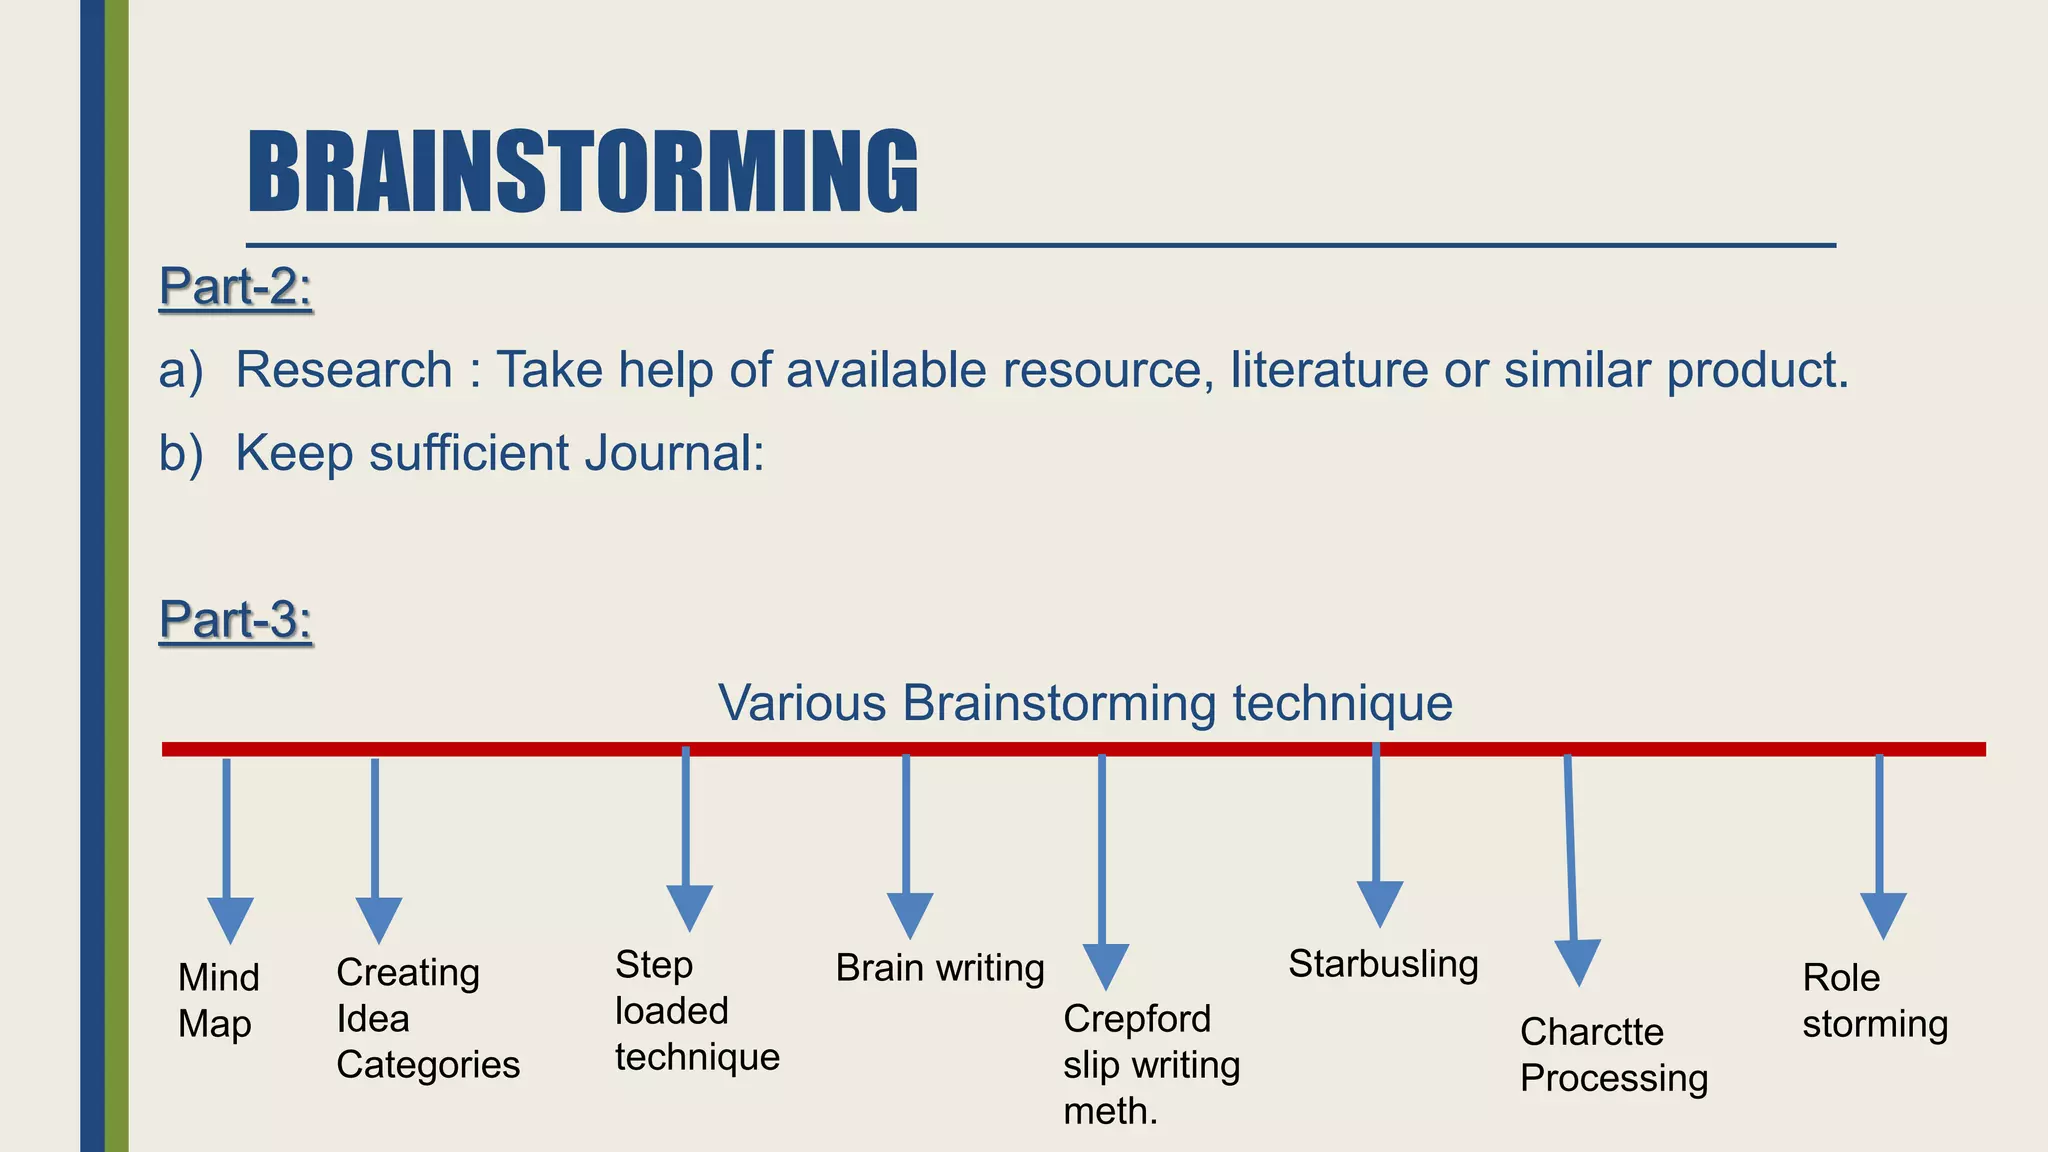
The document provides an introduction to the DMAIC process used in Six Sigma. It consists of 5 phases: Define, Measure, Analyze, Improve, and Control. Each phase involves specific tasks and tools. Define involves identifying problems and goals. Measure establishes baselines. Analyze identifies root causes using tools like fishbone diagrams. Improve develops and tests solutions. Control institutionalizes improvements through control charts and process ownership. Tools across phases include brainstorming, control charts, Pareto charts, and more to systematically solve quality problems.
![DMAIC
• DMAIC refers to data driven improvement cycle used for
improving, Optimizing, Stabilizing business process & design.
• Define:
Basically we try to articulated in different phase.
• Business Problem
• Our Goal
• Potential Resources [which we can utilize].
• Project Scope.
So, What we Try to define:
• Problem [why we initial a project]
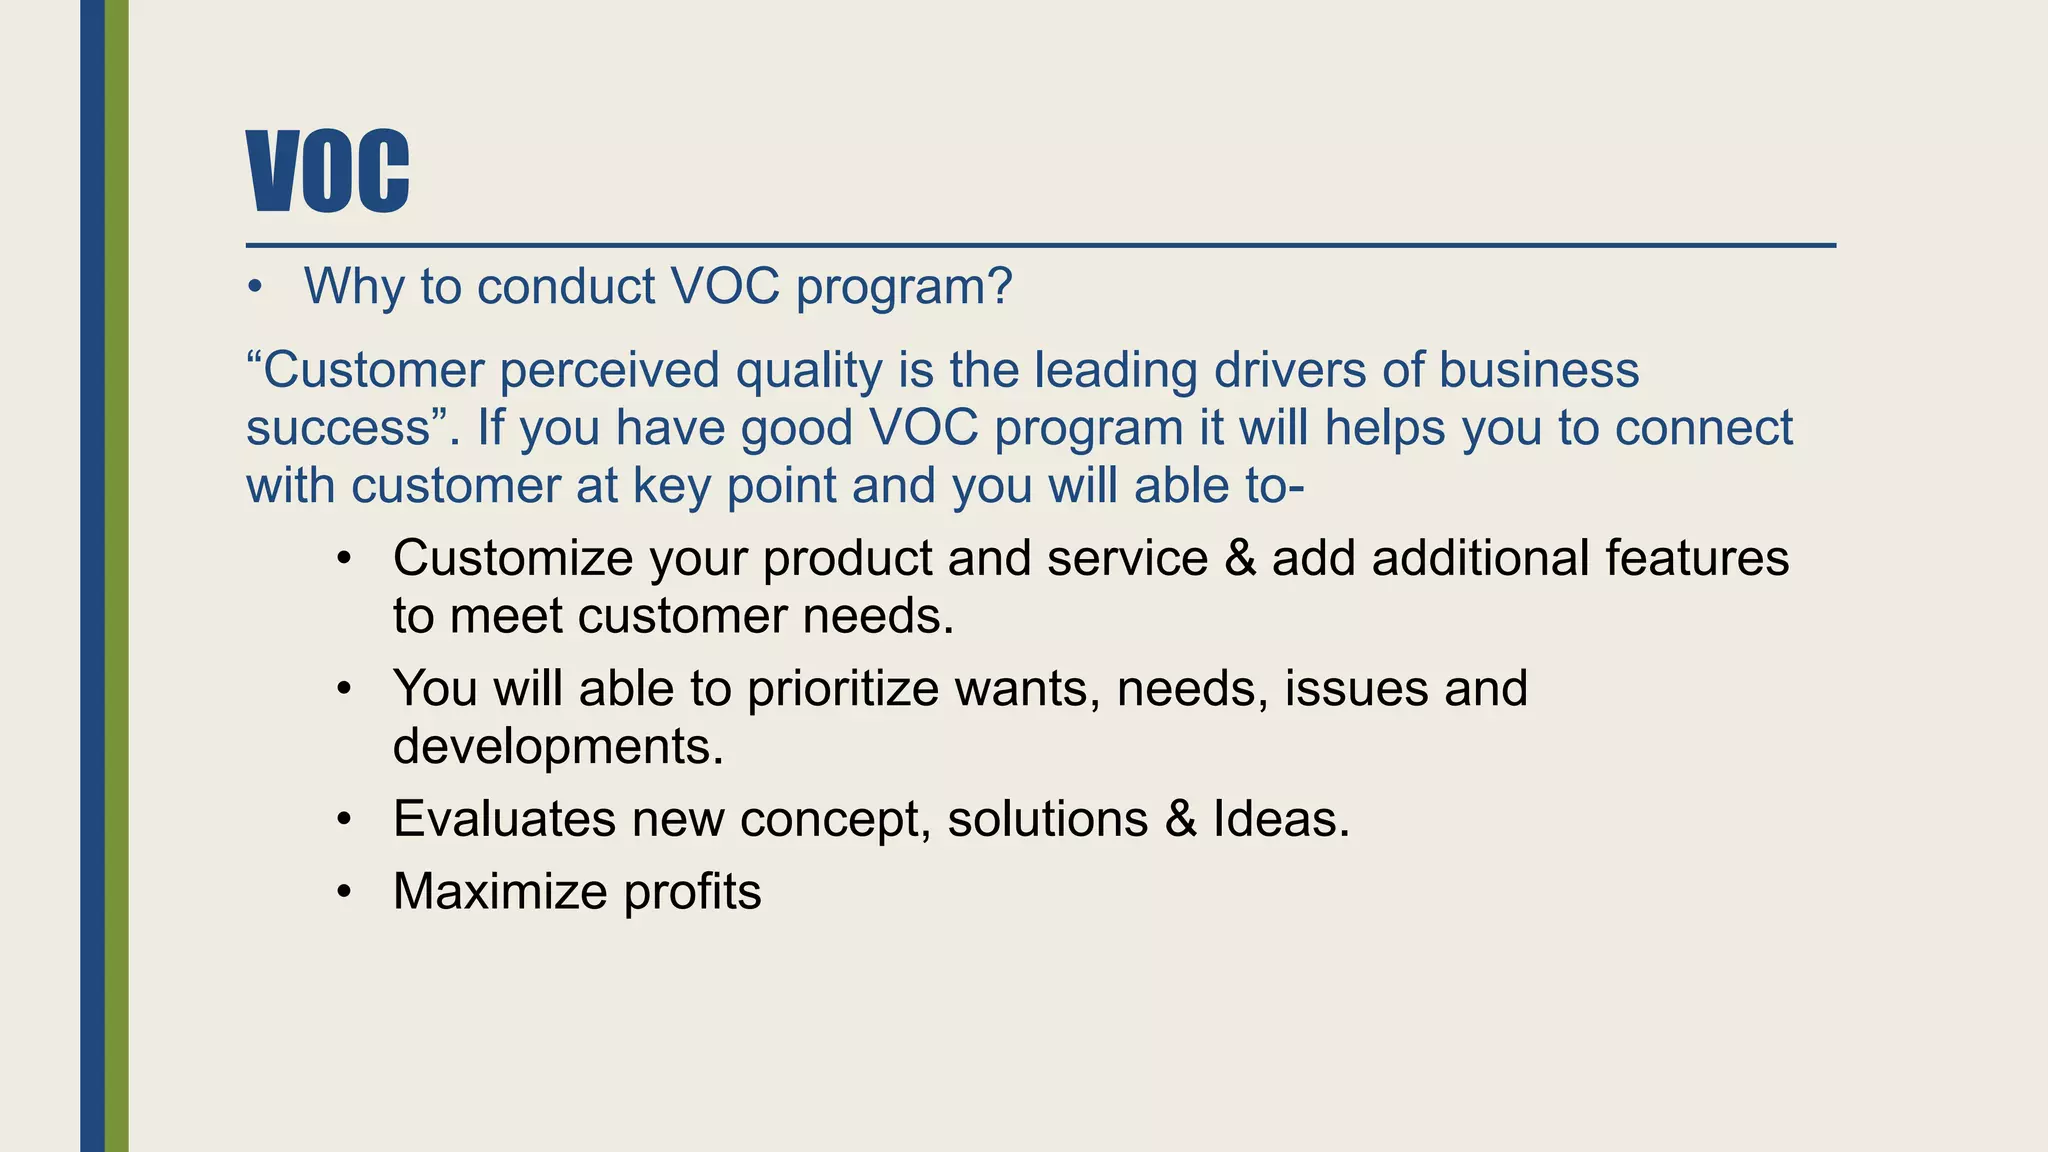
• Customer [What kinds of Product & Service are required by the customer].
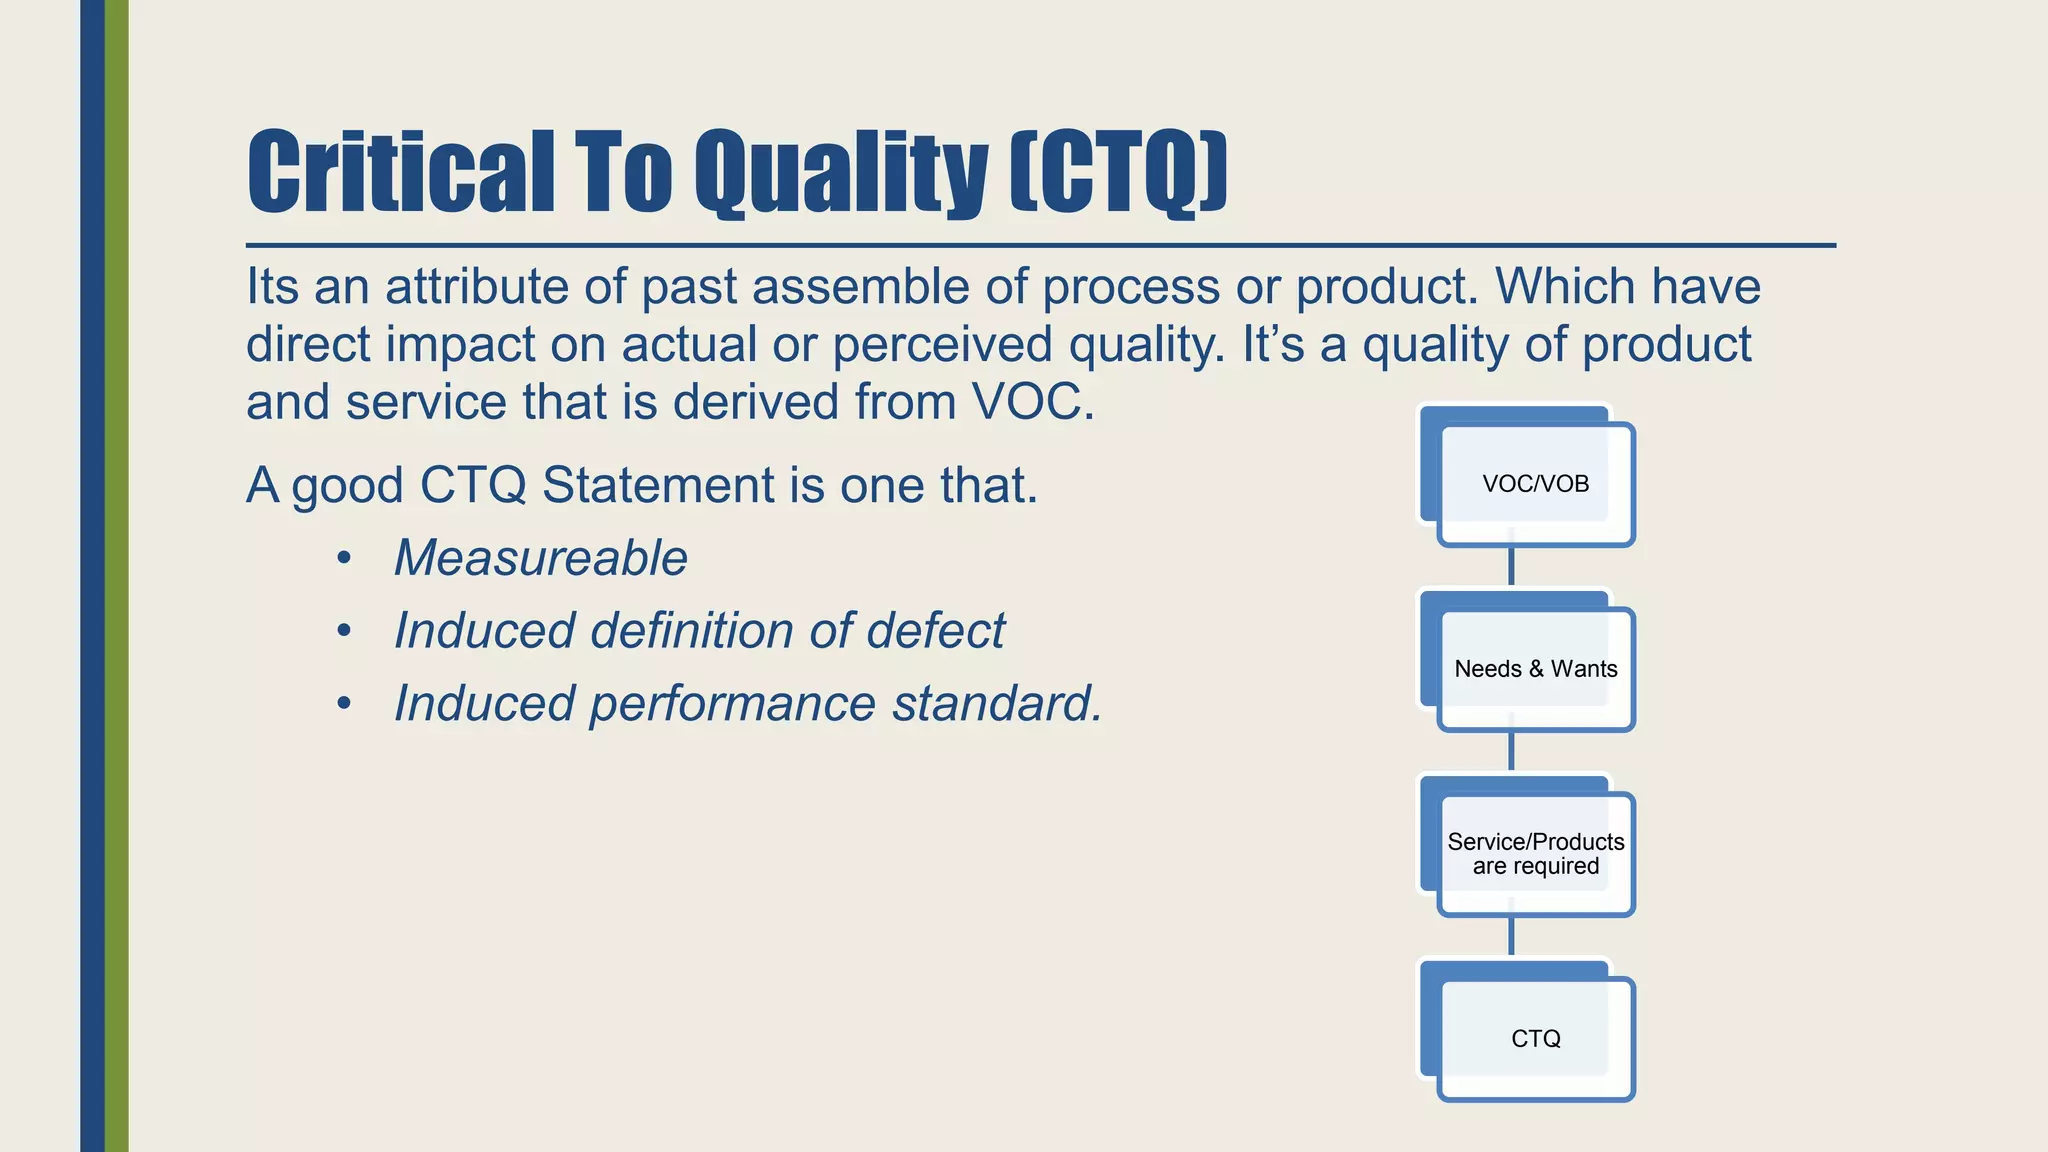
• What are critical process output [i.e what is CTQ & VOC]
• Target business process.
• Scope of project.](https://image.slidesharecdn.com/introductiontodmaictraining-190407042152/75/Introduction-to-DMAIC-Training-10-2048.jpg)

![IMPROVE PHASE
Purpose of this step is to identify test & implement a solution to the
problem. Whether in part in a whole. In this step team tries to find
ways to do things better cheaper & faster.
For this?
-------------------------------
Creative solution are identified to eliminate key
root causes so that process problem can be
prevented or fixed.
Tools which are to be used:
• Brainstorming
• Six thinking hate
• Random words
• DOE [design of experiment]
In nut shell:
--------------------------------
• Team should come up with innovative solutions.
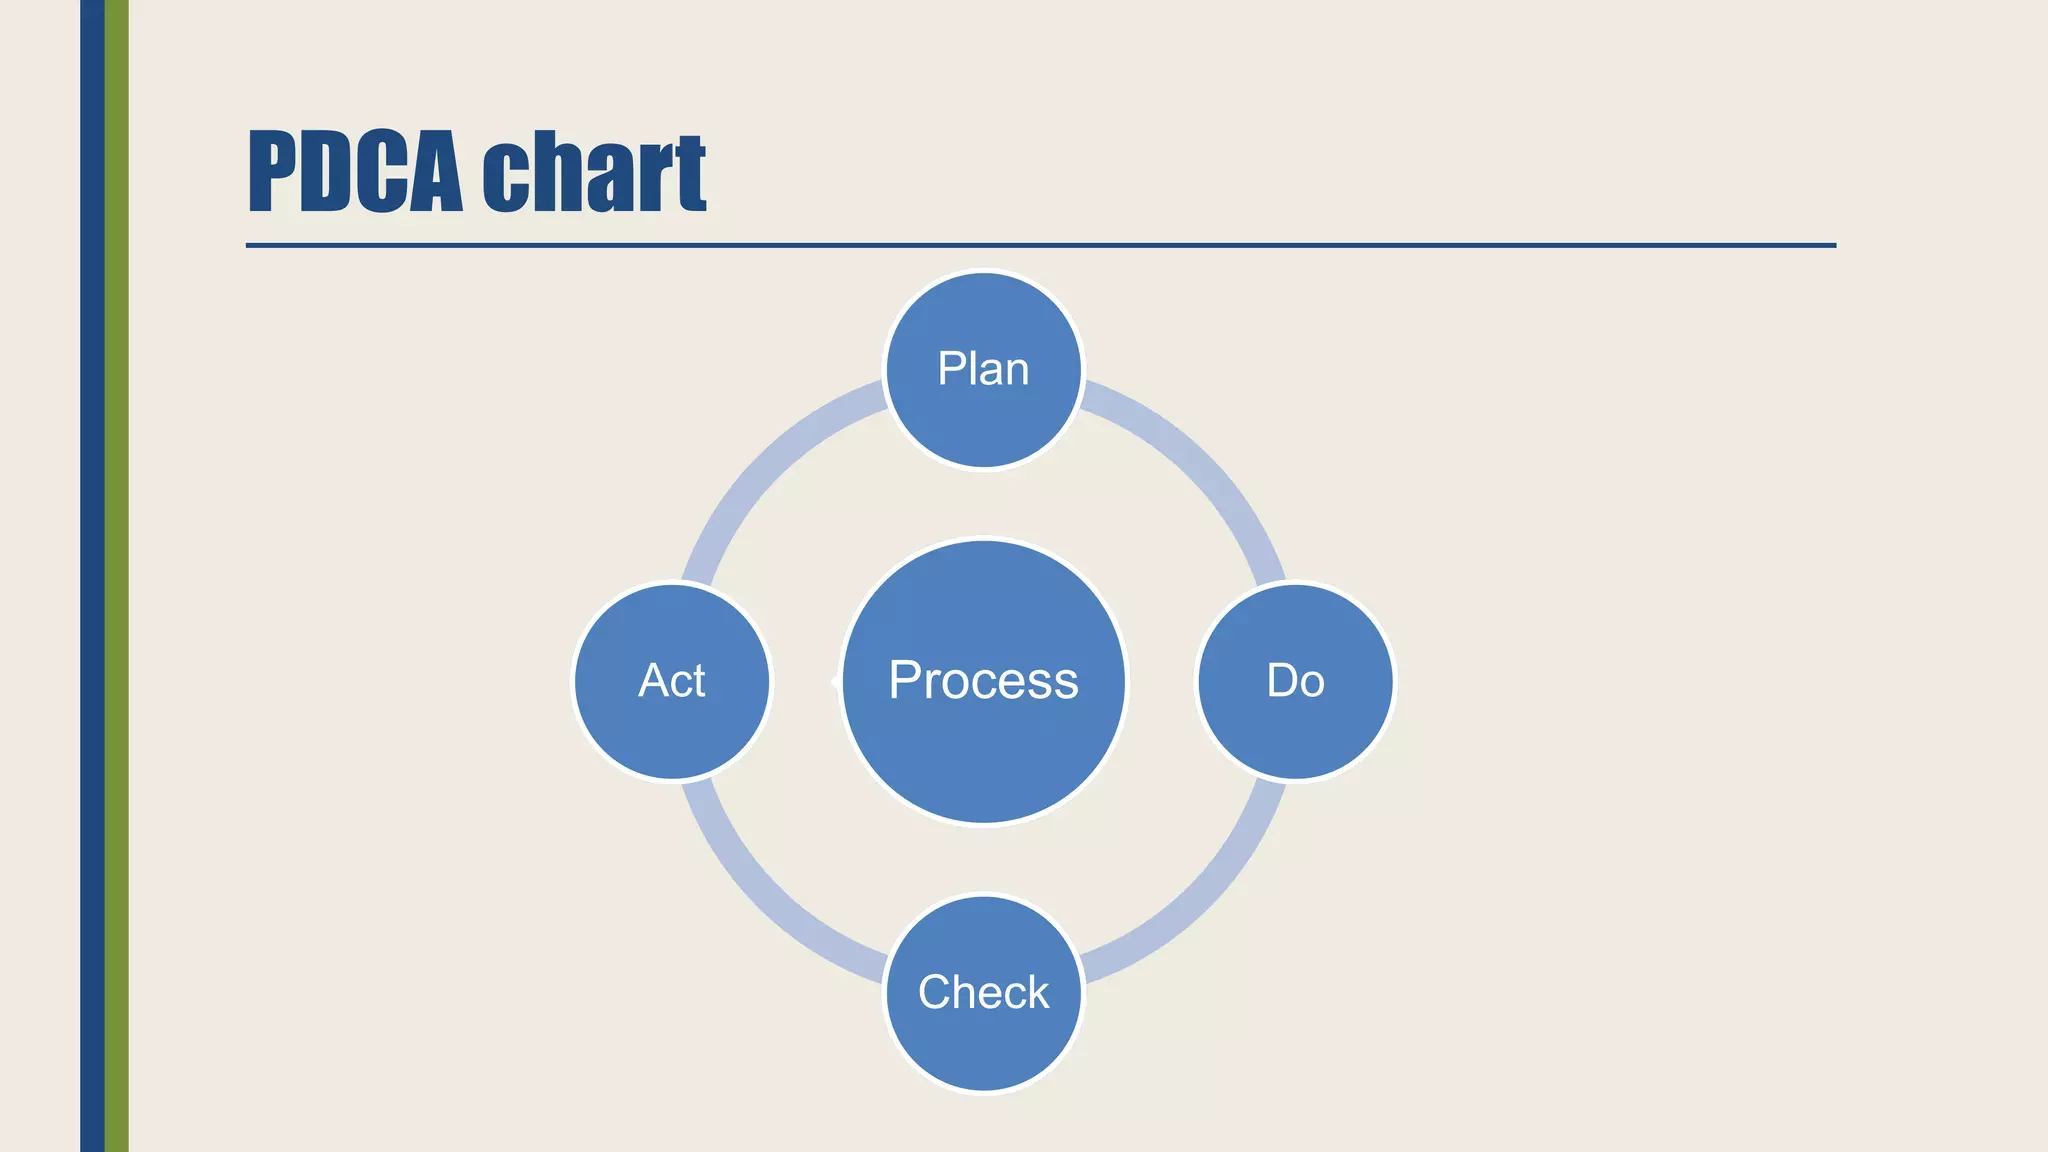
• First focus on simplest or easiest solution.
• Solution should be Checked using a PDCA
cycle.
• Based on this results which we get from PDCA,
voidable risk should be anticipated.
• Detailed implemented plan should be created.
• Implemented plan should be deployed.](https://image.slidesharecdn.com/introductiontodmaictraining-190407042152/75/Introduction-to-DMAIC-Training-20-2048.jpg)
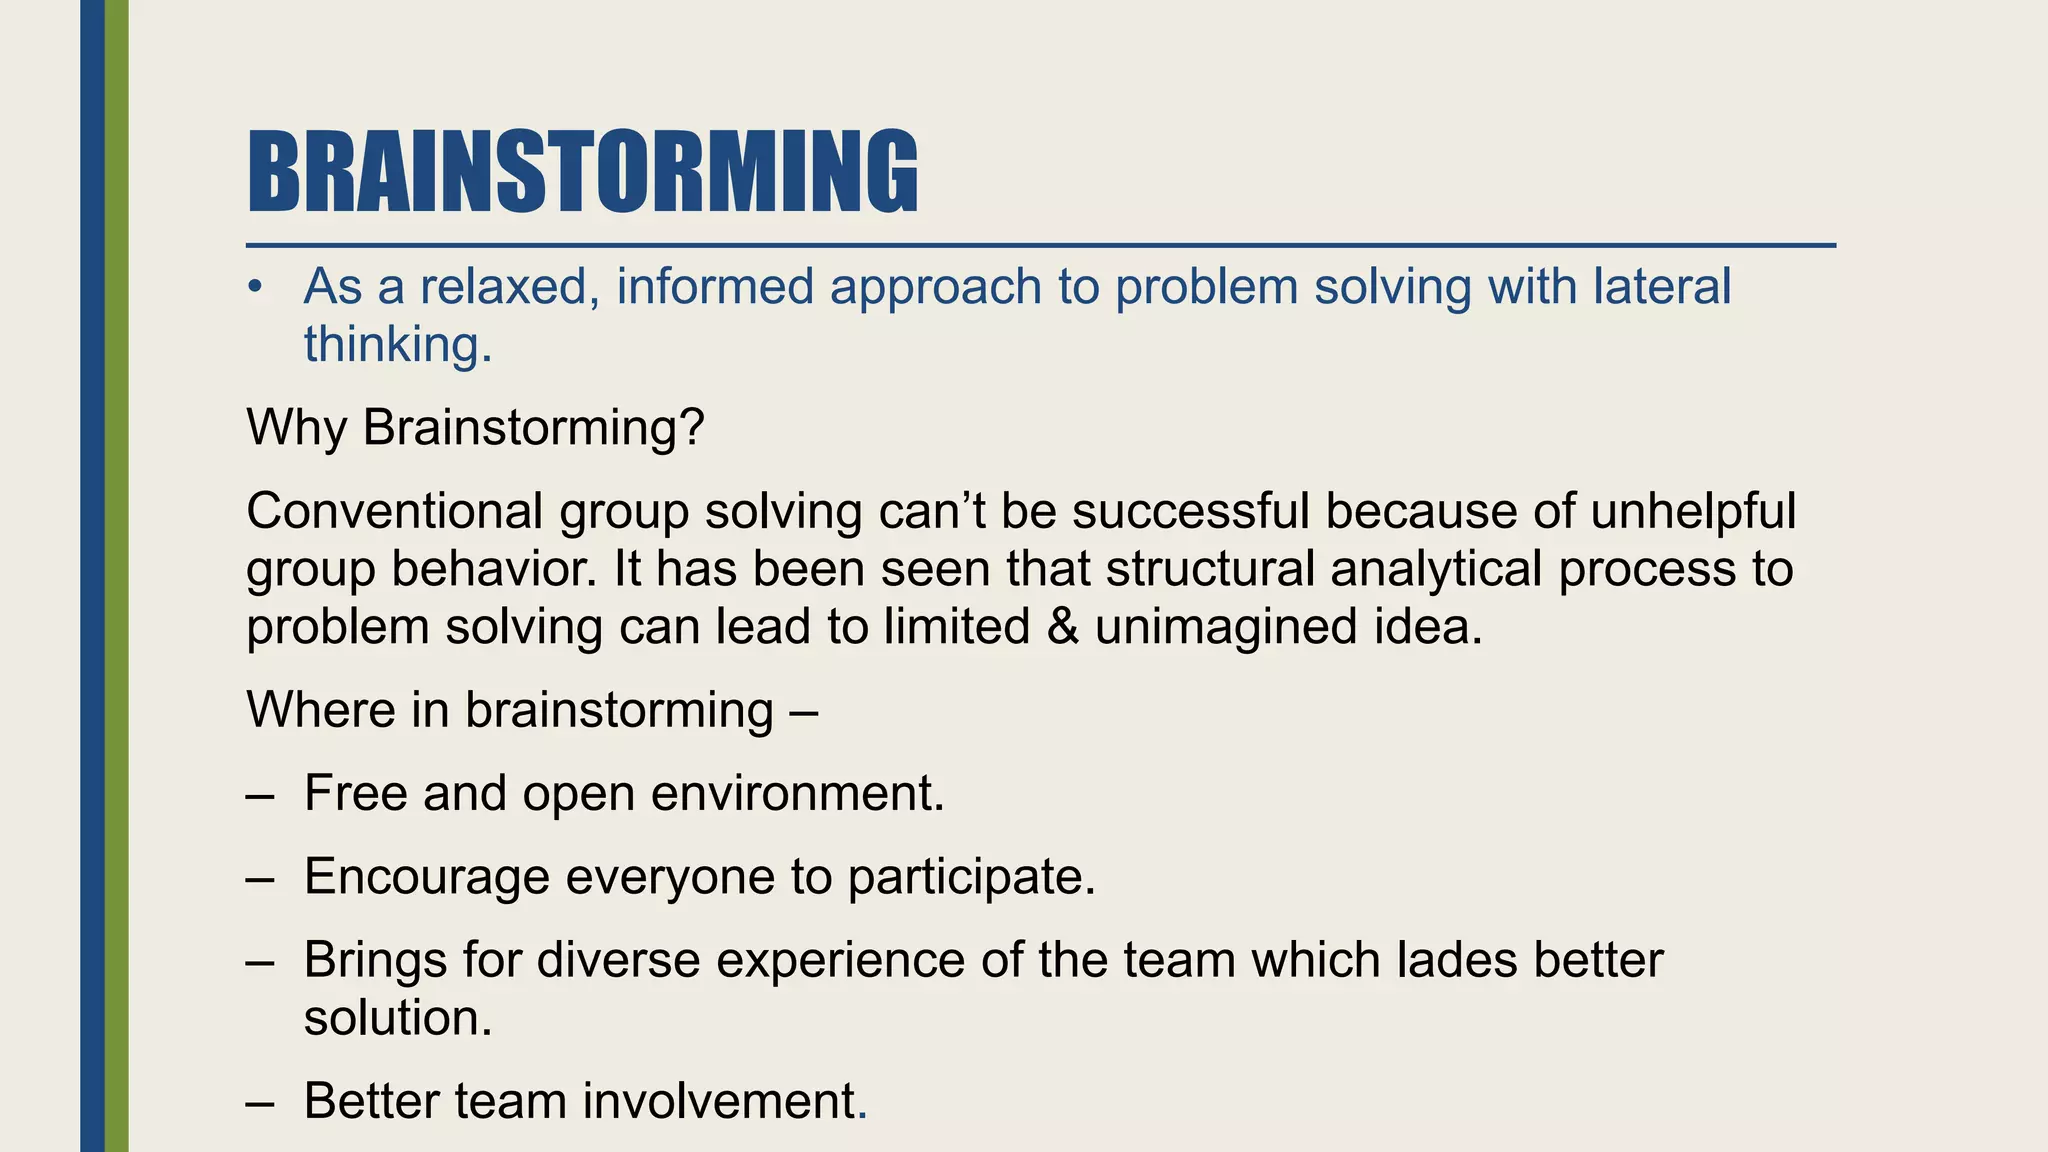
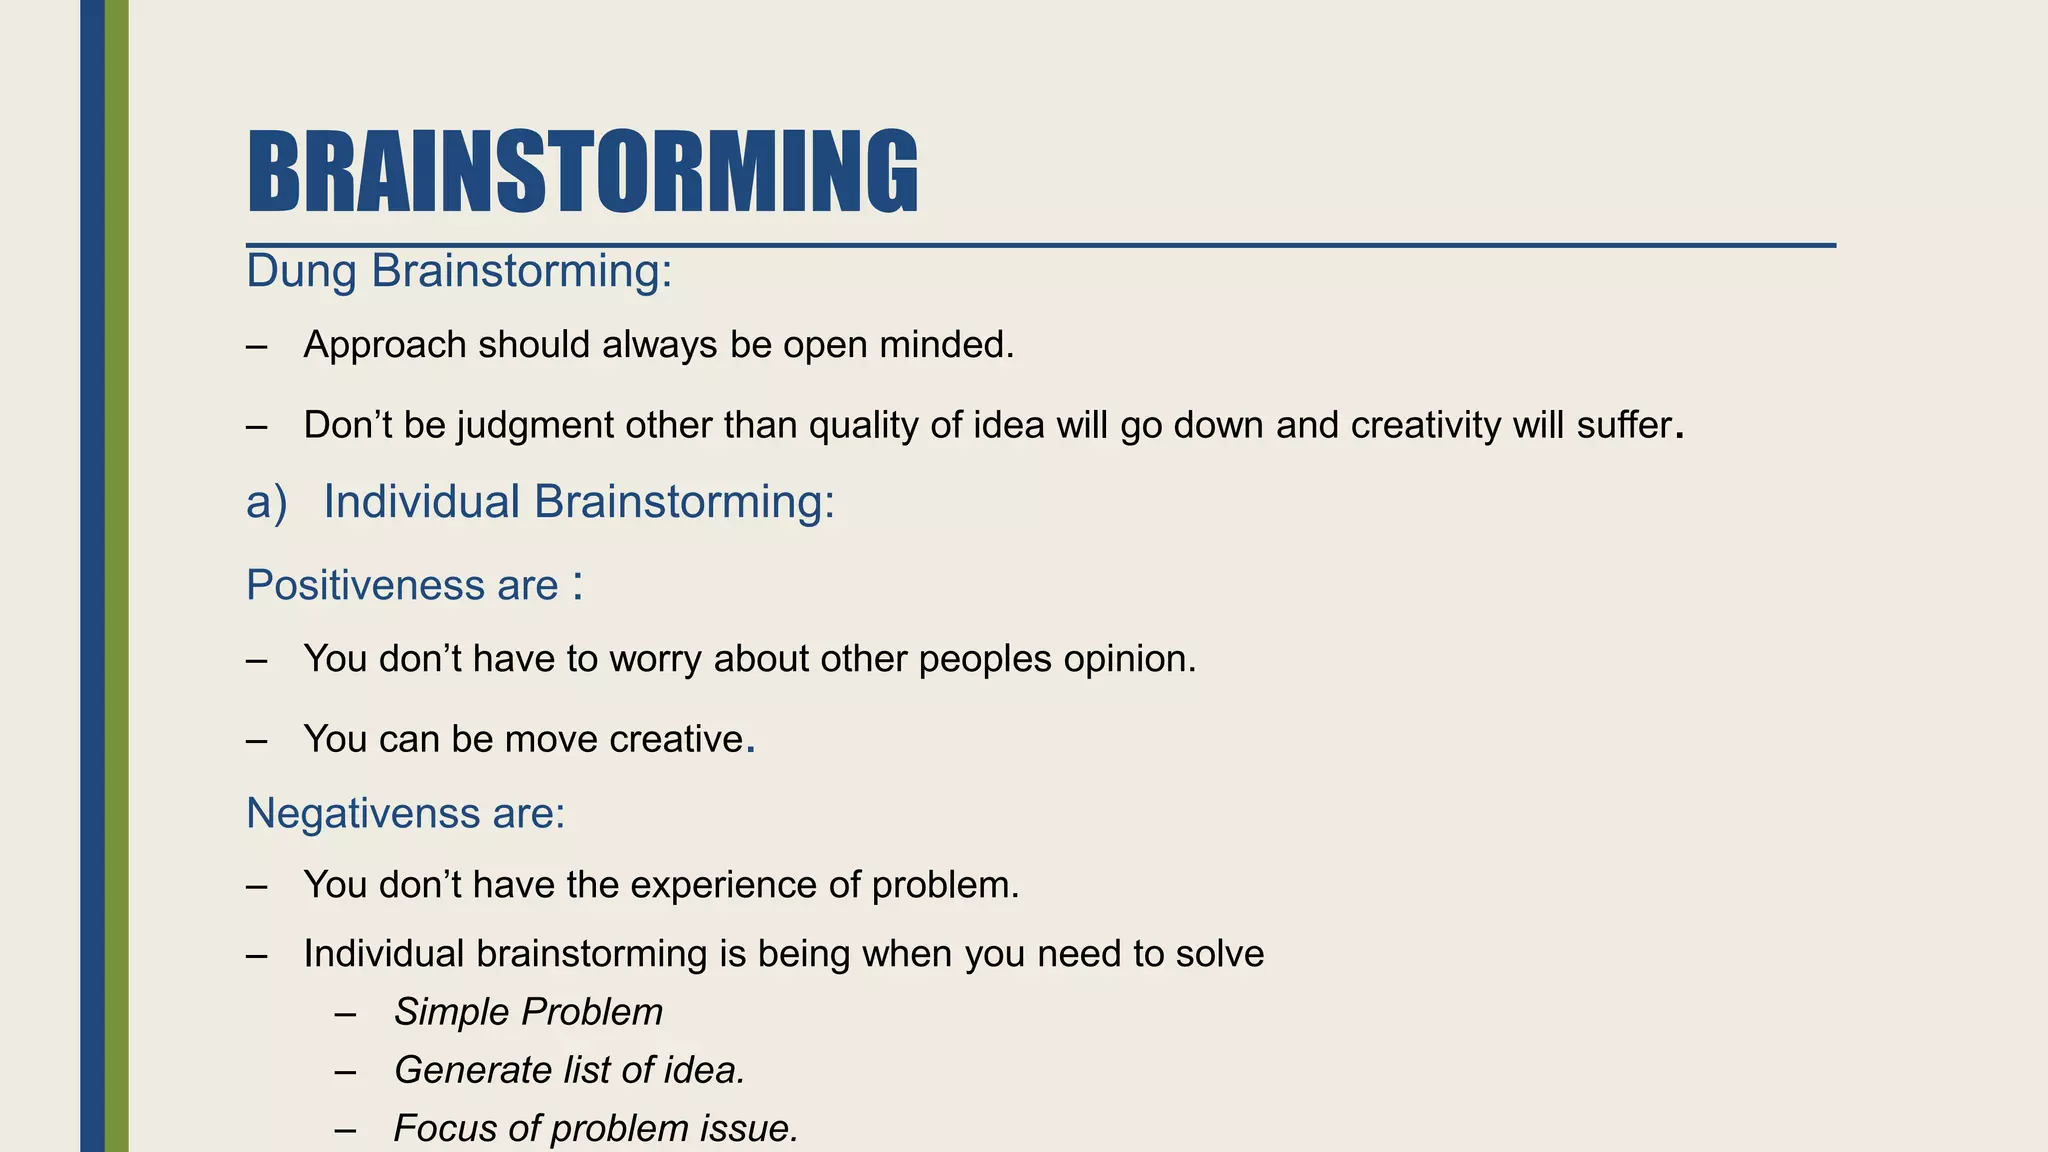
![BRAINSTORMING
• How to brainstorming effective?
Part-1: Create a road map.
a) Look at your goal [what do you want to achieve]
b) Try to understand the requirement.
c) Try to understand your limitations and what kinds of products it
should be & what you expected to develop.
d) List all your assumptions focus on you have a business or you
have to develop new product.
Try to assume
• What your customer wants
• Think about similar product that already exist in market.
e) Evaluate your source.](https://image.slidesharecdn.com/introductiontodmaictraining-190407042152/75/Introduction-to-DMAIC-Training-23-2048.jpg)
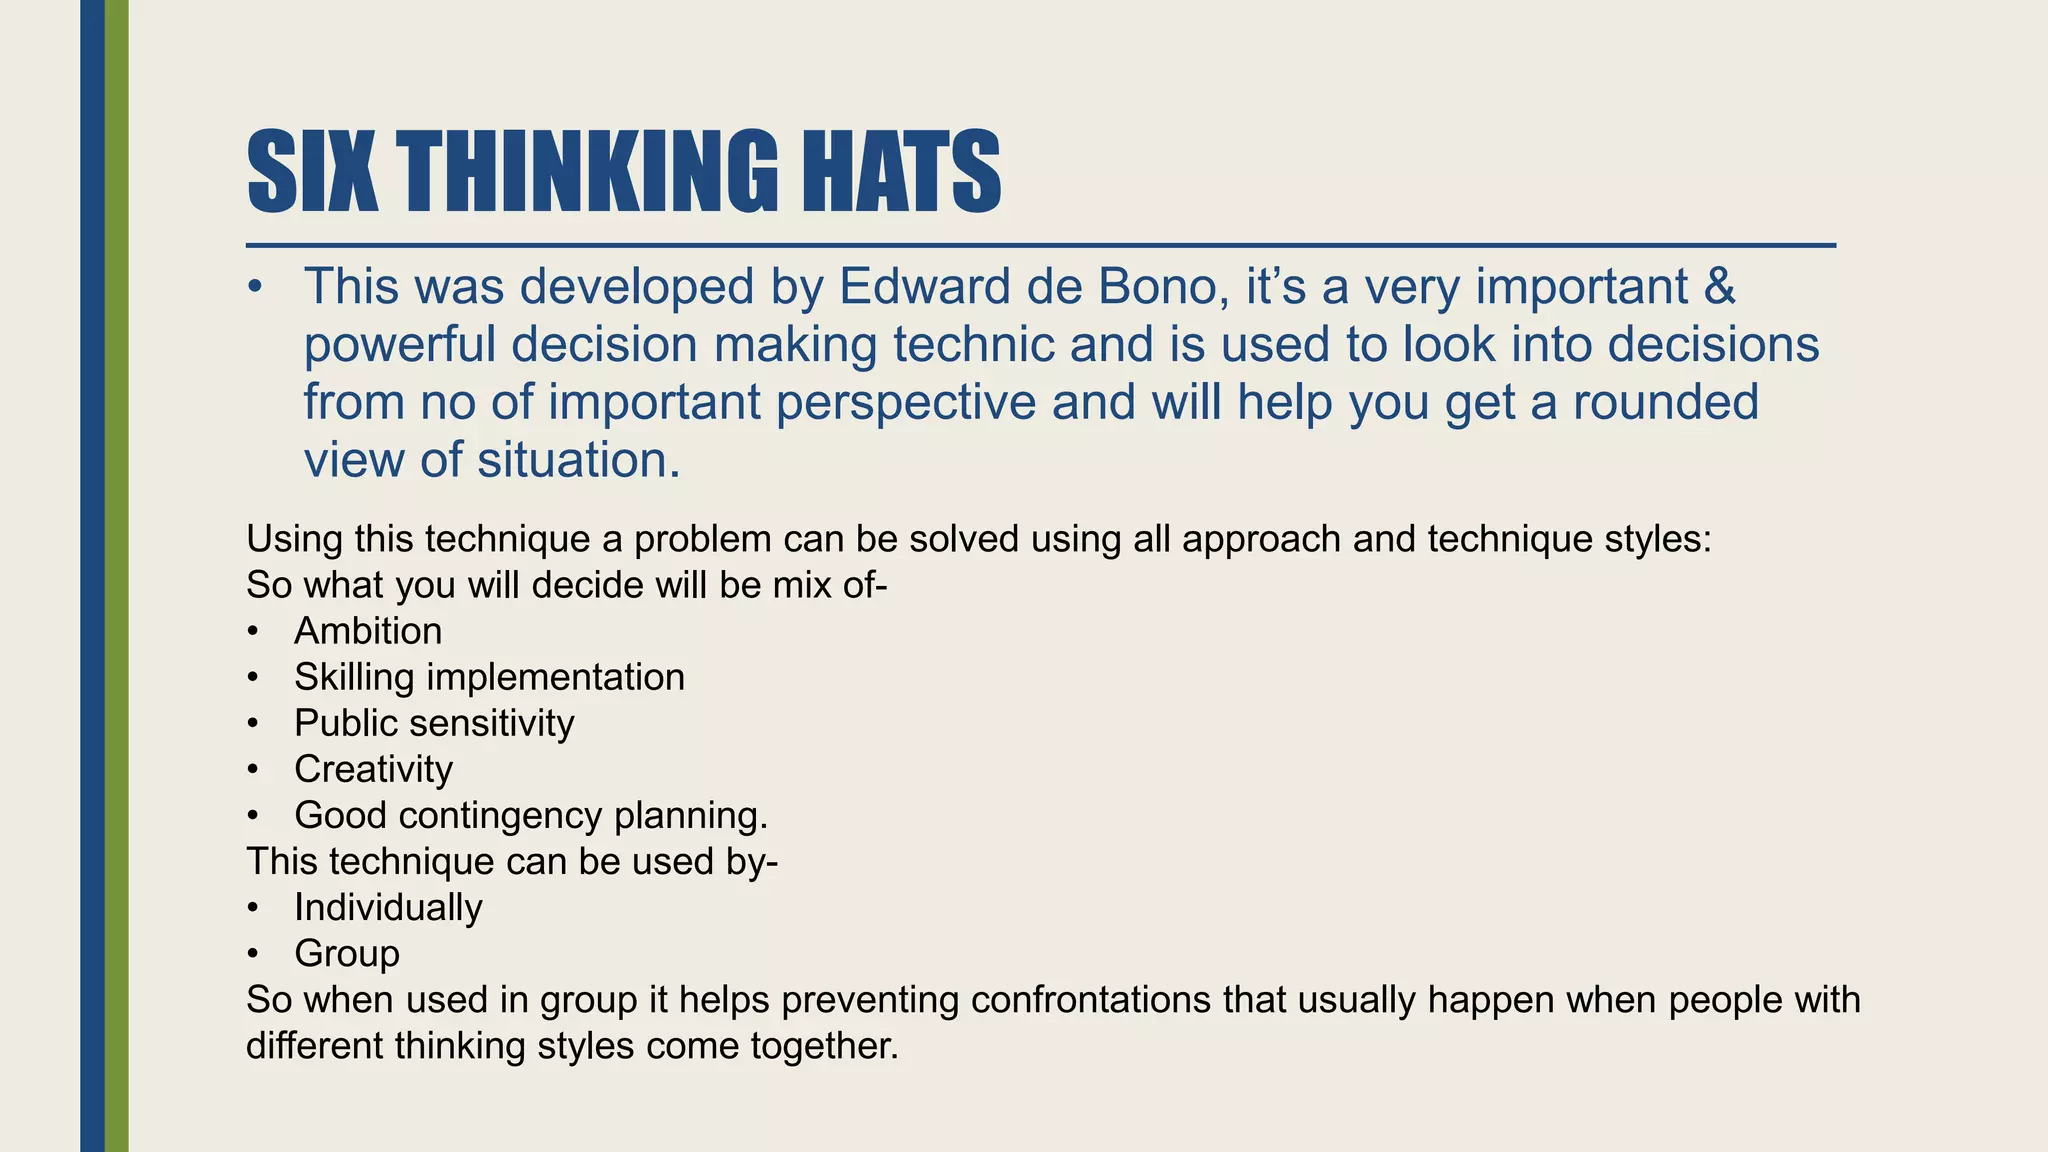
![SIX THINKING HATS
Six thinking Hats Are:
• White Hat:
» Focus on data & information you have
» Look for gaps in your knowledge's [ then either you try to fill them or take account of them.]
» Analyze past trends
» Extrapolate from historical data.
• Red Hat
» This is a kind of thinking when you Look at problems using inclusion, gut reaction / emotionally try to think
how other people will react emotionally & try to understand their response.
• Black Hat
» Look at all the bad points of decision consciously & defensively
» Try to find out why your points may not work.
» Highlight the weak point of your plan. So that you can either eliminate them or develop contingency plan in
case they fail
» In this way you can make your plan tougher & more reveling.](https://image.slidesharecdn.com/introductiontodmaictraining-190407042152/75/Introduction-to-DMAIC-Training-26-2048.jpg)