20 orders/hour
Chef: 12 orders/hour
Oven: 10 orders/hour
Capacity = Minimum = 10 orders/hour
30
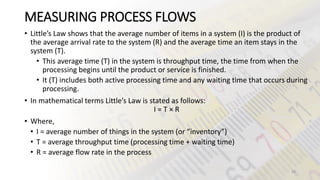
�MEASURING PROCESS FLOWS AT PIZZA U.S.A.
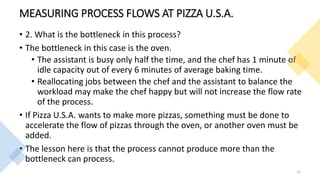
• 2. What is the bottleneck in this process?
• The bottleneck is the oven, which has the lowest capacity of 10 orders per hour.
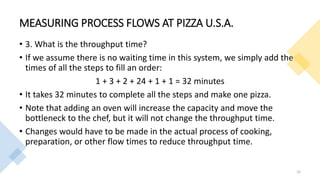
• 3. What is the throughput time?
• Throughput time = Total time per order = 1 + 3 + 2 + 24 + 1 + 1 = 32 minutes
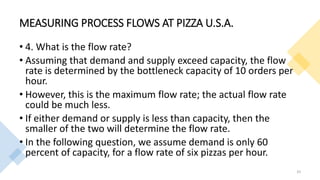
• 4. What is the flow rate?
• Given the capacity is 10 orders/hour and the store is open for 8 hours,