Downloaded 77 times

![Availability is The degree to which a system, subsystem, or equipment is operable
and in a committable state at the start of a mission, when the mission is called for at
an unknown, i.e., a random, time. Simply put, availability is the proportion of time
a system is in a functioning condition
Mathematically, A = E [uptime]
E [uptime] + E [downtime]
ENVIRONMENT (PROTECTION) ACT,1986
The central government, by notification in the official gazette, has notified under
Section 6(2)
(c) the procedures and safeguards for the handling of hazardous substances
(d) the prohibition and restrictions on the handling of hazardous substances in
245
different areas
(f) the procedures and safeguards for the prevention of accidents which may
cause environmental pollution and for providing for remedial measures for
such accidents
Under the Environment (Protection) Rules, 1986, Clause 13(l) the following factors are
to be considered while prohibiting and restricting the handling of hazardous substances
The hazardous nature of the substances in terms of its damage causing potential
to the environment, human beings, other living creatures, plants and property
The substances that may be or likely to be readily available as substitutes for the
substances proposed to be prohibited or restricted
The indigenous availability of the substitute, or the state of technology available
in the country for developing a safe substitute
The gestation period that may be necessary for gradual introduction of a new
substitute with a view to bringing about a total prohibition of hazardous
substances in question
Any other factor that may be considered by the central government to be
relevant to the protection of the environment
CODES STANDARDS FOR RISK ANALYSIS
American Institute of Chemical Engineers have Guidelines for Chemical
Process Quantitative Risk Analysis Hazard Evaluation Procedures, OSHA
has 29 CFR 1910.119, EPA Risk Management Plan (RMP)
Even in non chemical industries codes like Nuclear Regulatory Commission
NUREG/CR-2815 , IEC 61508, SEMI S10 - Safety Guideline for Risk
Assessment, S14 - Safety Guide for Fire Assessment Mitigation for
Semiconductor Manufacturing Equipment
India has its own BIS guidelines for risk assessment in BIS 18001 and also
guidelines by labor ministry, Factories act etc.
This standard prescribes requirements for an OHS Management Systems to
enable an organization to formulate a policy and objectives, taking into account
legislative requirements and information about significant hazards and risks,
which the organization can control and over which it can be expected to have
an influence, to protect its employees and others, whose health and safety may
be affected by the activities of the organization. All the requirements in this
standard are intended to be incorporated into any OHS management system.
This standard also provides imperative guidance on the use of the specification](https://image.slidesharecdn.com/08riskanalysis-140920135027-phpapp02/85/risk-analysis-2-320.jpg)
![1 =Õ [ 1 - exp i (-l t) ]
253
n
P =Õ P i
i
n
R = 1 -Õ (1 - Ri) =
i
n
1
i
QUANTITATIVE TECHNIQUES
Fault Tree Analysis
A fault tree is a logical diagram which shows the relation between system
failure, i.e. a specific undesirable event in the system, and failures of the
components of the system
It is a technique based on deductive logic. An undesirable event is first defined
and causal relationships of the failures leading to that event are then identified
Fault Tree analysis
Fussel (1976) notes that the fault tree analysis is of major value in
Directing the analyst to ferret out failures deductively
Pointing out the aspects of the system important in respect of the failure of
Interest
Providing a graphical aid giving visibility to those in system management who
are removed from system design changes
Providing options for qualitative on quantitative system reliability analysis
Allowing the analyst to concentrate on one particular system failure at a time
Providing the analyst with genuina insight into system behaviour
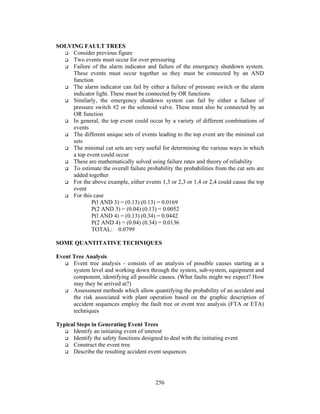
Basic Rules For Fault Tree Construction
Ground Rule 1
Write the statements that are entered in the event boxes as faults; state precisely what
the fault is and when it occurs
Ground rule 2
If the answer to the question, Can this fault consist of a component failure? is Yes,
classify the event as a stat-of-component fault. If the answer is No”. Classify the
event as a state-of-system fault
No Miracles Rule
If the normal functioning of a component propagates a fault sequence, then it is
assumed that the component functions normally
Generating Fault Trees
Complete-the-Gate rule
All inputs to a particular gate should be completely defined before further
'analysis of anyone of them is undertaken.
No Gate-to-Gate Rule
Gate inputs should be properly defined fault events, and gates should not be
directly connected to other gates](https://image.slidesharecdn.com/08riskanalysis-140920135027-phpapp02/85/risk-analysis-10-320.jpg)

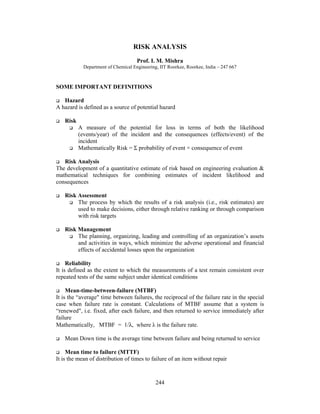
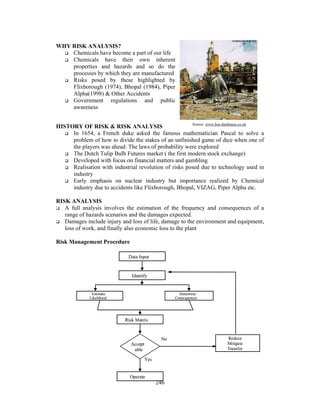
This document provides definitions and information related to risk analysis. It defines key terms like hazard, risk, risk analysis, risk assessment, and reliability. It discusses various quantitative and qualitative methods for risk analysis including fault tree analysis, failure mode and effects analysis, and hazard and operability studies. Failure rate data for some process components is also presented. The document provides an overview of important concepts in quantitative risk analysis including reliability, mean time between failures, and interaction between equipment for series and parallel systems. Overall it serves as a reference on the topic of risk analysis, defining key terms and outlining various approaches.