Downloaded 260 times


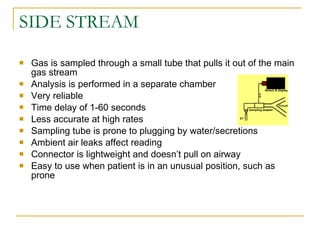
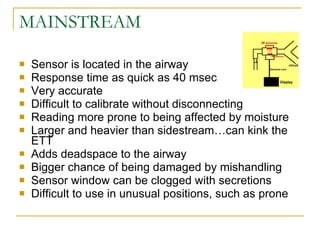


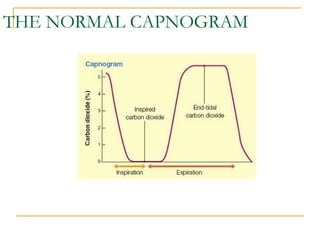


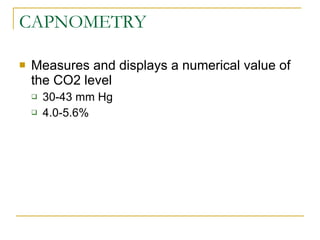

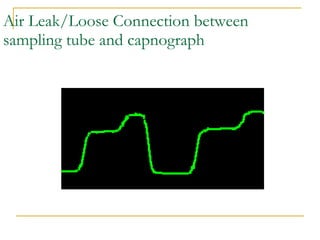


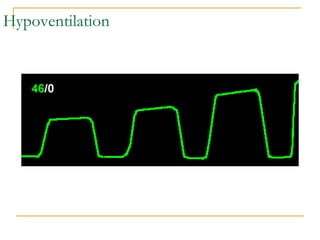


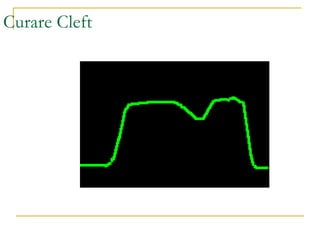
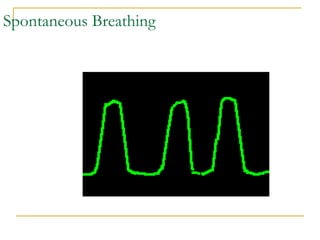


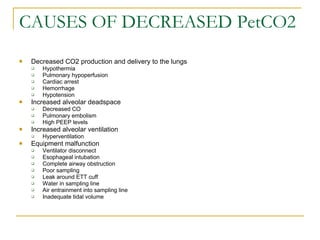
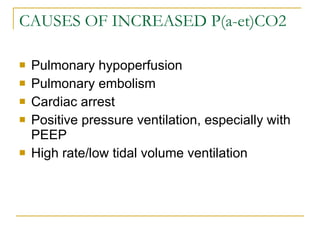
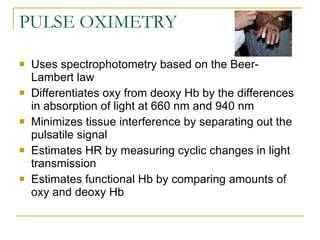
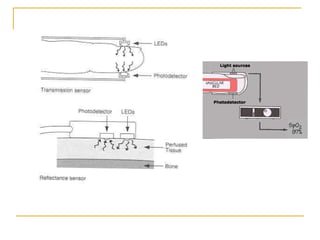


The document discusses various methods for measuring carbon dioxide levels and pulse oximetry. It describes infrared absorption, molecular correlation spectrometry, colorimetric devices, mass spectrometry, and Raman scattering as methods to measure carbon dioxide. It also discusses mainstream and sidestream capnography and factors that can affect capnogram readings such as pulmonary embolism, bronchospasm, or ventilator issues. Pulse oximetry uses light absorption to estimate oxygen saturation and heart rate but can be affected by low perfusion, skin pigmentation, or dysfunctional hemoglobins.