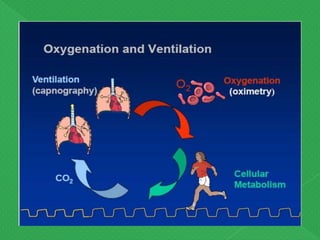
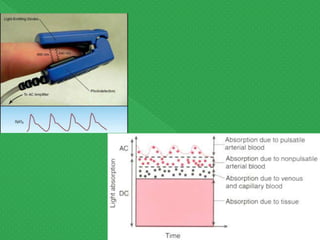
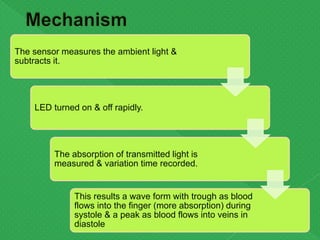
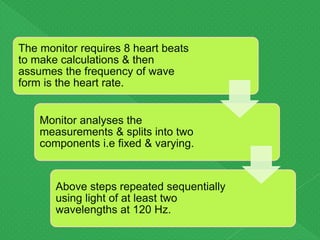
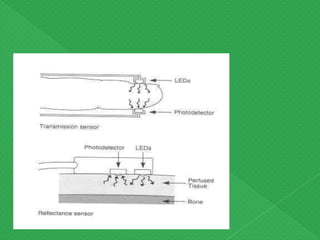
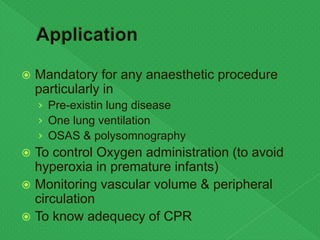
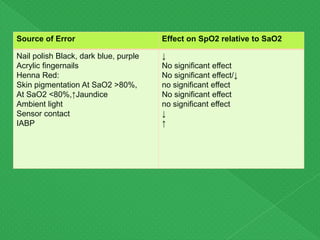
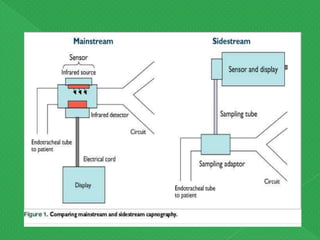
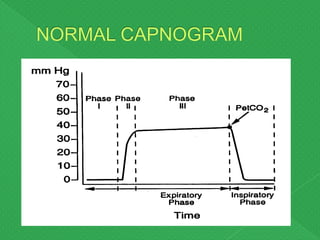
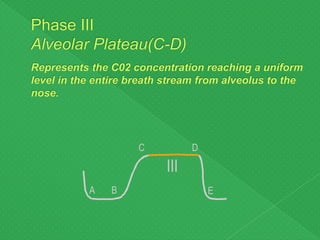
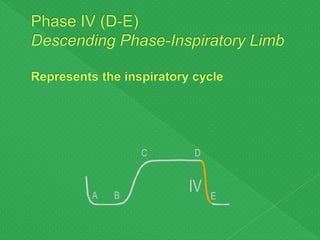
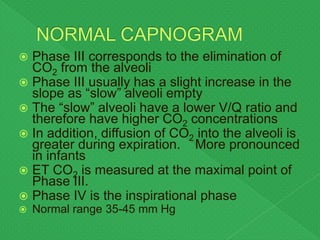
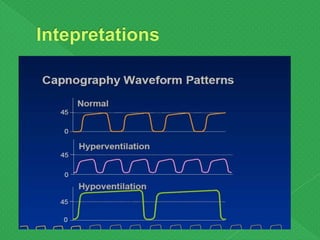
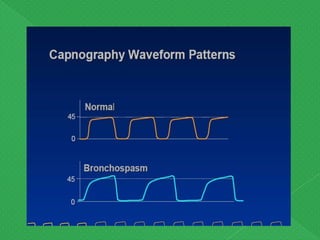
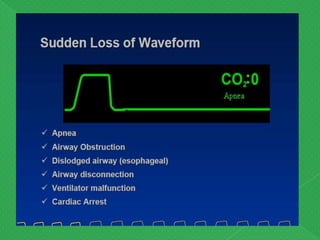
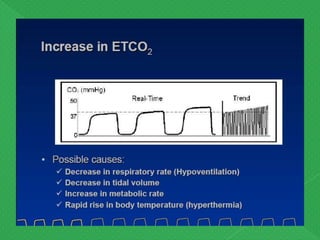
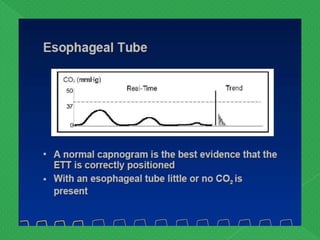
 Introduction
 Principle
 Hemoglobin absorption spectra
 Parts of oximeter
 Sites
 Mechanism
 Types
 Application
 Sources of error
 Oxygenation is measured by pulse oximetry
 The pulse oximeter is a noninvasive device that measures
the oxygen saturation of your patient’s blood (fifth vital
sign).
 Earlier oximetry ,introduced in 1940s to detect hypoxemia
had two short comings
› (a) the transmission of light was influenced by factors
other than hemoglobin (e.g., skin pigments, and the
thickness of the earlobe),
› (b) it was not possible to differentiate between
hemoglobin in arteries and veins.
 pulse oximetry is based on the presence of pulsatile blood
flow(pulsating artery)
 Uses spectrophotometry
based on the Beer-Lambert
law.
 Beer’s law: absorbance is
proportional to the
concentration of the
attenuating species in the
material.
 Lambert’s law: absorbance
is directly propertional to its
thickness(path length)
 Pulse oximeter combines two
technologies
 Spectrophotometry: measures oxygen
saturation
 Optical plethysmography: measures
pulsatile changes in blood volume and
heart rate.
 Differentiates oxy from deoxy Hb by the
differences in absorption of light at 660 nm
and 940 nm
 Minimizes tissue interference by separating
out the pulsatile signal
 Estimates HR by measuring cyclic changes
in light transmission
 Estimates functional Hb by comparing
amounts of oxy and deoxy Hb
 Functional oxygen saturation: Functional
O2 saturation (SaO2) refers to the amount of
O2Hb as a fraction of the total amount of
O2Hb and deO2Hb
 Fractional oxygen saturation: The O2Hb
fraction or fractional saturation is defined as
the amount of O2Hb as a fraction of the total
amount of Hb.
 The pulse oximeter consists of a probe attached
to the patient's finger or ear lobe which is linked
to a computerized unit.
 One side of probe contains two light emitting
diodes that emit monochromatic light at
wavelength 660 (red) & 940 (infrared).
 Otherside contains photo detector.
 It is connected to AC amplifier that amplifies
pulsatile light waves & blocks nonpulsatile
waves.
The sensor measures the ambient light &
subtracts it.
LED turned on & off rapidly.
The absorption of transmitted light is
measured & variation time recorded.
This results a wave form with trough as blood
flows into the finger (more absorption) during
systole & a peak as blood flows into veins in
diastole
Monitor analyses the
measurements & splits into two
components i.e fixed & varying.
Above steps repeated sequentially
using light of at least two
wavelengths at 120 Hz.
The monitor requires 8 heart beats
to make calculations & then
assumes the frequency of wave
form is the heart rate.
 Transmisson pulse oximetry
 Reflectance pulse oximetry
 Co-oximetry
 Transcutaneous oximetry
 Finger ,toes
 Ear
 Forehead
 Thenar ,hypothenar eminence,palm
 penis
 Mandatory for any anaesthetic procedure
particularly in
› Pre-existin lung disease
› One lung ventilation
› OSAS & polysomnography
 To control Oxygen administration (to avoid
hyperoxia in premature infants)
 Monitoring vascular volume & peripheral
circulation
 To know adequecy of CPR
Source of Error Effect on SpO2 relative to SaO2
Hypotension
Anemia
Polycythemia
Motion
Low SaO2
Methemoglobinemia
Carboxyhemoglobinemia
Cyanmethemoglobin
Sulfhemoglobin
Hemoglobin F
Hemoglobin H
Hemoglobin K
Hemoglobin S
Methylene blue
Indigo carmine
Indocyanine green
Isosulfan blue
Fluorescein
↓
↓
No significant effect
↓
Variable
↓/↑ (SpO2 approaches 85%)
↑
No significant effect
↓
No significant effect
↓
↓
↓
No significant effect/↓
No significant effect
Source of Error Effect on SpO2 relative to SaO2
Nail polish Black, dark blue, purple
Acrylic fingernails
Henna Red:
Skin pigmentation At SaO2 >80%,
At SaO2 <80%,↑Jaundice
Ambient light
Sensor contact
IABP
↓
No significant effect
No significant effect/↓
no significant effect
No significant effect
no significant effect
↓
↑
 Capnography is defined as continuous
monitoring of CO2 concentration vs time in a
gas mixture.
 Capnogram is the tracings of waveforms
obtained on the monitor.
 Capnograph is the machine that generates
the wave form.
 Capnometer is the device that performsthe
measurement & displays the readings in
numerical form.
 Infrared Absorption Photometry
 Colorimetric Devices
 Mass Spectrometry
 Raman Scattering
 First developed in 1859.
 Based on Beer-Lambert law: Pa = 1 - e-  DC
› Pa is fraction of light absorbed
›  is absorption coefficient
› D is distance light travels though the gas
› C is molar gas concentration
 The higher the CO2 concentration, the higher the
absorption.
 CO2 absorption takes place at 4.25 µm
 N2O, H2O, and CO can also absorb at this wavelength
 Two types: side port and mainstream
 Gas is sampled through a small tube
 Analysis is performed in a separate chamber
 Very reliable
 Time delay of 1-60 seconds
 Less accurate at higher respiratory rates
 Prone to plugging by water and secretions
 Ambient air leaks
 Sensor is located in the airway
 Response time as little as 40msec
 Very accurate
 Difficult to calibrate without disconnecting (makes
it hard to detect rebreathing)
 More prone to the reading being affected by
moisture
 Larger, can kink the tube.
 Adds dead space to the airway
 Bigger chance of being damaged by mishandling
 Contains a pH sensitive dye which undergoes a
color change in the presence of CO2
 The dye is usually metacresol purple and it
changes to yellow in the presence of CO2
 Portable and lightweight.
 Low false positive rate
 Higher false negative rate
 Acidic solutions, e.g., epi, atropine, lidocaine, will
permanently change the color
 Dead space relatively high for neonates, so don’t
use for long periods of time on those patients.
A B
C D
E
I
A B
C D
E
II
A B
C D
E
III
A B
C D
E
End-Tidal
A B
C D
E
IV
 Phase I is the beginning of exhalation
 Phase I represents most of the anatomical
dead space
 Phase II is where the alveolar gas begins to
mix with the dead space gas and the CO2
begins to rapidly rise
 The anatomic dead space can be calculated
using Phase I and II
 Alveolar dead space can be calculated on
the basis of : VD = VDanat + VDalv
 Significant increase in the alveolar dead
space signifies V/Q mismatch
 Phase III corresponds to the elimination of
CO2 from the alveoli
 Phase III usually has a slight increase in the
slope as “slow” alveoli empty
 The “slow” alveoli have a lower V/Q ratio and
therefore have higher CO2 concentrations
 In addition, diffusion of CO2 into the alveoli is
greater during expiration. More pronounced
in infants
 ET CO2 is measured at the maximal point of
Phase III.
 Phase IV is the inspirational phase
 Normal range 35-45 mm Hg
 To confirm correct position of ET tube (presence of
>3 successive breaths)
 Determines if tip of fibroscope is in trachea
 Diagnosis of malignant hyprethermia
 Detects pulmonary embolism
 Indicates
› Apnoea
› Disconnection of circuit
› Leakage in ETT/circuit
› Ventilator malfunction
› Incompetent inspiratory /expiratory valve
› Assesment of sodalime canister function
 Confirms placement of needle in cricothyroidotomy.
 Miller 8th edition (1331-1334 & 1544-1556)
 Morgan &mikhail clinical anaesthesiology 5th
edition (124-127)
 Smith & aitkinhead anaesthesilogy (339-
345)
 The icu book 4th edition (409-426)

Pulse oximetry & capnography

  • 3.
     Introduction  Principle Hemoglobin absorption spectra  Parts of oximeter  Sites  Mechanism  Types  Application  Sources of error
  • 4.
     Oxygenation ismeasured by pulse oximetry  The pulse oximeter is a noninvasive device that measures the oxygen saturation of your patient’s blood (fifth vital sign).  Earlier oximetry ,introduced in 1940s to detect hypoxemia had two short comings › (a) the transmission of light was influenced by factors other than hemoglobin (e.g., skin pigments, and the thickness of the earlobe), › (b) it was not possible to differentiate between hemoglobin in arteries and veins.  pulse oximetry is based on the presence of pulsatile blood flow(pulsating artery)
  • 5.
     Uses spectrophotometry basedon the Beer-Lambert law.  Beer’s law: absorbance is proportional to the concentration of the attenuating species in the material.  Lambert’s law: absorbance is directly propertional to its thickness(path length)
  • 6.
     Pulse oximetercombines two technologies  Spectrophotometry: measures oxygen saturation  Optical plethysmography: measures pulsatile changes in blood volume and heart rate.
  • 8.
     Differentiates oxyfrom deoxy Hb by the differences in absorption of light at 660 nm and 940 nm  Minimizes tissue interference by separating out the pulsatile signal  Estimates HR by measuring cyclic changes in light transmission  Estimates functional Hb by comparing amounts of oxy and deoxy Hb
  • 9.
     Functional oxygensaturation: Functional O2 saturation (SaO2) refers to the amount of O2Hb as a fraction of the total amount of O2Hb and deO2Hb  Fractional oxygen saturation: The O2Hb fraction or fractional saturation is defined as the amount of O2Hb as a fraction of the total amount of Hb.
  • 10.
     The pulseoximeter consists of a probe attached to the patient's finger or ear lobe which is linked to a computerized unit.  One side of probe contains two light emitting diodes that emit monochromatic light at wavelength 660 (red) & 940 (infrared).  Otherside contains photo detector.  It is connected to AC amplifier that amplifies pulsatile light waves & blocks nonpulsatile waves.
  • 12.
    The sensor measuresthe ambient light & subtracts it. LED turned on & off rapidly. The absorption of transmitted light is measured & variation time recorded. This results a wave form with trough as blood flows into the finger (more absorption) during systole & a peak as blood flows into veins in diastole
  • 13.
    Monitor analyses the measurements& splits into two components i.e fixed & varying. Above steps repeated sequentially using light of at least two wavelengths at 120 Hz. The monitor requires 8 heart beats to make calculations & then assumes the frequency of wave form is the heart rate.
  • 14.
     Transmisson pulseoximetry  Reflectance pulse oximetry  Co-oximetry  Transcutaneous oximetry
  • 16.
     Finger ,toes Ear  Forehead  Thenar ,hypothenar eminence,palm  penis
  • 17.
     Mandatory forany anaesthetic procedure particularly in › Pre-existin lung disease › One lung ventilation › OSAS & polysomnography  To control Oxygen administration (to avoid hyperoxia in premature infants)  Monitoring vascular volume & peripheral circulation  To know adequecy of CPR
  • 19.
    Source of ErrorEffect on SpO2 relative to SaO2 Hypotension Anemia Polycythemia Motion Low SaO2 Methemoglobinemia Carboxyhemoglobinemia Cyanmethemoglobin Sulfhemoglobin Hemoglobin F Hemoglobin H Hemoglobin K Hemoglobin S Methylene blue Indigo carmine Indocyanine green Isosulfan blue Fluorescein ↓ ↓ No significant effect ↓ Variable ↓/↑ (SpO2 approaches 85%) ↑ No significant effect No significant effect No significant effect No significant effect ↓ No significant effect ↓ ↓ ↓ No significant effect/↓ No significant effect
  • 20.
    Source of ErrorEffect on SpO2 relative to SaO2 Nail polish Black, dark blue, purple Acrylic fingernails Henna Red: Skin pigmentation At SaO2 >80%, At SaO2 <80%,↑Jaundice Ambient light Sensor contact IABP ↓ No significant effect No significant effect/↓ no significant effect No significant effect no significant effect ↓ ↑
  • 21.
     Capnography isdefined as continuous monitoring of CO2 concentration vs time in a gas mixture.  Capnogram is the tracings of waveforms obtained on the monitor.  Capnograph is the machine that generates the wave form.  Capnometer is the device that performsthe measurement & displays the readings in numerical form.
  • 22.
     Infrared AbsorptionPhotometry  Colorimetric Devices  Mass Spectrometry  Raman Scattering
  • 23.
     First developedin 1859.  Based on Beer-Lambert law: Pa = 1 - e-  DC › Pa is fraction of light absorbed ›  is absorption coefficient › D is distance light travels though the gas › C is molar gas concentration  The higher the CO2 concentration, the higher the absorption.  CO2 absorption takes place at 4.25 µm  N2O, H2O, and CO can also absorb at this wavelength  Two types: side port and mainstream
  • 25.
     Gas issampled through a small tube  Analysis is performed in a separate chamber  Very reliable  Time delay of 1-60 seconds  Less accurate at higher respiratory rates  Prone to plugging by water and secretions  Ambient air leaks
  • 26.
     Sensor islocated in the airway  Response time as little as 40msec  Very accurate  Difficult to calibrate without disconnecting (makes it hard to detect rebreathing)  More prone to the reading being affected by moisture  Larger, can kink the tube.  Adds dead space to the airway  Bigger chance of being damaged by mishandling
  • 28.
     Contains apH sensitive dye which undergoes a color change in the presence of CO2  The dye is usually metacresol purple and it changes to yellow in the presence of CO2  Portable and lightweight.  Low false positive rate  Higher false negative rate  Acidic solutions, e.g., epi, atropine, lidocaine, will permanently change the color  Dead space relatively high for neonates, so don’t use for long periods of time on those patients.
  • 31.
  • 32.
  • 33.
  • 34.
  • 35.
  • 36.
     Phase Iis the beginning of exhalation  Phase I represents most of the anatomical dead space  Phase II is where the alveolar gas begins to mix with the dead space gas and the CO2 begins to rapidly rise  The anatomic dead space can be calculated using Phase I and II  Alveolar dead space can be calculated on the basis of : VD = VDanat + VDalv  Significant increase in the alveolar dead space signifies V/Q mismatch
  • 37.
     Phase IIIcorresponds to the elimination of CO2 from the alveoli  Phase III usually has a slight increase in the slope as “slow” alveoli empty  The “slow” alveoli have a lower V/Q ratio and therefore have higher CO2 concentrations  In addition, diffusion of CO2 into the alveoli is greater during expiration. More pronounced in infants  ET CO2 is measured at the maximal point of Phase III.  Phase IV is the inspirational phase  Normal range 35-45 mm Hg
  • 48.
     To confirmcorrect position of ET tube (presence of >3 successive breaths)  Determines if tip of fibroscope is in trachea  Diagnosis of malignant hyprethermia  Detects pulmonary embolism  Indicates › Apnoea › Disconnection of circuit › Leakage in ETT/circuit › Ventilator malfunction › Incompetent inspiratory /expiratory valve › Assesment of sodalime canister function  Confirms placement of needle in cricothyroidotomy.
  • 49.
     Miller 8thedition (1331-1334 & 1544-1556)  Morgan &mikhail clinical anaesthesiology 5th edition (124-127)  Smith & aitkinhead anaesthesilogy (339- 345)  The icu book 4th edition (409-426)