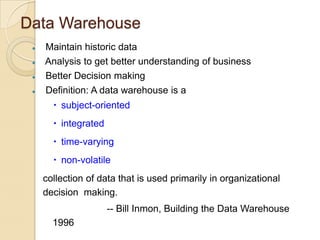
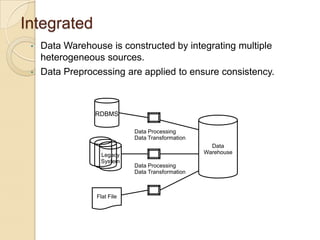
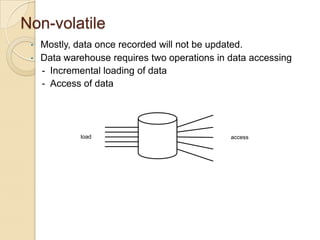
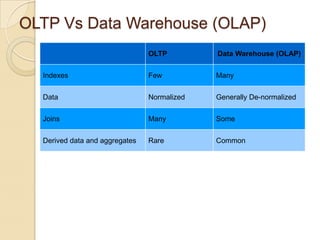
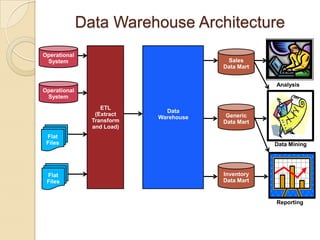
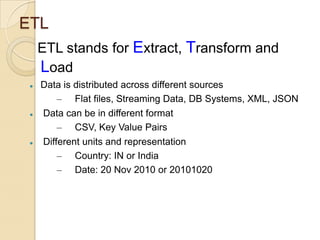
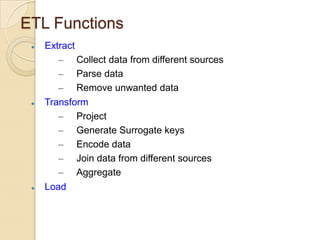
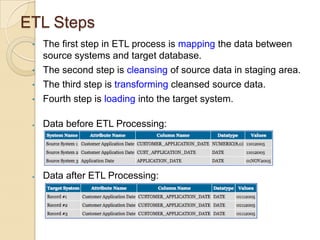
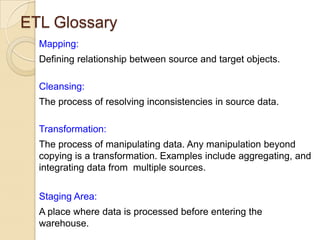
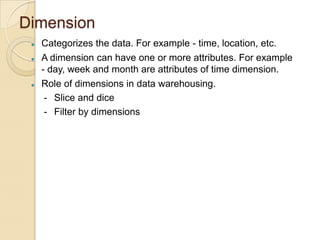
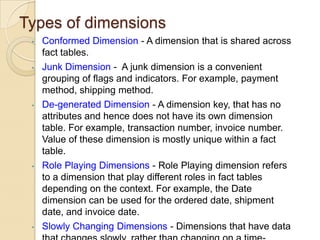
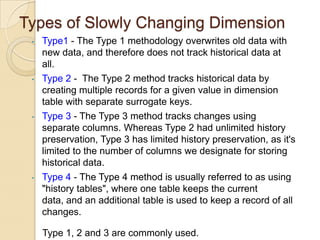
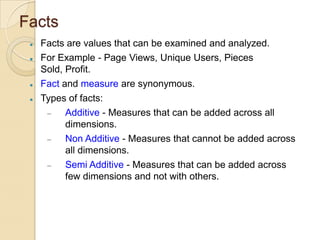
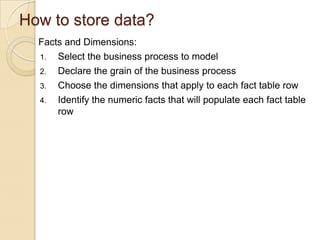
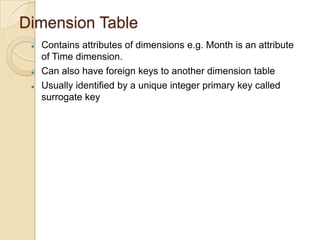
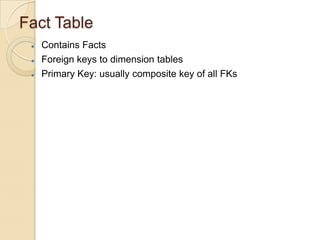
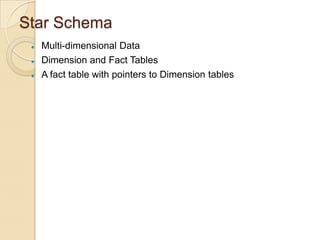
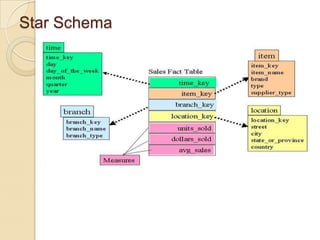
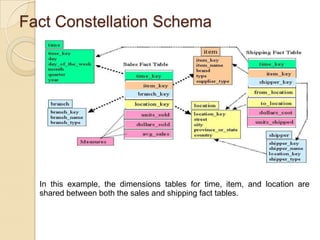
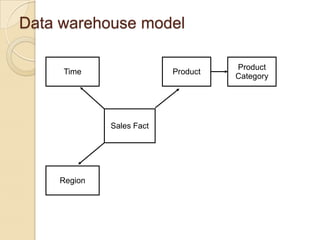
Introduction to Data Warehousing
Data Warehouse





Maintain historic data
Analysis to get better understanding of business
Better Decision making
Definition: A data warehouse is a
 subject-oriented
 integrated

 time-varying
 non-volatile
collection of data that is used primarily in organizational
decision making.
-- Bill Inmon, Building the Data Warehouse
1996
Subject Oriented
•
•
•

Data warehouse is organized around subjects such as
sales, product, customer.
It focuses on modeling and analysis of data for decision
makers.
Excludes data not useful in decision support process.
Integrated
•
•

Data Warehouse is constructed by integrating multiple
heterogeneous sources.
Data Preprocessing are applied to ensure consistency.

RDBMS
Data Processing
Data Transformation
Legacy
System

Flat File

Data
Warehouse
Data Processing
Data Transformation
Non-volatile
•

Mostly, data once recorded will not be updated.
• Data warehouse requires two operations in data accessing
- Incremental loading of data
- Access of data

load

access
Time Variant
•
•

Provides information from historical perspective e.g. past 510 years
Every key structure contains either implicitly or explicitly an
element of time
Why Data Warehouse?
Problem Statement:
• ABC Pvt Ltd is a company with branches at Mumbai, Delhi,
Chennai and Bangalore.
• The Sales Manager wants quarterly sales report across the
branches.
• Each branch has a separate operational system where sales
transactions are recorded.
Why Data Warehouse?
Mumbai

Delhi

Get quarterly sales figure
for each branch
and manually calculate
sales figure across branches.

Sales
Manager

Chennai

Banglore

What if he need daily sales report across the branches?
Why Data Warehouse?
•
•

Solution:
Extract sales information from each database.
Store the information in a common repository at a single
site.
Why Data Warehouse?
Mumbai

Delhi
Data
Warehouse
Chennai

Banglore

Query &
Analysis tools

Sales
Manager
Characteristics of Data Warehouse









Relational / Multidimensional database
Query and Analysis rather than transaction
Historical data from transactions
Consolidates Multiple data sources
Separates query load from transactions
Mostly non volatile
Large amount of data in order of TBs
When we say large - we mean it!
• Terabytes -- 10^12 bytes:

Yahoo! – 300 Terabytes and
growing

• Petabytes -- 10^15 bytes:
Geographic Information Systems
• Exabytes -- 10^18 bytes:
National Medical Records

• Zettabytes -- 10^21 bytes:
Weather images
• Zottabytes -- 10^24 bytes:
Intelligence Agency Videos
OLTP Vs Data Warehouse (OLAP)
OLTP

Data Warehouse (OLAP)

Indexes

Few

Many

Data

Normalized

Generally De-normalized

Joins

Many

Some

Derived data and aggregates

Rare

Common
Data Warehouse Architecture
Operational
System

Sales
Data Mart
Analysis

Operational
System
ETL
(Extract
Transform
and Load)

Data
Warehouse

Generic
Data Mart

Flat
Files

Flat
Files

Data Mining

Inventory
Data Mart

Reporting
ETL
ETL stands for Extract, Transform and
Load






Data is distributed across different sources
– Flat files, Streaming Data, DB Systems, XML, JSON
Data can be in different format
– CSV, Key Value Pairs
Different units and representation
– Country: IN or India
– Date: 20 Nov 2010 or 20101020
ETL Functions






Extract
– Collect data from different sources
– Parse data
– Remove unwanted data
Transform
– Project
– Generate Surrogate keys
– Encode data
– Join data from different sources
– Aggregate
Load
ETL Steps
•

The first step in ETL process is mapping the data between
source systems and target database.
• The second step is cleansing of source data in staging area.
• The third step is transforming cleansed source data.
• Fourth step is loading into the target system.


Data before ETL Processing:



Data after ETL Processing:
ETL Glossary
Mapping:
Defining relationship between source and target objects.
Cleansing:
The process of resolving inconsistencies in source data.
Transformation:
The process of manipulating data. Any manipulation beyond
copying is a transformation. Examples include aggregating, and
integrating data from multiple sources.
Staging Area:

A place where data is processed before entering the
warehouse.
Dimension






Categorizes the data. For example - time, location, etc.
A dimension can have one or more attributes. For example
- day, week and month are attributes of time dimension.
Role of dimensions in data warehousing.
- Slice and dice
- Filter by dimensions
Types of dimensions
•

•

•

•

•

Conformed Dimension - A dimension that is shared across
fact tables.
Junk Dimension - A junk dimension is a convenient
grouping of flags and indicators. For example, payment
method, shipping method.
De-generated Dimension - A dimension key, that has no
attributes and hence does not have its own dimension
table. For example, transaction number, invoice number.
Value of these dimension is mostly unique within a fact
table.
Role Playing Dimensions - Role Playing dimension refers
to a dimension that play different roles in fact tables
depending on the context. For example, the Date
dimension can be used for the ordered date, shipment
date, and invoice date.
Slowly Changing Dimensions - Dimensions that have data
Types of Slowly Changing Dimension
•

•

•

•

Type1 - The Type 1 methodology overwrites old data with
new data, and therefore does not track historical data at
all.
Type 2 - The Type 2 method tracks historical data by
creating multiple records for a given value in dimension
table with separate surrogate keys.
Type 3 - The Type 3 method tracks changes using
separate columns. Whereas Type 2 had unlimited history
preservation, Type 3 has limited history preservation, as it's
limited to the number of columns we designate for storing
historical data.
Type 4 - The Type 4 method is usually referred to as using
"history tables", where one table keeps the current data,
and an additional table is used to keep a record of all
changes.
Type 1, 2 and 3 are commonly used.
Facts







Facts are values that can be examined and analyzed.
For Example - Page Views, Unique Users, Pieces
Sold, Profit.
Fact and measure are synonymous.
Types of facts:
–
Additive - Measures that can be added across all
dimensions.
–
Non Additive - Measures that cannot be added across
all dimensions.
–
Semi Additive - Measures that can be added across
few dimensions and not with others.
How to store data?
Facts and Dimensions:
1. Select the business process to model
2. Declare the grain of the business process
3. Choose the dimensions that apply to each fact table row
4. Identify the numeric facts that will populate each fact table
row
Dimension Table





Contains attributes of dimensions e.g. Month is an attribute
of Time dimension.
Can also have foreign keys to another dimension table
Usually identified by a unique integer primary key called
surrogate key
Fact Table




Contains Facts
Foreign keys to dimension tables
Primary Key: usually composite key of all FKs
Types of schema used in data
warehouse
Star Schema





Snowflake Schema
Fact Constellation Schema
Star Schema





Multi-dimensional Data
Dimension and Fact Tables
A fact table with pointers to Dimension tables
Star Schema
Snowflake Schema




An extension of star schema in which the dimension tables
are partly or fully normalized.
Dimension table hierarchies broken down into simpler
tables.
Snowflake Schema
Fact Constellation Schema
•
•



A fact constellation schema allows dimension tables to be
shared between fact tables.
This Schema is used mainly for the aggregate fact tables,
OR where we want to split a fact table for better
comprehension.
For example, a separate fact table for daily, weekly and
monthly reporting requirement.
Fact Constellation Schema

In this example, the dimensions tables for time, item, and location are
shared between both the sales and shipping fact tables.
Operations on Data Warehouse






Drill Down
Roll up
Slice & Dice
Pivoting
Drill Down
Product
Category e.g Home Appliances
Sub Category e.g Kitchen Appliances
Product e.g Toaster

Time
Roll Up
Year

Fiscal Year

Quarter

Fiscal Quarter

Month

Fiscal Month

Fiscal Week

Day
Slice & Dice
Product = Toaster
Product

Time
Time
Pivoting
Product

Product

Time

•
•
•

Also called rotation
Rotate on an axis
Interchange Rows and Columns

Region
Advantages of Data Warehouse
•
•
•
•
•

One consistent data store for reporting, forecasting, and
analysis
Easier and timely access to data
Scalability
Trend analysis and detection
Drill down analysis
Disadvantages of Data Warehouse
•

Preparation may be time consuming.
• High associated cost
Case Study: Why Data Warehouse
•

•

G2G Courier Pvt. Ltd. is an established brand in courier
industry which has its own network in main cities and also
have sub contracted in rural areas across the country to
various partners.
The President of the company wants to look deep into the
financial health of the company and different performance
aspects.
Challenges
Apart from G2G’s own transaction system, each partner has
their own system which make the data very heterogeneous.
• Granularity of data in various systems is also different. For
eg: minute accuracy and day accuracy.
• To do analysis on metrics like Revenue and Timely delivery
across various geographical locations and partner, we need
to have a unified system.
•
“Looks like we are doing good in
South, is there any scope of further
improvement???”

“We are getting lot of complaints
from the East, who exactly is the
black sheep???”
Sales Information
Report: Revenue by region
Region

Revenue (lacs)

% Change

South

41

+ 8.1

North

34

+ 5.2

East

25

- 6.8

West

12

+ 2.7

Report: Performance by partner
Partner

On Time Delivery Rate

No. of complaints

A

100 %

0

B

98 %

90

C

60 %

521
Case Study: Data Warehouse Design
•
•
•

ABC Pvt Ltd is a new company which produces stationary
products with production unit located at Ludhiana.
They have sales units at Delhi, Bangalore.
The President of the company wants sales information.
Sales Information
Report: The number of units sold.
113

Report: The number of units sold over time
January

February

March

April

14

41

33

25

Report : The number of items sold for each product with time
Jan

Feb

Apr

6

Black Cartridge

Mar

17
8

Long notebook

6

16

6

Short notebook

8

25

21
Product
Sales Information
Report: The number of items sold in each City for each product with time
City

Item

Delhi

Jan

Feb Mar Apr

Black Cartridge

3
16

6

Short Notebook 4

16

6

Bangalore Black Cartridge

3

Time

Long Notebook 3

10

7

Long Notebook 3

8

Short Notebook 4

9

Product

15

City

Item

Jan Feb

Mar Apr

Delhi

General Stationary

7

12

Ink & Toners
Bangalore General Stationary

Ink & Toners

3
7

9

10

15

8

3

7

Time

32

Product Category
Identify sales Facts & Dimensions


Facts – Units sold



Dimensions – Product, Time, Region.



Fact Table
City_ID Prod_ID
1

589

1

3

1

1218

1

4

2

589

1

3

2

1218

1

4

1


Time_Id Units

589

2

16

Time dimension table
Time_Id

Month

1

January 2012

2

February 2012
Identify sales Facts & Dimensions
Region Dimension Table

City_ID

City

Region

Country

1

Delhi

North

India

2

Bangalore

South

India

Product Dimension Tables

Prod_ID

Product_Name

Product_Category_ID

589

Black Cartridge

2

590

Long Notebook

1

288

Short Notebook

1

Product_Category_ID Product_Category
1

General Stationary

2

Ink & Toners
Data warehouse model
Time

Product

Sales Fact

Region

Product
Category
Thank You

Introduction to Data Warehousing

  • 1.
  • 2.
    Data Warehouse     Maintain historicdata Analysis to get better understanding of business Better Decision making Definition: A data warehouse is a  subject-oriented  integrated  time-varying  non-volatile collection of data that is used primarily in organizational decision making. -- Bill Inmon, Building the Data Warehouse 1996
  • 3.
    Subject Oriented • • • Data warehouseis organized around subjects such as sales, product, customer. It focuses on modeling and analysis of data for decision makers. Excludes data not useful in decision support process.
  • 4.
    Integrated • • Data Warehouse isconstructed by integrating multiple heterogeneous sources. Data Preprocessing are applied to ensure consistency. RDBMS Data Processing Data Transformation Legacy System Flat File Data Warehouse Data Processing Data Transformation
  • 5.
    Non-volatile • Mostly, data oncerecorded will not be updated. • Data warehouse requires two operations in data accessing - Incremental loading of data - Access of data load access
  • 6.
    Time Variant • • Provides informationfrom historical perspective e.g. past 510 years Every key structure contains either implicitly or explicitly an element of time
  • 7.
    Why Data Warehouse? ProblemStatement: • ABC Pvt Ltd is a company with branches at Mumbai, Delhi, Chennai and Bangalore. • The Sales Manager wants quarterly sales report across the branches. • Each branch has a separate operational system where sales transactions are recorded.
  • 8.
    Why Data Warehouse? Mumbai Delhi Getquarterly sales figure for each branch and manually calculate sales figure across branches. Sales Manager Chennai Banglore What if he need daily sales report across the branches?
  • 9.
    Why Data Warehouse? • • Solution: Extractsales information from each database. Store the information in a common repository at a single site.
  • 10.
  • 11.
    Characteristics of DataWarehouse        Relational / Multidimensional database Query and Analysis rather than transaction Historical data from transactions Consolidates Multiple data sources Separates query load from transactions Mostly non volatile Large amount of data in order of TBs
  • 12.
    When we saylarge - we mean it! • Terabytes -- 10^12 bytes: Yahoo! – 300 Terabytes and growing • Petabytes -- 10^15 bytes: Geographic Information Systems • Exabytes -- 10^18 bytes: National Medical Records • Zettabytes -- 10^21 bytes: Weather images • Zottabytes -- 10^24 bytes: Intelligence Agency Videos
  • 13.
    OLTP Vs DataWarehouse (OLAP) OLTP Data Warehouse (OLAP) Indexes Few Many Data Normalized Generally De-normalized Joins Many Some Derived data and aggregates Rare Common
  • 14.
    Data Warehouse Architecture Operational System Sales DataMart Analysis Operational System ETL (Extract Transform and Load) Data Warehouse Generic Data Mart Flat Files Flat Files Data Mining Inventory Data Mart Reporting
  • 15.
    ETL ETL stands forExtract, Transform and Load    Data is distributed across different sources – Flat files, Streaming Data, DB Systems, XML, JSON Data can be in different format – CSV, Key Value Pairs Different units and representation – Country: IN or India – Date: 20 Nov 2010 or 20101020
  • 16.
    ETL Functions    Extract – Collectdata from different sources – Parse data – Remove unwanted data Transform – Project – Generate Surrogate keys – Encode data – Join data from different sources – Aggregate Load
  • 17.
    ETL Steps • The firststep in ETL process is mapping the data between source systems and target database. • The second step is cleansing of source data in staging area. • The third step is transforming cleansed source data. • Fourth step is loading into the target system.  Data before ETL Processing:  Data after ETL Processing:
  • 18.
    ETL Glossary Mapping: Defining relationshipbetween source and target objects. Cleansing: The process of resolving inconsistencies in source data. Transformation: The process of manipulating data. Any manipulation beyond copying is a transformation. Examples include aggregating, and integrating data from multiple sources. Staging Area: A place where data is processed before entering the warehouse.
  • 19.
    Dimension    Categorizes the data.For example - time, location, etc. A dimension can have one or more attributes. For example - day, week and month are attributes of time dimension. Role of dimensions in data warehousing. - Slice and dice - Filter by dimensions
  • 20.
    Types of dimensions • • • • • ConformedDimension - A dimension that is shared across fact tables. Junk Dimension - A junk dimension is a convenient grouping of flags and indicators. For example, payment method, shipping method. De-generated Dimension - A dimension key, that has no attributes and hence does not have its own dimension table. For example, transaction number, invoice number. Value of these dimension is mostly unique within a fact table. Role Playing Dimensions - Role Playing dimension refers to a dimension that play different roles in fact tables depending on the context. For example, the Date dimension can be used for the ordered date, shipment date, and invoice date. Slowly Changing Dimensions - Dimensions that have data
  • 21.
    Types of SlowlyChanging Dimension • • • • Type1 - The Type 1 methodology overwrites old data with new data, and therefore does not track historical data at all. Type 2 - The Type 2 method tracks historical data by creating multiple records for a given value in dimension table with separate surrogate keys. Type 3 - The Type 3 method tracks changes using separate columns. Whereas Type 2 had unlimited history preservation, Type 3 has limited history preservation, as it's limited to the number of columns we designate for storing historical data. Type 4 - The Type 4 method is usually referred to as using "history tables", where one table keeps the current data, and an additional table is used to keep a record of all changes. Type 1, 2 and 3 are commonly used.
  • 22.
    Facts     Facts are valuesthat can be examined and analyzed. For Example - Page Views, Unique Users, Pieces Sold, Profit. Fact and measure are synonymous. Types of facts: – Additive - Measures that can be added across all dimensions. – Non Additive - Measures that cannot be added across all dimensions. – Semi Additive - Measures that can be added across few dimensions and not with others.
  • 23.
    How to storedata? Facts and Dimensions: 1. Select the business process to model 2. Declare the grain of the business process 3. Choose the dimensions that apply to each fact table row 4. Identify the numeric facts that will populate each fact table row
  • 24.
    Dimension Table    Contains attributesof dimensions e.g. Month is an attribute of Time dimension. Can also have foreign keys to another dimension table Usually identified by a unique integer primary key called surrogate key
  • 25.
    Fact Table    Contains Facts Foreignkeys to dimension tables Primary Key: usually composite key of all FKs
  • 26.
    Types of schemaused in data warehouse Star Schema    Snowflake Schema Fact Constellation Schema
  • 27.
    Star Schema    Multi-dimensional Data Dimensionand Fact Tables A fact table with pointers to Dimension tables
  • 28.
  • 29.
    Snowflake Schema   An extensionof star schema in which the dimension tables are partly or fully normalized. Dimension table hierarchies broken down into simpler tables.
  • 30.
  • 31.
    Fact Constellation Schema • •  Afact constellation schema allows dimension tables to be shared between fact tables. This Schema is used mainly for the aggregate fact tables, OR where we want to split a fact table for better comprehension. For example, a separate fact table for daily, weekly and monthly reporting requirement.
  • 32.
    Fact Constellation Schema Inthis example, the dimensions tables for time, item, and location are shared between both the sales and shipping fact tables.
  • 33.
    Operations on DataWarehouse     Drill Down Roll up Slice & Dice Pivoting
  • 34.
    Drill Down Product Category e.gHome Appliances Sub Category e.g Kitchen Appliances Product e.g Toaster Time
  • 35.
    Roll Up Year Fiscal Year Quarter FiscalQuarter Month Fiscal Month Fiscal Week Day
  • 36.
    Slice & Dice Product= Toaster Product Time Time
  • 37.
    Pivoting Product Product Time • • • Also called rotation Rotateon an axis Interchange Rows and Columns Region
  • 38.
    Advantages of DataWarehouse • • • • • One consistent data store for reporting, forecasting, and analysis Easier and timely access to data Scalability Trend analysis and detection Drill down analysis
  • 39.
    Disadvantages of DataWarehouse • Preparation may be time consuming. • High associated cost
  • 40.
    Case Study: WhyData Warehouse • • G2G Courier Pvt. Ltd. is an established brand in courier industry which has its own network in main cities and also have sub contracted in rural areas across the country to various partners. The President of the company wants to look deep into the financial health of the company and different performance aspects.
  • 41.
    Challenges Apart from G2G’sown transaction system, each partner has their own system which make the data very heterogeneous. • Granularity of data in various systems is also different. For eg: minute accuracy and day accuracy. • To do analysis on metrics like Revenue and Timely delivery across various geographical locations and partner, we need to have a unified system. •
  • 42.
    “Looks like weare doing good in South, is there any scope of further improvement???” “We are getting lot of complaints from the East, who exactly is the black sheep???”
  • 43.
    Sales Information Report: Revenueby region Region Revenue (lacs) % Change South 41 + 8.1 North 34 + 5.2 East 25 - 6.8 West 12 + 2.7 Report: Performance by partner Partner On Time Delivery Rate No. of complaints A 100 % 0 B 98 % 90 C 60 % 521
  • 44.
    Case Study: DataWarehouse Design • • • ABC Pvt Ltd is a new company which produces stationary products with production unit located at Ludhiana. They have sales units at Delhi, Bangalore. The President of the company wants sales information.
  • 45.
    Sales Information Report: Thenumber of units sold. 113 Report: The number of units sold over time January February March April 14 41 33 25 Report : The number of items sold for each product with time Jan Feb Apr 6 Black Cartridge Mar 17 8 Long notebook 6 16 6 Short notebook 8 25 21 Product
  • 46.
    Sales Information Report: Thenumber of items sold in each City for each product with time City Item Delhi Jan Feb Mar Apr Black Cartridge 3 16 6 Short Notebook 4 16 6 Bangalore Black Cartridge 3 Time Long Notebook 3 10 7 Long Notebook 3 8 Short Notebook 4 9 Product 15 City Item Jan Feb Mar Apr Delhi General Stationary 7 12 Ink & Toners Bangalore General Stationary Ink & Toners 3 7 9 10 15 8 3 7 Time 32 Product Category
  • 47.
    Identify sales Facts& Dimensions  Facts – Units sold  Dimensions – Product, Time, Region.  Fact Table City_ID Prod_ID 1 589 1 3 1 1218 1 4 2 589 1 3 2 1218 1 4 1  Time_Id Units 589 2 16 Time dimension table Time_Id Month 1 January 2012 2 February 2012
  • 48.
    Identify sales Facts& Dimensions Region Dimension Table City_ID City Region Country 1 Delhi North India 2 Bangalore South India Product Dimension Tables Prod_ID Product_Name Product_Category_ID 589 Black Cartridge 2 590 Long Notebook 1 288 Short Notebook 1 Product_Category_ID Product_Category 1 General Stationary 2 Ink & Toners
  • 49.
    Data warehouse model Time Product SalesFact Region Product Category
  • 50.

Editor's Notes

  • #16 CRMERP change to something simple