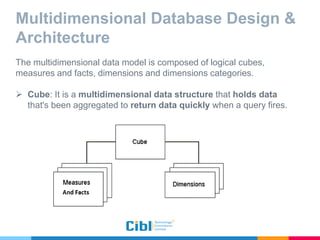
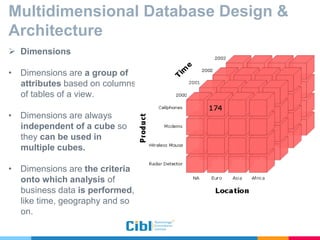
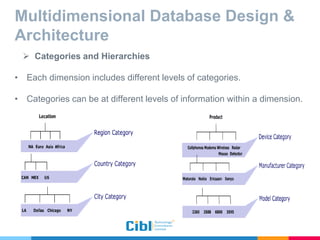
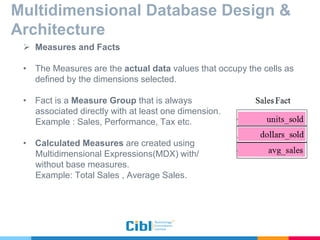
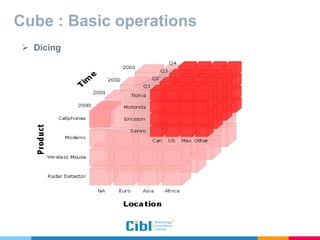
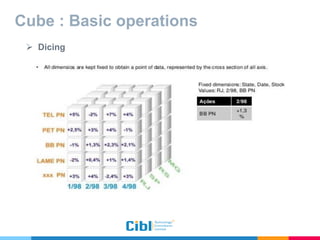
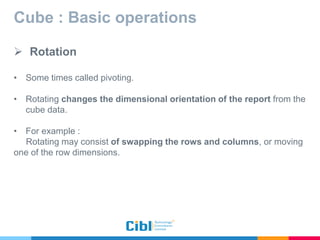
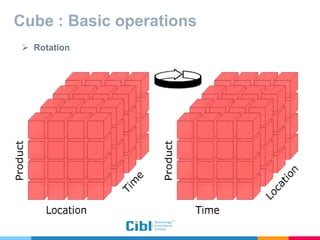
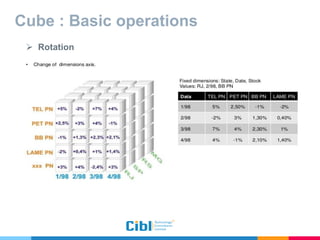
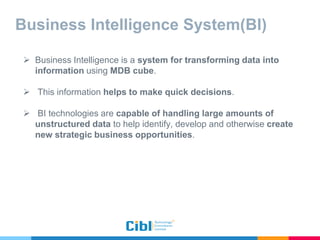
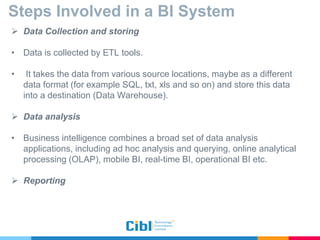
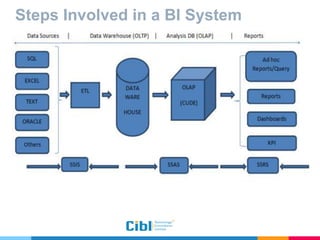
Business Intelligence and
Multi Dimensional Database
Contributed by
 Md. Rezaunnabi
Junior Officer,
Department of Engineering.
 Russel Chowdhury
Assistant Manager,
Department of Engineering.
Initiated and supervised by,
Muhammad Mahbub Hussain
Managing Director,
CIBL Technology Consultant Limited.
Contents
 How a general Business Application runs?
 Example of Relational Database of a Sales Application
 Problems of normal Business Application with Relational DB
 Multidimensional Database(MDB)
 Why Multidimensional Database?
 Multidimensional Database Design & Architecture
 Cube : Basic operations
 Business Intelligence System(BI)
 Steps Involved in a BI System : Data warehouse, Dimension modeling,OLAP
 Business Intelligence System providing Industry in Bangladesh
How a general business application
runs?
 It uses Relational Database.
 Relational Database model uses a two-dimensional structure of rows and
columns to store data.
 Tables can be linked by common key values.
Example of Relational Database of a
Sales Application
Product Table
Sales Table
Customer Table
Product Id Name Unit Price Sales Id
1 Headset Ball
Bearings
23 1
2 Chaining Nut 4 2
3 Mountain End
Caps
15 3
Sales Id Date Amount Customer Id
1 23-2-2016 4 2
2 28-2-2016 2 3
3 1-3-2016 6 1
Customer Id Name City Phone
1 Ruben Torres New York 500 555-0162
2 Christy Zhu San Francisco 500 555-0110
3 Marco Mehta Chicago 500 555-0162
 A Marketing Analyst of this system might ask following questions:
• How did a product sell last month?
• How does this figure compare to sales in the same month over
the last five years?
• How did the product sell by region, territory?
• Did this product sell better in particular regions? Are there
regional trends?
Problems of normal Business Application
with Relational DB
Problems of normal business application
with relational DB
 A normal Business Application with Relational Database may be
able to give answer to these questions . But will face some
difficulties -
• Accessing data requires complex joins of many tables where
there is a large number of tables.
• Complex queries takes huge time to return the results if there is a
lots of data.
Multidimensional Database(MDB)
• These overheads of relational database can be managed easily by
using Multidimensional Database(MDB).
 Multidimensional Database is defined as "a variation of the relational
model that uses multidimensional structures to organize data and
express the relationships between data".
 The structure is broken into cubes
and the cubes are able to store and
access data within the confines of
each cube(dimensions).
 In a multi-dimension database
system each individual data value
is contained within a cell accessible
by multiple indexes.
Why Multidimensional Database ?
 Databases are developed according to user's preferences, in
order to be used for specific types of retrievals.
 Enables interactive analyses of large amounts of data for decision-
making purposes
 Rapidly process the data in the database so that answers can be
generated quickly.
 Enhance data presentation and navigation by intuitive
spreadsheet like views that are difficult to generate in Relation
Database.
Multidimensional Database Design &
Architecture
The multidimensional data model is composed of logical cubes,
measures and facts, dimensions and dimensions categories.
 Cube: It is a multidimensional data structure that holds data
that's been aggregated to return data quickly when a query fires.
Multidimensional Database Design &
Architecture
 Dimensions
• Dimensions are a group of
attributes based on columns
of tables of a view.
• Dimensions are always
independent of a cube so
they can be used in
multiple cubes.
• Dimensions are the criteria
onto which analysis of
business data is performed,
like time, geography and so
on.
Multidimensional Database Design &
Architecture
 Categories and Hierarchies
• Each dimension includes different levels of categories.
• Categories can be at different levels of information within a dimension.
Multidimensional Database Design &
Architecture
 Measures and Facts
• The Measures are the actual data values that occupy the cells as
defined by the dimensions selected.
• Fact is a Measure Group that is always
associated directly with at least one dimension.
Example : Sales, Performance, Tax etc.
• Calculated Measures are created using
Multidimensional Expressions(MDX) with/
without base measures.
Example: Total Sales , Average Sales.
Cube : Basic operations
Three important operations associated with data cubes –
 Slicing
 Dicing
 Rotating
 Slicing
• The term slice most often refers to a two dimensional page selected
from the cube.
• Subset of a multidimensional array corresponding to a single value for
one or more members of the dimensions not in the subset.
• Two dimensions vary and one is kept fixed.
Cube : Basic operations
 Slicing
Slicing-Wireless Mouse
Cube : Basic operations
 Slicing
Cube : Basic operations
 Dicing
• A related operation to slicing.
• In the case of dicing, we define a sub cube of the original space.
• Dicing provides you the smallest available slice.
• All dimensions are kept fixed to obtain a point of data.
Cube : Basic operations
 Dicing
Cube : Basic operations
 Dicing
Cube : Basic operations
 Rotation
• Some times called pivoting.
• Rotating changes the dimensional orientation of the report from the
cube data.
• For example :
Rotating may consist of swapping the rows and columns, or moving
one of the row dimensions.
Cube : Basic operations
 Rotation
Cube : Basic operations
 Rotation
Business Intelligence System(BI)
 Business Intelligence is a system for transforming data into
information using MDB cube.
 This information helps to make quick decisions.
 BI technologies are capable of handling large amounts of
unstructured data to help identify, develop and otherwise create
new strategic business opportunities.
Steps Involved in a BI System
 Data Collection and storing
• Data is collected by ETL tools.
• It takes the data from various source locations, maybe as a different
data format (for example SQL, txt, xls and so on) and store this data
into a destination (Data Warehouse).
 Data analysis
• Business intelligence combines a broad set of data analysis
applications, including ad hoc analysis and querying, online analytical
processing (OLAP), mobile BI, real-time BI, operational BI etc.
 Reporting
Steps Involved in a BI System
 Data Collection and storing
Data, Data everywhere
yet ...
• I can’t find the data I need
data is scattered over the network
many versions, subtle differences
• I can’t get the data I need
need an expert to get the data
• I can’t understand the data I found
available data poorly documented
• I can’t use the data I found
results are unexpected
data needs to be transformed from one form
to other
Steps Involved in a BI System
 Data Collection and storing
• What is a Data Warehouse?
A single, complete and consistent store of
data obtained from a variety of different
sources made available to end users in a
what they can understand and use in a
business context.
• What is Data Warehousing?
A process of transforming data into information
and making it available to users in a timely enough
manner to make a difference
Data
Information
Steps Involved in a BI System :
Dimensional Modeling
 Dimensional modeling (DM) is a technique used in data
warehouse design.
 Dimensional Modeling is a logical design technique that present the
data in a standard framework that allows for high-performance
access.
 In DM, a model of tables and relations is constituted with the
purpose of optimizing decision support query performance in
relational databases.
Steps Involved in a BI System :
Dimensional Modeling
 Fact Table
• Fact Table consists of the Measures and Facts
of the business process.
• A Fact Table typically has two types of columns:
those that contains Measures(numerical values)
and those that are foreign key to Dimension Tables.
 Dimension Table
• The Dimension Table provides the detailed
information about the attributes in the Fact Table.
• Fact Tables connect to one or more Dimension Tables
but Fact Tables do not have direct relationships to
one another.
Steps Involved in a BI System :
Dimensional Modeling
 Star Scheme
• In the star schema design, a fact table sits in the middle and is
connected to other surrounding dimension tables like a star.
• A star schema has one dimension table for each dimension.
Steps Involved in a BI System :
Dimensional Modeling
 Star Scheme
Steps Involved in a BI System :
Dimensional Modeling
 Snowflake Scheme
• Snowflake schemas contain several Dimension Tables for each
dimension.
 Advantage and Disadvantage
• The main advantage of the snowflake schema is that it reduces the
space required to hold the data and the number of places where
it need to be updated if the data changes.
• The main disadvantage of the snowflake schema is that it increase
the number of tables that need to join in order to perform the
given query.
Steps Involved in a BI System :
Dimensional Modeling
 Snowflake Scheme
Steps Involved in a BI System
 Data Analysis
 OLAP (Online analytical processing)
• OLAP is a multidimensional, multiuser, client-server computing
environment for users who need to analyze enterprise data.
• OLAP performs multidimensional analysis of business data from data
warehouse.
• At the core of any OLAP system is an OLAP cube (also called a
'multidimensional cube' or a hyper cube).
• The usual interface to manipulate an OLAP cube is a matrix interface,
like Pivot Tables in a spreadsheet program, which performs projection
operations along the dimensions, such as aggregation or averaging.
Steps Involved in a BI System
 Data Analysis
 Applications of OLAP
• Finance departments use OLAP for applications such as budgeting,
activity-based costing (allocations), financial performance
analysis, and financial modeling.
• Sales departments use OLAP for sales analysis and forecasting.
• Marketing departments use OLAP for market research analysis,
sales forecasting, promotions analysis, customer analysis, and
market/customer segmentation.
• Typical manufacturing OLAP applications include production
planning and defect analysis.
Steps Involved in a BI System
 Data Analysis
 OLAP Tools
 IBM® Cognos® PowerPlay®
 Oracle Essbase
 Microsoft SQL Server Analysis Services (SSAS)
Steps Involved in a BI System
 Reporting:
• Various Business Intelligence Tools are used report data for Business
Intelligence like JasperReports, Crystal Reports, Microsoft
Sharepoint, Excel, Oracle Reports, Cognos BI etc.
• Some sample reports generated from OLAP cube on the next slide.
Steps Involved in a BI System
 Reporting example :
Figure: A OLAP report Using Windows Form Application
Steps Involved in a BI System
 Reporting example :
Figure: A OLAP report Using Microsoft Sharepoint
Steps Involved in a BI System
 Reporting example :
Figure: A OLAP report Using Microsoft Power BI
 Business Intelligence System
providing Industry in Bangladesh
 Business Intelligence System
providing Industry in Bangladesh
 Business Intelligence System
providing Industry in Bangladesh
Thank you!
Any questions?
Next Session -
Implementation of OLAP with SSAS
 Retreive data from a data warehouse
 Design and deploy a cube
 Generate a report from the cube
THE END

Business Intelligence and Multidimensional Database

  • 1.
    Business Intelligence and MultiDimensional Database
  • 2.
    Contributed by  Md.Rezaunnabi Junior Officer, Department of Engineering.  Russel Chowdhury Assistant Manager, Department of Engineering. Initiated and supervised by, Muhammad Mahbub Hussain Managing Director, CIBL Technology Consultant Limited.
  • 3.
    Contents  How ageneral Business Application runs?  Example of Relational Database of a Sales Application  Problems of normal Business Application with Relational DB  Multidimensional Database(MDB)  Why Multidimensional Database?  Multidimensional Database Design & Architecture  Cube : Basic operations  Business Intelligence System(BI)  Steps Involved in a BI System : Data warehouse, Dimension modeling,OLAP  Business Intelligence System providing Industry in Bangladesh
  • 4.
    How a generalbusiness application runs?  It uses Relational Database.  Relational Database model uses a two-dimensional structure of rows and columns to store data.  Tables can be linked by common key values.
  • 5.
    Example of RelationalDatabase of a Sales Application Product Table Sales Table Customer Table Product Id Name Unit Price Sales Id 1 Headset Ball Bearings 23 1 2 Chaining Nut 4 2 3 Mountain End Caps 15 3 Sales Id Date Amount Customer Id 1 23-2-2016 4 2 2 28-2-2016 2 3 3 1-3-2016 6 1 Customer Id Name City Phone 1 Ruben Torres New York 500 555-0162 2 Christy Zhu San Francisco 500 555-0110 3 Marco Mehta Chicago 500 555-0162
  • 6.
     A MarketingAnalyst of this system might ask following questions: • How did a product sell last month? • How does this figure compare to sales in the same month over the last five years? • How did the product sell by region, territory? • Did this product sell better in particular regions? Are there regional trends? Problems of normal Business Application with Relational DB
  • 7.
    Problems of normalbusiness application with relational DB  A normal Business Application with Relational Database may be able to give answer to these questions . But will face some difficulties - • Accessing data requires complex joins of many tables where there is a large number of tables. • Complex queries takes huge time to return the results if there is a lots of data.
  • 8.
    Multidimensional Database(MDB) • Theseoverheads of relational database can be managed easily by using Multidimensional Database(MDB).  Multidimensional Database is defined as "a variation of the relational model that uses multidimensional structures to organize data and express the relationships between data".  The structure is broken into cubes and the cubes are able to store and access data within the confines of each cube(dimensions).  In a multi-dimension database system each individual data value is contained within a cell accessible by multiple indexes.
  • 9.
    Why Multidimensional Database?  Databases are developed according to user's preferences, in order to be used for specific types of retrievals.  Enables interactive analyses of large amounts of data for decision- making purposes  Rapidly process the data in the database so that answers can be generated quickly.  Enhance data presentation and navigation by intuitive spreadsheet like views that are difficult to generate in Relation Database.
  • 10.
    Multidimensional Database Design& Architecture The multidimensional data model is composed of logical cubes, measures and facts, dimensions and dimensions categories.  Cube: It is a multidimensional data structure that holds data that's been aggregated to return data quickly when a query fires.
  • 11.
    Multidimensional Database Design& Architecture  Dimensions • Dimensions are a group of attributes based on columns of tables of a view. • Dimensions are always independent of a cube so they can be used in multiple cubes. • Dimensions are the criteria onto which analysis of business data is performed, like time, geography and so on.
  • 12.
    Multidimensional Database Design& Architecture  Categories and Hierarchies • Each dimension includes different levels of categories. • Categories can be at different levels of information within a dimension.
  • 13.
    Multidimensional Database Design& Architecture  Measures and Facts • The Measures are the actual data values that occupy the cells as defined by the dimensions selected. • Fact is a Measure Group that is always associated directly with at least one dimension. Example : Sales, Performance, Tax etc. • Calculated Measures are created using Multidimensional Expressions(MDX) with/ without base measures. Example: Total Sales , Average Sales.
  • 14.
    Cube : Basicoperations Three important operations associated with data cubes –  Slicing  Dicing  Rotating  Slicing • The term slice most often refers to a two dimensional page selected from the cube. • Subset of a multidimensional array corresponding to a single value for one or more members of the dimensions not in the subset. • Two dimensions vary and one is kept fixed.
  • 15.
    Cube : Basicoperations  Slicing Slicing-Wireless Mouse
  • 16.
    Cube : Basicoperations  Slicing
  • 17.
    Cube : Basicoperations  Dicing • A related operation to slicing. • In the case of dicing, we define a sub cube of the original space. • Dicing provides you the smallest available slice. • All dimensions are kept fixed to obtain a point of data.
  • 18.
    Cube : Basicoperations  Dicing
  • 19.
    Cube : Basicoperations  Dicing
  • 20.
    Cube : Basicoperations  Rotation • Some times called pivoting. • Rotating changes the dimensional orientation of the report from the cube data. • For example : Rotating may consist of swapping the rows and columns, or moving one of the row dimensions.
  • 21.
    Cube : Basicoperations  Rotation
  • 22.
    Cube : Basicoperations  Rotation
  • 23.
    Business Intelligence System(BI) Business Intelligence is a system for transforming data into information using MDB cube.  This information helps to make quick decisions.  BI technologies are capable of handling large amounts of unstructured data to help identify, develop and otherwise create new strategic business opportunities.
  • 24.
    Steps Involved ina BI System  Data Collection and storing • Data is collected by ETL tools. • It takes the data from various source locations, maybe as a different data format (for example SQL, txt, xls and so on) and store this data into a destination (Data Warehouse).  Data analysis • Business intelligence combines a broad set of data analysis applications, including ad hoc analysis and querying, online analytical processing (OLAP), mobile BI, real-time BI, operational BI etc.  Reporting
  • 25.
    Steps Involved ina BI System
  • 26.
    Steps Involved ina BI System  Data Collection and storing Data, Data everywhere yet ... • I can’t find the data I need data is scattered over the network many versions, subtle differences • I can’t get the data I need need an expert to get the data • I can’t understand the data I found available data poorly documented • I can’t use the data I found results are unexpected data needs to be transformed from one form to other
  • 27.
    Steps Involved ina BI System  Data Collection and storing • What is a Data Warehouse? A single, complete and consistent store of data obtained from a variety of different sources made available to end users in a what they can understand and use in a business context. • What is Data Warehousing? A process of transforming data into information and making it available to users in a timely enough manner to make a difference Data Information
  • 28.
    Steps Involved ina BI System : Dimensional Modeling  Dimensional modeling (DM) is a technique used in data warehouse design.  Dimensional Modeling is a logical design technique that present the data in a standard framework that allows for high-performance access.  In DM, a model of tables and relations is constituted with the purpose of optimizing decision support query performance in relational databases.
  • 29.
    Steps Involved ina BI System : Dimensional Modeling  Fact Table • Fact Table consists of the Measures and Facts of the business process. • A Fact Table typically has two types of columns: those that contains Measures(numerical values) and those that are foreign key to Dimension Tables.  Dimension Table • The Dimension Table provides the detailed information about the attributes in the Fact Table. • Fact Tables connect to one or more Dimension Tables but Fact Tables do not have direct relationships to one another.
  • 30.
    Steps Involved ina BI System : Dimensional Modeling  Star Scheme • In the star schema design, a fact table sits in the middle and is connected to other surrounding dimension tables like a star. • A star schema has one dimension table for each dimension.
  • 31.
    Steps Involved ina BI System : Dimensional Modeling  Star Scheme
  • 32.
    Steps Involved ina BI System : Dimensional Modeling  Snowflake Scheme • Snowflake schemas contain several Dimension Tables for each dimension.  Advantage and Disadvantage • The main advantage of the snowflake schema is that it reduces the space required to hold the data and the number of places where it need to be updated if the data changes. • The main disadvantage of the snowflake schema is that it increase the number of tables that need to join in order to perform the given query.
  • 33.
    Steps Involved ina BI System : Dimensional Modeling  Snowflake Scheme
  • 34.
    Steps Involved ina BI System  Data Analysis  OLAP (Online analytical processing) • OLAP is a multidimensional, multiuser, client-server computing environment for users who need to analyze enterprise data. • OLAP performs multidimensional analysis of business data from data warehouse. • At the core of any OLAP system is an OLAP cube (also called a 'multidimensional cube' or a hyper cube). • The usual interface to manipulate an OLAP cube is a matrix interface, like Pivot Tables in a spreadsheet program, which performs projection operations along the dimensions, such as aggregation or averaging.
  • 35.
    Steps Involved ina BI System  Data Analysis  Applications of OLAP • Finance departments use OLAP for applications such as budgeting, activity-based costing (allocations), financial performance analysis, and financial modeling. • Sales departments use OLAP for sales analysis and forecasting. • Marketing departments use OLAP for market research analysis, sales forecasting, promotions analysis, customer analysis, and market/customer segmentation. • Typical manufacturing OLAP applications include production planning and defect analysis.
  • 36.
    Steps Involved ina BI System  Data Analysis  OLAP Tools  IBM® Cognos® PowerPlay®  Oracle Essbase  Microsoft SQL Server Analysis Services (SSAS)
  • 37.
    Steps Involved ina BI System  Reporting: • Various Business Intelligence Tools are used report data for Business Intelligence like JasperReports, Crystal Reports, Microsoft Sharepoint, Excel, Oracle Reports, Cognos BI etc. • Some sample reports generated from OLAP cube on the next slide.
  • 38.
    Steps Involved ina BI System  Reporting example : Figure: A OLAP report Using Windows Form Application
  • 39.
    Steps Involved ina BI System  Reporting example : Figure: A OLAP report Using Microsoft Sharepoint
  • 40.
    Steps Involved ina BI System  Reporting example : Figure: A OLAP report Using Microsoft Power BI
  • 41.
     Business IntelligenceSystem providing Industry in Bangladesh
  • 42.
     Business IntelligenceSystem providing Industry in Bangladesh
  • 43.
     Business IntelligenceSystem providing Industry in Bangladesh
  • 44.
  • 45.
    Next Session - Implementationof OLAP with SSAS  Retreive data from a data warehouse  Design and deploy a cube  Generate a report from the cube THE END