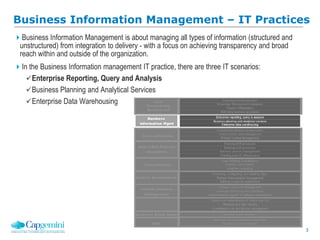
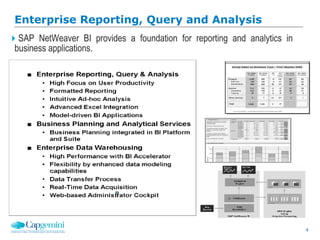
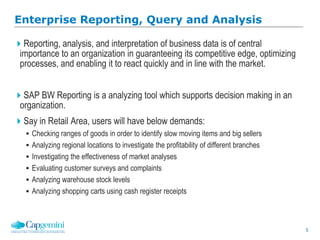
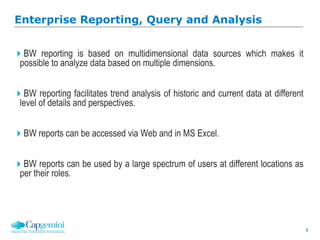
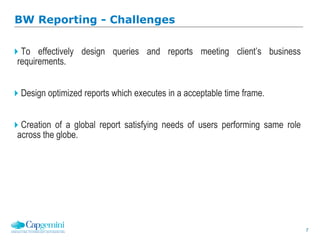
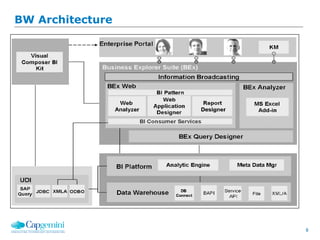
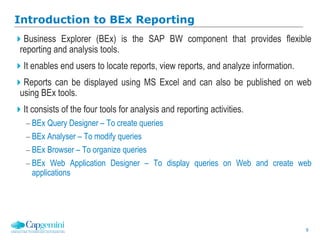
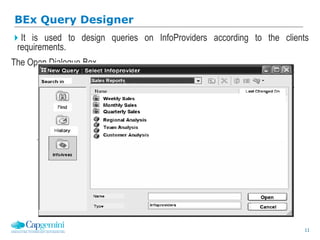
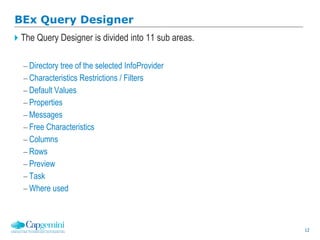
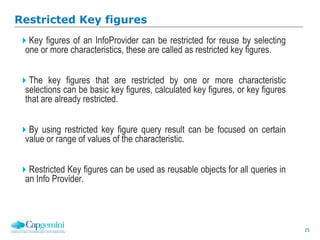
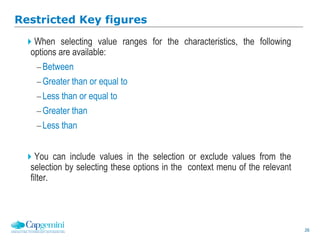
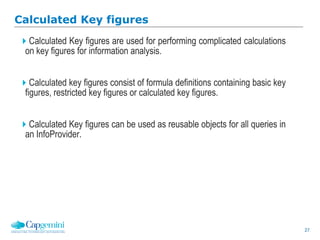
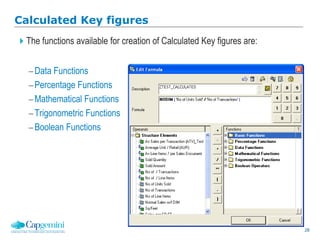
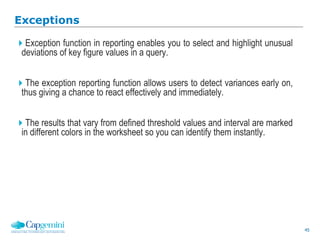
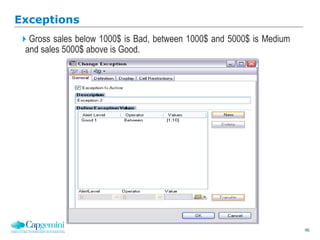
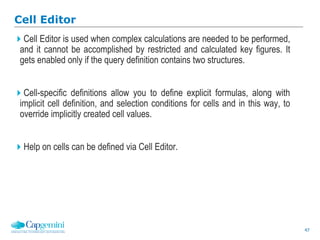
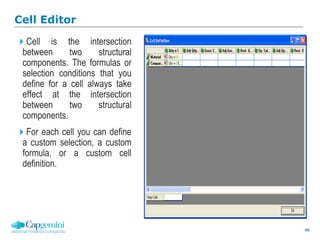
SlideShare a Scribd company logo
1 of 49
Download to read offline
Day 9/10
SAP BI Training
2
Introduction to BI Enterprise
Reporting
3
Business Information Management – IT Practices
Business Information Management is about managing all types of information (structured and
unstructured) from integration to delivery - with a focus on achieving transparency and broad
reach within and outside of the organization.
In the Business Information management IT practice, there are three IT scenarios:
Enterprise Reporting, Query and Analysis
Business Planning and Analytical Services
Enterprise Data Warehousing
4
SAP NetWeaver BI provides a foundation for reporting and analytics in
business applications.
Enterprise Reporting, Query and Analysis
5
Reporting, analysis, and interpretation of business data is of central
importance to an organization in guaranteeing its competitive edge, optimizing
processes, and enabling it to react quickly and in line with the market.
SAP BW Reporting is a analyzing tool which supports decision making in an
organization.
Say in Retail Area, users will have below demands:
 Checking ranges of goods in order to identify slow moving items and big sellers
 Analyzing regional locations to investigate the profitability of different branches
 Investigating the effectiveness of market analyses
 Evaluating customer surveys and complaints
 Analyzing warehouse stock levels
 Analyzing shopping carts using cash register receipts
Enterprise Reporting, Query and Analysis
6
BW reporting is based on multidimensional data sources which makes it
possible to analyze data based on multiple dimensions.
BW reporting facilitates trend analysis of historic and current data at different
level of details and perspectives.
BW reports can be accessed via Web and in MS Excel.
BW reports can be used by a large spectrum of users at different locations as
per their roles.
Enterprise Reporting, Query and Analysis
7
To effectively design queries and reports meeting client’s business
requirements.
Design optimized reports which executes in a acceptable time frame.
Creation of a global report satisfying needs of users performing same role
across the globe.
BW Reporting - Challenges
8
BW Architecture
9
Business Explorer (BEx) is the SAP BW component that provides flexible
reporting and analysis tools.
It enables end users to locate reports, view reports, and analyze information.
Reports can be displayed using MS Excel and can also be published on web
using BEx tools.
It consists of the four tools for analysis and reporting activities.
 BEx Query Designer – To create queries
 BEx Analyser – To modify queries
 BEx Browser – To organize queries
 BEx Web Application Designer – To display queries on Web and create web
applications
Introduction to BEx Reporting
10
BEx Query Designer
11
It is used to design queries on InfoProviders according to the clients
requirements.
The Open Dialogue Box
BEx Query Designer
12
The Query Designer is divided into 11 sub areas.
 Directory tree of the selected InfoProvider
 Characteristics Restrictions / Filters
 Default Values
 Properties
 Messages
 Free Characteristics
 Columns
 Rows
 Preview
 Task
 Where used
BEx Query Designer
13
BEx Query Designer
Filter
Toolbar
Directory tree for
selected
InfoProvider
Default
Values
Properties
Messages
14
BEx Query Designer
Free
characteris
tics
Columns
Rows
Preview
TasksWhere Used
15
BEx Query Designer
Directory tree of the selected InfoProvider
 This section contains key figures and characteristics (grouped in dimensions) of the
InfoProvider on which query is being created.
Filters
 Filter selection has a restricting effect on the entire query.
Default Values
 In this pane you define the characteristic filter values which should be used for the
initial view of the result set. The user may choose to modify these filters in the result.
Properties
 The settings relevant to the currently highlighted query object are displayed. You can
also make changes to the setting here.
16
BEx Query Designer
Messages
 This pane is where informational or error messages are displayed.
Free Characteristics
 Free characteristics can be used to drill down or drill across the report as required.
They don't appear when the report is originally executed, but the user has the
ability to use the free characteristics to slice and dice the data further.
Columns
 Usually Key indicators to be analyzed will be taken in columns.
Rows
 The characteristics on which the key indicators to be measured will be taken in
rows.
17
BEx Query Designer
Preview
 This area gives a preview of the query results area.
Tasks
 A list of suitable tasks relating to highlighted query object are displayed here,
you click on any of the tasks in the list to go directly to the settings.
Where Used
 Provides information relating to the use of the query object
18
BEx Toolbar
19
Sample BEx Query
20
InfoProviders in BEx Query Designer
InfoProvider is the generic term used to describe any objects or views relevant
to reporting.
These include objects that physically store data - the data targets, such as
InfoCubes, DataStore Objects, and InfoObjects (characteristics with attributes or
texts).
They also include objects that do not contain any physical data, such as
InfoSets, VirtualProviders
Note: Characteristic InfoObjects have to be included in the InfoProvider tree in
the Data Warehousing Workbench to make them available as data targets for
flexible updates and as InfoProviders for reporting and MultiProviders.
21
Elements of BEx Queries
BEx query designer provides several components which can be used for
designing queries.
 Structures
 Restricted Key figure
 Calculated Key figure
 New Selection
 New Formula
 Variables
22
Elements of BEx Queries
Some of the query elements can be reused in queries which are
based on the same InfoProviders.
The reusable query elements are:
Variables
Restricted key figures
Calculated key figures
Structures can be defined for reuse.
23
Structures
A structure forms the basic framework of the axes rows or columns in a
query.
It consists of structural components
like characteristics, keyfigures, formulas
and selections.
Set up of the structure determines the sequence and number of key
figures or characteristic values in the columns and rows of the query.
24
Structures
Within a query definition you can use either no structures or a
maximum of two structures. Of these, only one can be a key figure
structure.
You can combine structures freely with other characteristics on the
axes.
Structure can be defined as local or reusable.
25
Restricted Key figures
Key figures of an InfoProvider can be restricted for reuse by selecting
one or more characteristics, these are called as restricted key figures.
The key figures that are restricted by one or more characteristic
selections can be basic key figures, calculated key figures, or key figures
that are already restricted.
By using restricted key figure query result can be focused on certain
value or range of values of the characteristic.
Restricted Key figures can be used as reusable objects for all queries in
an Info Provider.
26
Restricted Key figures
When selecting value ranges for the characteristics, the following
options are available:
Between
Greater than or equal to
Less than or equal to
Greater than
Less than
You can include values in the selection or exclude values from the
selection by selecting these options in the context menu of the relevant
filter.
27
Calculated Key figures
Calculated Key figures are used for performing complicated calculations
on key figures for information analysis.
Calculated key figures consist of formula definitions containing basic key
figures, restricted key figures or calculated key figures.
Calculated Key figures can be used as reusable objects for all queries in
an InfoProvider.
28
Calculated Key figures
The functions available for creation of Calculated Key figures are:
Data Functions
Percentage Functions
Mathematical Functions
Trigonometric Functions
Boolean Functions
29
Calculated Key figures
Important Percentage Functions:
 Percentage Variance (%):
<operand1> % <operand2> - Gives the percentage variance of operand1
from operand2.
 Percentage Share (%A):
<operand1> %A <operand2> - Gives the percentage share of operand1 from
operand2.
 Percentage Share of Result (%CT):
%CT <operand> - Specifies how high the percentage share is in relation to
result.
 Percentage Share of Overall Result (%GT):
%GT <operand> - Specifies how high the percentage share is in relation to
overall result.
30
Calculated Key figures
Important Data Functions
 COUNT(<Expression>):
Delivers value 1 if the <Expression> is <>0, Otherwise 0.
 NDIV0(x):
Is equal to 0 with division by 0, otherwise x.
 NODIM(<Expression>):
Delivers purely numerical values of <Expression>, suppresses units and
currencies.
 SUMCT<operand>:
Delivers the result of operand in all rows or columns.
 SUMGT<operand>:
Delivers the overall result of operand.
 SUMRT<operand>:
Delivers the report result of operand.
31
Calculated Key figures
Important Mathematical and Trigonometric Functions
 Maximum
 Minimum
 Absolute Value
 Sine
 Cosine
Boolean Operations
 Is less than (<)
 Is greater than (>)
 Is not equal to (<>)
 Is less than or equal to (<=)
 Is greater than or equal to (>=)
 Logical NOT,AND,OR,XOR
32
Key figure Properties
Display Section
 Use Highlighting to highlight a key figure
 Hide options can be used to hide a key figure
Number Format
 Scaling factor can be used incase of high value of a key figure
 Number of decimal places
Calculations
 For Result
 For Single Value
Currency Translation
33
Characteristics Properties
Display As : Options available are Key, Text, Key and Text, Text and Key and No
Display.
Display of Results : Options for supressing results and normalization.
Display Hierarchy : Options for hierarchy display
Sort Order : Options for sorting characteristics.
34
New Selection
New Selection can be used for characteristics, key figures or for creating
local restricted key figures.
They can be created on structures.
35
New Formula
Formula allow arithmetic operations to be defined using one or more
basic key figures or formula variables or calculated key figures.
New Formula can be defined only on structure elements
36
New Formula
37
Integrating Hierarchies into Reports
Hierarchical Positioning of Characteristics and Key Figures
38
Integrating Hierarchies into Reports
Including External Hierarchies in Reports
39
Variables
Variables are parameters of a query that are filled with values only when
you execute the query or Web application.
They serve as place holders for characteristic values, hierarchies,
hierarchy nodes, texts and formula elements, and can be processed in
different ways.
The processing type determines how a variable is filled with a value for the
runtime of the query or Web application
Variables are reusable objects, if we create a variable for a Characteristic
InfoObject we can use that variable in all the InfoProviders that use this
characteristic.
40
There are different types of variables depending on the object for which
the variable is defined as placeholder.
Types of variables are:
- Characteristic value variables
• Characteristics value variables are used to select values of
characteristics in the query at runtime.
• Variables can be used to select single values and value ranges.
- Hierarchy variables
• Hierarchy variables represent hierarchies and can be used
wherever hierarchies can be selected.
Variable Types
41
- Hierarchy Node Variables
• Hierarchy node variables represent a node in a hierarchy and can
be used wherever hierarchy nodes are used.
- Text variables
• Text variables represent a text and can be used in descriptions of
queries, calculated key figures and structural components.
- Formula variables
• Formula variables represent numerical values and can be used in
formulas.
• Numerical values are used for selecting exceptions and conditions
and one can also use formula variables here.
Variable Types .. Contd..
42
The processing type of a variable determines how a variable is filled with a
value at runtime.
The following processing types are available:
- Manual Entry/Default Value
- Replacement Path
- Customer Exit
- SAP Exit
- Authorizations
Variable Processing Types
43
Conditions
Conditions can be formulated in the query designer to make data analysis
more efficient.
On defining condition, the data in the query is filtered accordingly so that only
the part of the results area that you are interested in is displayed.
With the help of conditions, we can analyze combinations of characteristics
using ranked lists. Example: Displaying ten best customers by sales revenue.
We can define multiple conditions for a query, and then activate or deactivate
them in the report itself to create different views of the data.
44
Conditions
Example: The sales department wants the flexibility to restrict a report so
that only ‘Top 10’ materials as per Gross Sales are displayed.
45
Exceptions
Exception function in reporting enables you to select and highlight unusual
deviations of key figure values in a query.
The exception reporting function allows users to detect variances early on,
thus giving a chance to react effectively and immediately.
The results that vary from defined threshold values and interval are marked
in different colors in the worksheet so you can identify them instantly.
46
Exceptions
Gross sales below 1000$ is Bad, between 1000$ and 5000$ is Medium
and sales 5000$ above is Good.
47
Cell Editor
Cell Editor is used when complex calculations are needed to be performed,
and it cannot be accomplished by restricted and calculated key figures. It
gets enabled only if the query definition contains two structures.
Cell-specific definitions allow you to define explicit formulas, along with
implicit cell definition, and selection conditions for cells and in this way, to
override implicitly created cell values.
Help on cells can be defined via Cell Editor.
48
Cell Editor
Cell is the intersection
between two structural
components. The formulas or
selection conditions that you
define for a cell always take
effect at the intersection
between two structural
components.
For each cell you can define
a custom selection, a custom
formula, or a custom cell
definition.
Thank You.

More Related Content

What's hot

SAP BW on HANA Training
SAP BW on HANA  TrainingSAP BW on HANA  Training
SAP BW on HANA TrainingVenkat reddy
 
Bw training 1 intro dw
Bw training   1 intro dwBw training   1 intro dw
Bw training 1 intro dwJoseph Tham
 
Sap bi 7.3 Features
Sap bi 7.3 FeaturesSap bi 7.3 Features
Sap bi 7.3 FeaturesSamar Reddy
 
Differences Between Bw3.5 Bi7.0
Differences Between Bw3.5 Bi7.0Differences Between Bw3.5 Bi7.0
Differences Between Bw3.5 Bi7.0srinath_vj
 
Sap bi training with bo integrations
Sap bi training with bo integrationsSap bi training with bo integrations
Sap bi training with bo integrationspjraosapbi
 
SAP BW Reports - Copy
SAP BW Reports - CopySAP BW Reports - Copy
SAP BW Reports - CopyAby m
 
Sap bi step by step procedure for data archiving by adk and reloading archive...
Sap bi step by step procedure for data archiving by adk and reloading archive...Sap bi step by step procedure for data archiving by adk and reloading archive...
Sap bi step by step procedure for data archiving by adk and reloading archive...Charanjit Singh
 
Sap business objects 4 quick start manual
Sap business objects 4 quick start manualSap business objects 4 quick start manual
Sap business objects 4 quick start manualDmitry Anoshin
 
Imran Shaik BIBW
Imran Shaik BIBWImran Shaik BIBW
Imran Shaik BIBWImran Shaik
 
Obiee interview questions and answers faq
Obiee interview questions and answers faqObiee interview questions and answers faq
Obiee interview questions and answers faqmaheshboggula
 
Data Archiving -Ramesh sap bw
Data Archiving -Ramesh sap bwData Archiving -Ramesh sap bw
Data Archiving -Ramesh sap bwramesh rao
 

What's hot (20)

SAP BW Introduction.
SAP BW Introduction.SAP BW Introduction.
SAP BW Introduction.
 
SAP BW on HANA Training
SAP BW on HANA  TrainingSAP BW on HANA  Training
SAP BW on HANA Training
 
Bw training 1 intro dw
Bw training   1 intro dwBw training   1 intro dw
Bw training 1 intro dw
 
Sap bi 7.3 Features
Sap bi 7.3 FeaturesSap bi 7.3 Features
Sap bi 7.3 Features
 
Differences Between Bw3.5 Bi7.0
Differences Between Bw3.5 Bi7.0Differences Between Bw3.5 Bi7.0
Differences Between Bw3.5 Bi7.0
 
Sap bi training with bo integrations
Sap bi training with bo integrationsSap bi training with bo integrations
Sap bi training with bo integrations
 
SAP BW Reports - Copy
SAP BW Reports - CopySAP BW Reports - Copy
SAP BW Reports - Copy
 
Bw_Hana
Bw_HanaBw_Hana
Bw_Hana
 
Sap bi step by step procedure for data archiving by adk and reloading archive...
Sap bi step by step procedure for data archiving by adk and reloading archive...Sap bi step by step procedure for data archiving by adk and reloading archive...
Sap bi step by step procedure for data archiving by adk and reloading archive...
 
Hybrid provideer
Hybrid provideerHybrid provideer
Hybrid provideer
 
Sap business warehouse_v1
Sap business warehouse_v1Sap business warehouse_v1
Sap business warehouse_v1
 
Sap business objects 4 quick start manual
Sap business objects 4 quick start manualSap business objects 4 quick start manual
Sap business objects 4 quick start manual
 
Imran Shaik BIBW
Imran Shaik BIBWImran Shaik BIBW
Imran Shaik BIBW
 
SAP data archiving
SAP data archivingSAP data archiving
SAP data archiving
 
SAP BW connect db
SAP BW connect dbSAP BW connect db
SAP BW connect db
 
Cool features 7.4
Cool features 7.4Cool features 7.4
Cool features 7.4
 
Obiee interview questions and answers faq
Obiee interview questions and answers faqObiee interview questions and answers faq
Obiee interview questions and answers faq
 
Oracle: DW Design
Oracle: DW DesignOracle: DW Design
Oracle: DW Design
 
Data Archiving -Ramesh sap bw
Data Archiving -Ramesh sap bwData Archiving -Ramesh sap bw
Data Archiving -Ramesh sap bw
 
ETL Process
ETL ProcessETL Process
ETL Process
 

Viewers also liked

Xi4sp2 biw getstart_en
Xi4sp2 biw getstart_enXi4sp2 biw getstart_en
Xi4sp2 biw getstart_entovetrivel
 
Bw writing routines in update rules
Bw writing routines in update rulesBw writing routines in update rules
Bw writing routines in update rulesknreddyy
 
SAP BW - Data store objects
SAP BW - Data store objectsSAP BW - Data store objects
SAP BW - Data store objectsYasmin Ashraf
 
SAP BW - Creation of hierarchies (time dependant hierachy structures)
SAP BW - Creation of hierarchies (time dependant hierachy structures)SAP BW - Creation of hierarchies (time dependant hierachy structures)
SAP BW - Creation of hierarchies (time dependant hierachy structures)Yasmin Ashraf
 
SAP BW - Master data load via flat file
SAP BW - Master data load via flat fileSAP BW - Master data load via flat file
SAP BW - Master data load via flat fileYasmin Ashraf
 
Real World Business Intelligence and Data Warehousing
Real World Business Intelligence and Data WarehousingReal World Business Intelligence and Data Warehousing
Real World Business Intelligence and Data Warehousingukc4
 
Xi4sp2 universe design_tool_en
Xi4sp2 universe design_tool_enXi4sp2 universe design_tool_en
Xi4sp2 universe design_tool_entovetrivel
 
SAP BPC NW 10.0 Master Data Load to BPC from BW
SAP BPC NW 10.0 Master Data Load to BPC from BWSAP BPC NW 10.0 Master Data Load to BPC from BW
SAP BPC NW 10.0 Master Data Load to BPC from BWCloneskills
 
Intro to Design Thinking English (Wallet Exercise)
Intro to Design Thinking English (Wallet Exercise) Intro to Design Thinking English (Wallet Exercise)
Intro to Design Thinking English (Wallet Exercise) Max Oliva
 

Viewers also liked (14)

Lab3
Lab3Lab3
Lab3
 
Lab1
Lab1Lab1
Lab1
 
Xi4sp2 biw getstart_en
Xi4sp2 biw getstart_enXi4sp2 biw getstart_en
Xi4sp2 biw getstart_en
 
SAP BI Training
SAP BI TrainingSAP BI Training
SAP BI Training
 
SAP BI - Made easy
SAP BI - Made easySAP BI - Made easy
SAP BI - Made easy
 
Usgage of ABAP in BI
Usgage of ABAP in BIUsgage of ABAP in BI
Usgage of ABAP in BI
 
Bw writing routines in update rules
Bw writing routines in update rulesBw writing routines in update rules
Bw writing routines in update rules
 
SAP BW - Data store objects
SAP BW - Data store objectsSAP BW - Data store objects
SAP BW - Data store objects
 
SAP BW - Creation of hierarchies (time dependant hierachy structures)
SAP BW - Creation of hierarchies (time dependant hierachy structures)SAP BW - Creation of hierarchies (time dependant hierachy structures)
SAP BW - Creation of hierarchies (time dependant hierachy structures)
 
SAP BW - Master data load via flat file
SAP BW - Master data load via flat fileSAP BW - Master data load via flat file
SAP BW - Master data load via flat file
 
Real World Business Intelligence and Data Warehousing
Real World Business Intelligence and Data WarehousingReal World Business Intelligence and Data Warehousing
Real World Business Intelligence and Data Warehousing
 
Xi4sp2 universe design_tool_en
Xi4sp2 universe design_tool_enXi4sp2 universe design_tool_en
Xi4sp2 universe design_tool_en
 
SAP BPC NW 10.0 Master Data Load to BPC from BW
SAP BPC NW 10.0 Master Data Load to BPC from BWSAP BPC NW 10.0 Master Data Load to BPC from BW
SAP BPC NW 10.0 Master Data Load to BPC from BW
 
Intro to Design Thinking English (Wallet Exercise)
Intro to Design Thinking English (Wallet Exercise) Intro to Design Thinking English (Wallet Exercise)
Intro to Design Thinking English (Wallet Exercise)
 

Similar to Day 9 __10_introduction_to_bi_enterprise_reporting_1___2

Unit 2 b_ex_query_designer
Unit 2 b_ex_query_designerUnit 2 b_ex_query_designer
Unit 2 b_ex_query_designerOnur Sezen
 
Saphelp erp2004 en_9d_76563cc368b60fe10000000a114084_content
Saphelp erp2004 en_9d_76563cc368b60fe10000000a114084_contentSaphelp erp2004 en_9d_76563cc368b60fe10000000a114084_content
Saphelp erp2004 en_9d_76563cc368b60fe10000000a114084_contentmgassperera
 
Reporting with cloud solutions from SAP
Reporting with cloud solutions from SAPReporting with cloud solutions from SAP
Reporting with cloud solutions from SAPAndreas Eißmann
 
Business Intelligence tools comparison
Business Intelligence tools comparisonBusiness Intelligence tools comparison
Business Intelligence tools comparisonStratebi
 
Obiee introduction building reports by QuontraSolutions
Obiee introduction building reports by QuontraSolutionsObiee introduction building reports by QuontraSolutions
Obiee introduction building reports by QuontraSolutionsQUONTRASOLUTIONS
 
MSBI-SQL Server Reporting Services
MSBI-SQL Server Reporting ServicesMSBI-SQL Server Reporting Services
MSBI-SQL Server Reporting ServicesThejaswi shasthri
 
Analyzing and Visualizing Data with Power BI (SF)_Student.pptx
Analyzing and Visualizing Data with Power BI (SF)_Student.pptxAnalyzing and Visualizing Data with Power BI (SF)_Student.pptx
Analyzing and Visualizing Data with Power BI (SF)_Student.pptxAlexChua42
 
Using MS Excel In Your Next Audit - Top Basic & Intermediate Techniques
Using MS Excel In Your Next Audit - Top Basic & Intermediate Techniques Using MS Excel In Your Next Audit - Top Basic & Intermediate Techniques
Using MS Excel In Your Next Audit - Top Basic & Intermediate Techniques Jim Kaplan CIA CFE
 
Sql query analyzer & maintenance
Sql query analyzer & maintenanceSql query analyzer & maintenance
Sql query analyzer & maintenancenspyrenet
 
Agile Methodology Approach to SSRS Reporting
Agile Methodology Approach to SSRS ReportingAgile Methodology Approach to SSRS Reporting
Agile Methodology Approach to SSRS ReportingDanielson Samuel
 
Obiee introductionbuildingreports-pennon-soft
Obiee introductionbuildingreports-pennon-softObiee introductionbuildingreports-pennon-soft
Obiee introductionbuildingreports-pennon-softPennonSoft
 
New dimensions for_reporting
New dimensions for_reportingNew dimensions for_reporting
New dimensions for_reportingRahul Mahajan
 
Case Study: How Caixa Econômica in Brazil Uses IBM® Rational® Insight and Per...
Case Study: How Caixa Econômica in Brazil Uses IBM® Rational® Insight and Per...Case Study: How Caixa Econômica in Brazil Uses IBM® Rational® Insight and Per...
Case Study: How Caixa Econômica in Brazil Uses IBM® Rational® Insight and Per...Paulo Lacerda
 
OBIEE - Introduction & building reports
OBIEE - Introduction & building reportsOBIEE - Introduction & building reports
OBIEE - Introduction & building reportsDeepika Raipuria
 
Otbi and bicc_psr_technote_v3_final_document
Otbi and bicc_psr_technote_v3_final_documentOtbi and bicc_psr_technote_v3_final_document
Otbi and bicc_psr_technote_v3_final_documentHamadaAsmrAladham1
 
Bi Architecture And Conceptual Framework
Bi Architecture And Conceptual FrameworkBi Architecture And Conceptual Framework
Bi Architecture And Conceptual FrameworkSlava Kokaev
 
Business Intelligence Module 5
Business Intelligence Module 5Business Intelligence Module 5
Business Intelligence Module 5Home
 

Similar to Day 9 __10_introduction_to_bi_enterprise_reporting_1___2 (20)

Unit 2 b_ex_query_designer
Unit 2 b_ex_query_designerUnit 2 b_ex_query_designer
Unit 2 b_ex_query_designer
 
Saphelp erp2004 en_9d_76563cc368b60fe10000000a114084_content
Saphelp erp2004 en_9d_76563cc368b60fe10000000a114084_contentSaphelp erp2004 en_9d_76563cc368b60fe10000000a114084_content
Saphelp erp2004 en_9d_76563cc368b60fe10000000a114084_content
 
Reporting with cloud solutions from SAP
Reporting with cloud solutions from SAPReporting with cloud solutions from SAP
Reporting with cloud solutions from SAP
 
Power BI Interview Questions
Power BI Interview QuestionsPower BI Interview Questions
Power BI Interview Questions
 
Business Intelligence tools comparison
Business Intelligence tools comparisonBusiness Intelligence tools comparison
Business Intelligence tools comparison
 
Obiee introduction building reports by QuontraSolutions
Obiee introduction building reports by QuontraSolutionsObiee introduction building reports by QuontraSolutions
Obiee introduction building reports by QuontraSolutions
 
MSBI-SQL Server Reporting Services
MSBI-SQL Server Reporting ServicesMSBI-SQL Server Reporting Services
MSBI-SQL Server Reporting Services
 
Analyzing and Visualizing Data with Power BI (SF)_Student.pptx
Analyzing and Visualizing Data with Power BI (SF)_Student.pptxAnalyzing and Visualizing Data with Power BI (SF)_Student.pptx
Analyzing and Visualizing Data with Power BI (SF)_Student.pptx
 
Using MS Excel In Your Next Audit - Top Basic & Intermediate Techniques
Using MS Excel In Your Next Audit - Top Basic & Intermediate Techniques Using MS Excel In Your Next Audit - Top Basic & Intermediate Techniques
Using MS Excel In Your Next Audit - Top Basic & Intermediate Techniques
 
Sql query analyzer & maintenance
Sql query analyzer & maintenanceSql query analyzer & maintenance
Sql query analyzer & maintenance
 
Agile Methodology Approach to SSRS Reporting
Agile Methodology Approach to SSRS ReportingAgile Methodology Approach to SSRS Reporting
Agile Methodology Approach to SSRS Reporting
 
Obiee introductionbuildingreports-pennon-soft
Obiee introductionbuildingreports-pennon-softObiee introductionbuildingreports-pennon-soft
Obiee introductionbuildingreports-pennon-soft
 
New dimensions for_reporting
New dimensions for_reportingNew dimensions for_reporting
New dimensions for_reporting
 
Case Study: How Caixa Econômica in Brazil Uses IBM® Rational® Insight and Per...
Case Study: How Caixa Econômica in Brazil Uses IBM® Rational® Insight and Per...Case Study: How Caixa Econômica in Brazil Uses IBM® Rational® Insight and Per...
Case Study: How Caixa Econômica in Brazil Uses IBM® Rational® Insight and Per...
 
OBIEE - Introduction & building reports
OBIEE - Introduction & building reportsOBIEE - Introduction & building reports
OBIEE - Introduction & building reports
 
Otbi and bicc_psr_technote_v3_final_document
Otbi and bicc_psr_technote_v3_final_documentOtbi and bicc_psr_technote_v3_final_document
Otbi and bicc_psr_technote_v3_final_document
 
Obiee introductionbuildingreports
Obiee introductionbuildingreportsObiee introductionbuildingreports
Obiee introductionbuildingreports
 
Bi Architecture And Conceptual Framework
Bi Architecture And Conceptual FrameworkBi Architecture And Conceptual Framework
Bi Architecture And Conceptual Framework
 
Business Intelligence Module 5
Business Intelligence Module 5Business Intelligence Module 5
Business Intelligence Module 5
 
Presentation of se
Presentation of sePresentation of se
Presentation of se
 

Recently uploaded

My INSURER PTE LTD - Insurtech Innovation Award 2024
My INSURER PTE LTD - Insurtech Innovation Award 2024My INSURER PTE LTD - Insurtech Innovation Award 2024
My INSURER PTE LTD - Insurtech Innovation Award 2024The Digital Insurer
 
Designing IA for AI - Information Architecture Conference 2024
Designing IA for AI - Information Architecture Conference 2024Designing IA for AI - Information Architecture Conference 2024
Designing IA for AI - Information Architecture Conference 2024Enterprise Knowledge
 
Scanning the Internet for External Cloud Exposures via SSL Certs
Scanning the Internet for External Cloud Exposures via SSL CertsScanning the Internet for External Cloud Exposures via SSL Certs
Scanning the Internet for External Cloud Exposures via SSL CertsRizwan Syed
 
CloudStudio User manual (basic edition):
CloudStudio User manual (basic edition):CloudStudio User manual (basic edition):
CloudStudio User manual (basic edition):comworks
 
Tampa BSides - Chef's Tour of Microsoft Security Adoption Framework (SAF)
Tampa BSides - Chef's Tour of Microsoft Security Adoption Framework (SAF)Tampa BSides - Chef's Tour of Microsoft Security Adoption Framework (SAF)
Tampa BSides - Chef's Tour of Microsoft Security Adoption Framework (SAF)Mark Simos
 
Tech-Forward - Achieving Business Readiness For Copilot in Microsoft 365
Tech-Forward - Achieving Business Readiness For Copilot in Microsoft 365Tech-Forward - Achieving Business Readiness For Copilot in Microsoft 365
Tech-Forward - Achieving Business Readiness For Copilot in Microsoft 3652toLead Limited
 
Vertex AI Gemini Prompt Engineering Tips
Vertex AI Gemini Prompt Engineering TipsVertex AI Gemini Prompt Engineering Tips
Vertex AI Gemini Prompt Engineering TipsMiki Katsuragi
 
SQL Database Design For Developers at php[tek] 2024
SQL Database Design For Developers at php[tek] 2024SQL Database Design For Developers at php[tek] 2024
SQL Database Design For Developers at php[tek] 2024Scott Keck-Warren
 
Benefits Of Flutter Compared To Other Frameworks
Benefits Of Flutter Compared To Other FrameworksBenefits Of Flutter Compared To Other Frameworks
Benefits Of Flutter Compared To Other FrameworksSoftradix Technologies
 
costume and set research powerpoint presentation
costume and set research powerpoint presentationcostume and set research powerpoint presentation
costume and set research powerpoint presentationphoebematthew05
 
Advanced Test Driven-Development @ php[tek] 2024
Advanced Test Driven-Development @ php[tek] 2024Advanced Test Driven-Development @ php[tek] 2024
Advanced Test Driven-Development @ php[tek] 2024Scott Keck-Warren
 
AI as an Interface for Commercial Buildings
AI as an Interface for Commercial BuildingsAI as an Interface for Commercial Buildings
AI as an Interface for Commercial BuildingsMemoori
 
Human Factors of XR: Using Human Factors to Design XR Systems
Human Factors of XR: Using Human Factors to Design XR SystemsHuman Factors of XR: Using Human Factors to Design XR Systems
Human Factors of XR: Using Human Factors to Design XR SystemsMark Billinghurst
 
Artificial intelligence in the post-deep learning era
Artificial intelligence in the post-deep learning eraArtificial intelligence in the post-deep learning era
Artificial intelligence in the post-deep learning eraDeakin University
 
Beyond Boundaries: Leveraging No-Code Solutions for Industry Innovation
Beyond Boundaries: Leveraging No-Code Solutions for Industry InnovationBeyond Boundaries: Leveraging No-Code Solutions for Industry Innovation
Beyond Boundaries: Leveraging No-Code Solutions for Industry InnovationSafe Software
 
Unleash Your Potential - Namagunga Girls Coding Club
Unleash Your Potential - Namagunga Girls Coding ClubUnleash Your Potential - Namagunga Girls Coding Club
Unleash Your Potential - Namagunga Girls Coding ClubKalema Edgar
 
"ML in Production",Oleksandr Bagan
"ML in Production",Oleksandr Bagan"ML in Production",Oleksandr Bagan
"ML in Production",Oleksandr BaganFwdays
 
Nell’iperspazio con Rocket: il Framework Web di Rust!
Nell’iperspazio con Rocket: il Framework Web di Rust!Nell’iperspazio con Rocket: il Framework Web di Rust!
Nell’iperspazio con Rocket: il Framework Web di Rust!Commit University
 

Recently uploaded (20)

My INSURER PTE LTD - Insurtech Innovation Award 2024
My INSURER PTE LTD - Insurtech Innovation Award 2024My INSURER PTE LTD - Insurtech Innovation Award 2024
My INSURER PTE LTD - Insurtech Innovation Award 2024
 
Designing IA for AI - Information Architecture Conference 2024
Designing IA for AI - Information Architecture Conference 2024Designing IA for AI - Information Architecture Conference 2024
Designing IA for AI - Information Architecture Conference 2024
 
Scanning the Internet for External Cloud Exposures via SSL Certs
Scanning the Internet for External Cloud Exposures via SSL CertsScanning the Internet for External Cloud Exposures via SSL Certs
Scanning the Internet for External Cloud Exposures via SSL Certs
 
CloudStudio User manual (basic edition):
CloudStudio User manual (basic edition):CloudStudio User manual (basic edition):
CloudStudio User manual (basic edition):
 
Tampa BSides - Chef's Tour of Microsoft Security Adoption Framework (SAF)
Tampa BSides - Chef's Tour of Microsoft Security Adoption Framework (SAF)Tampa BSides - Chef's Tour of Microsoft Security Adoption Framework (SAF)
Tampa BSides - Chef's Tour of Microsoft Security Adoption Framework (SAF)
 
Tech-Forward - Achieving Business Readiness For Copilot in Microsoft 365
Tech-Forward - Achieving Business Readiness For Copilot in Microsoft 365Tech-Forward - Achieving Business Readiness For Copilot in Microsoft 365
Tech-Forward - Achieving Business Readiness For Copilot in Microsoft 365
 
Vertex AI Gemini Prompt Engineering Tips
Vertex AI Gemini Prompt Engineering TipsVertex AI Gemini Prompt Engineering Tips
Vertex AI Gemini Prompt Engineering Tips
 
SQL Database Design For Developers at php[tek] 2024
SQL Database Design For Developers at php[tek] 2024SQL Database Design For Developers at php[tek] 2024
SQL Database Design For Developers at php[tek] 2024
 
Benefits Of Flutter Compared To Other Frameworks
Benefits Of Flutter Compared To Other FrameworksBenefits Of Flutter Compared To Other Frameworks
Benefits Of Flutter Compared To Other Frameworks
 
costume and set research powerpoint presentation
costume and set research powerpoint presentationcostume and set research powerpoint presentation
costume and set research powerpoint presentation
 
Advanced Test Driven-Development @ php[tek] 2024
Advanced Test Driven-Development @ php[tek] 2024Advanced Test Driven-Development @ php[tek] 2024
Advanced Test Driven-Development @ php[tek] 2024
 
AI as an Interface for Commercial Buildings
AI as an Interface for Commercial BuildingsAI as an Interface for Commercial Buildings
AI as an Interface for Commercial Buildings
 
Human Factors of XR: Using Human Factors to Design XR Systems
Human Factors of XR: Using Human Factors to Design XR SystemsHuman Factors of XR: Using Human Factors to Design XR Systems
Human Factors of XR: Using Human Factors to Design XR Systems
 
Artificial intelligence in the post-deep learning era
Artificial intelligence in the post-deep learning eraArtificial intelligence in the post-deep learning era
Artificial intelligence in the post-deep learning era
 
Beyond Boundaries: Leveraging No-Code Solutions for Industry Innovation
Beyond Boundaries: Leveraging No-Code Solutions for Industry InnovationBeyond Boundaries: Leveraging No-Code Solutions for Industry Innovation
Beyond Boundaries: Leveraging No-Code Solutions for Industry Innovation
 
Unleash Your Potential - Namagunga Girls Coding Club
Unleash Your Potential - Namagunga Girls Coding ClubUnleash Your Potential - Namagunga Girls Coding Club
Unleash Your Potential - Namagunga Girls Coding Club
 
"ML in Production",Oleksandr Bagan
"ML in Production",Oleksandr Bagan"ML in Production",Oleksandr Bagan
"ML in Production",Oleksandr Bagan
 
Nell’iperspazio con Rocket: il Framework Web di Rust!
Nell’iperspazio con Rocket: il Framework Web di Rust!Nell’iperspazio con Rocket: il Framework Web di Rust!
Nell’iperspazio con Rocket: il Framework Web di Rust!
 
E-Vehicle_Hacking_by_Parul Sharma_null_owasp.pptx
E-Vehicle_Hacking_by_Parul Sharma_null_owasp.pptxE-Vehicle_Hacking_by_Parul Sharma_null_owasp.pptx
E-Vehicle_Hacking_by_Parul Sharma_null_owasp.pptx
 
Vulnerability_Management_GRC_by Sohang Sengupta.pptx
Vulnerability_Management_GRC_by Sohang Sengupta.pptxVulnerability_Management_GRC_by Sohang Sengupta.pptx
Vulnerability_Management_GRC_by Sohang Sengupta.pptx
 

Day 9 __10_introduction_to_bi_enterprise_reporting_1___2

  • 1. Day 9/10 SAP BI Training
  • 2. 2 Introduction to BI Enterprise Reporting
  • 3. 3 Business Information Management – IT Practices Business Information Management is about managing all types of information (structured and unstructured) from integration to delivery - with a focus on achieving transparency and broad reach within and outside of the organization. In the Business Information management IT practice, there are three IT scenarios: Enterprise Reporting, Query and Analysis Business Planning and Analytical Services Enterprise Data Warehousing
  • 4. 4 SAP NetWeaver BI provides a foundation for reporting and analytics in business applications. Enterprise Reporting, Query and Analysis
  • 5. 5 Reporting, analysis, and interpretation of business data is of central importance to an organization in guaranteeing its competitive edge, optimizing processes, and enabling it to react quickly and in line with the market. SAP BW Reporting is a analyzing tool which supports decision making in an organization. Say in Retail Area, users will have below demands:  Checking ranges of goods in order to identify slow moving items and big sellers  Analyzing regional locations to investigate the profitability of different branches  Investigating the effectiveness of market analyses  Evaluating customer surveys and complaints  Analyzing warehouse stock levels  Analyzing shopping carts using cash register receipts Enterprise Reporting, Query and Analysis
  • 6. 6 BW reporting is based on multidimensional data sources which makes it possible to analyze data based on multiple dimensions. BW reporting facilitates trend analysis of historic and current data at different level of details and perspectives. BW reports can be accessed via Web and in MS Excel. BW reports can be used by a large spectrum of users at different locations as per their roles. Enterprise Reporting, Query and Analysis
  • 7. 7 To effectively design queries and reports meeting client’s business requirements. Design optimized reports which executes in a acceptable time frame. Creation of a global report satisfying needs of users performing same role across the globe. BW Reporting - Challenges
  • 9. 9 Business Explorer (BEx) is the SAP BW component that provides flexible reporting and analysis tools. It enables end users to locate reports, view reports, and analyze information. Reports can be displayed using MS Excel and can also be published on web using BEx tools. It consists of the four tools for analysis and reporting activities.  BEx Query Designer – To create queries  BEx Analyser – To modify queries  BEx Browser – To organize queries  BEx Web Application Designer – To display queries on Web and create web applications Introduction to BEx Reporting
  • 11. 11 It is used to design queries on InfoProviders according to the clients requirements. The Open Dialogue Box BEx Query Designer
  • 12. 12 The Query Designer is divided into 11 sub areas.  Directory tree of the selected InfoProvider  Characteristics Restrictions / Filters  Default Values  Properties  Messages  Free Characteristics  Columns  Rows  Preview  Task  Where used BEx Query Designer
  • 13. 13 BEx Query Designer Filter Toolbar Directory tree for selected InfoProvider Default Values Properties Messages
  • 15. 15 BEx Query Designer Directory tree of the selected InfoProvider  This section contains key figures and characteristics (grouped in dimensions) of the InfoProvider on which query is being created. Filters  Filter selection has a restricting effect on the entire query. Default Values  In this pane you define the characteristic filter values which should be used for the initial view of the result set. The user may choose to modify these filters in the result. Properties  The settings relevant to the currently highlighted query object are displayed. You can also make changes to the setting here.
  • 16. 16 BEx Query Designer Messages  This pane is where informational or error messages are displayed. Free Characteristics  Free characteristics can be used to drill down or drill across the report as required. They don't appear when the report is originally executed, but the user has the ability to use the free characteristics to slice and dice the data further. Columns  Usually Key indicators to be analyzed will be taken in columns. Rows  The characteristics on which the key indicators to be measured will be taken in rows.
  • 17. 17 BEx Query Designer Preview  This area gives a preview of the query results area. Tasks  A list of suitable tasks relating to highlighted query object are displayed here, you click on any of the tasks in the list to go directly to the settings. Where Used  Provides information relating to the use of the query object
  • 20. 20 InfoProviders in BEx Query Designer InfoProvider is the generic term used to describe any objects or views relevant to reporting. These include objects that physically store data - the data targets, such as InfoCubes, DataStore Objects, and InfoObjects (characteristics with attributes or texts). They also include objects that do not contain any physical data, such as InfoSets, VirtualProviders Note: Characteristic InfoObjects have to be included in the InfoProvider tree in the Data Warehousing Workbench to make them available as data targets for flexible updates and as InfoProviders for reporting and MultiProviders.
  • 21. 21 Elements of BEx Queries BEx query designer provides several components which can be used for designing queries.  Structures  Restricted Key figure  Calculated Key figure  New Selection  New Formula  Variables
  • 22. 22 Elements of BEx Queries Some of the query elements can be reused in queries which are based on the same InfoProviders. The reusable query elements are: Variables Restricted key figures Calculated key figures Structures can be defined for reuse.
  • 23. 23 Structures A structure forms the basic framework of the axes rows or columns in a query. It consists of structural components like characteristics, keyfigures, formulas and selections. Set up of the structure determines the sequence and number of key figures or characteristic values in the columns and rows of the query.
  • 24. 24 Structures Within a query definition you can use either no structures or a maximum of two structures. Of these, only one can be a key figure structure. You can combine structures freely with other characteristics on the axes. Structure can be defined as local or reusable.
  • 25. 25 Restricted Key figures Key figures of an InfoProvider can be restricted for reuse by selecting one or more characteristics, these are called as restricted key figures. The key figures that are restricted by one or more characteristic selections can be basic key figures, calculated key figures, or key figures that are already restricted. By using restricted key figure query result can be focused on certain value or range of values of the characteristic. Restricted Key figures can be used as reusable objects for all queries in an Info Provider.
  • 26. 26 Restricted Key figures When selecting value ranges for the characteristics, the following options are available: Between Greater than or equal to Less than or equal to Greater than Less than You can include values in the selection or exclude values from the selection by selecting these options in the context menu of the relevant filter.
  • 27. 27 Calculated Key figures Calculated Key figures are used for performing complicated calculations on key figures for information analysis. Calculated key figures consist of formula definitions containing basic key figures, restricted key figures or calculated key figures. Calculated Key figures can be used as reusable objects for all queries in an InfoProvider.
  • 28. 28 Calculated Key figures The functions available for creation of Calculated Key figures are: Data Functions Percentage Functions Mathematical Functions Trigonometric Functions Boolean Functions
  • 29. 29 Calculated Key figures Important Percentage Functions:  Percentage Variance (%): <operand1> % <operand2> - Gives the percentage variance of operand1 from operand2.  Percentage Share (%A): <operand1> %A <operand2> - Gives the percentage share of operand1 from operand2.  Percentage Share of Result (%CT): %CT <operand> - Specifies how high the percentage share is in relation to result.  Percentage Share of Overall Result (%GT): %GT <operand> - Specifies how high the percentage share is in relation to overall result.
  • 30. 30 Calculated Key figures Important Data Functions  COUNT(<Expression>): Delivers value 1 if the <Expression> is <>0, Otherwise 0.  NDIV0(x): Is equal to 0 with division by 0, otherwise x.  NODIM(<Expression>): Delivers purely numerical values of <Expression>, suppresses units and currencies.  SUMCT<operand>: Delivers the result of operand in all rows or columns.  SUMGT<operand>: Delivers the overall result of operand.  SUMRT<operand>: Delivers the report result of operand.
  • 31. 31 Calculated Key figures Important Mathematical and Trigonometric Functions  Maximum  Minimum  Absolute Value  Sine  Cosine Boolean Operations  Is less than (<)  Is greater than (>)  Is not equal to (<>)  Is less than or equal to (<=)  Is greater than or equal to (>=)  Logical NOT,AND,OR,XOR
  • 32. 32 Key figure Properties Display Section  Use Highlighting to highlight a key figure  Hide options can be used to hide a key figure Number Format  Scaling factor can be used incase of high value of a key figure  Number of decimal places Calculations  For Result  For Single Value Currency Translation
  • 33. 33 Characteristics Properties Display As : Options available are Key, Text, Key and Text, Text and Key and No Display. Display of Results : Options for supressing results and normalization. Display Hierarchy : Options for hierarchy display Sort Order : Options for sorting characteristics.
  • 34. 34 New Selection New Selection can be used for characteristics, key figures or for creating local restricted key figures. They can be created on structures.
  • 35. 35 New Formula Formula allow arithmetic operations to be defined using one or more basic key figures or formula variables or calculated key figures. New Formula can be defined only on structure elements
  • 37. 37 Integrating Hierarchies into Reports Hierarchical Positioning of Characteristics and Key Figures
  • 38. 38 Integrating Hierarchies into Reports Including External Hierarchies in Reports
  • 39. 39 Variables Variables are parameters of a query that are filled with values only when you execute the query or Web application. They serve as place holders for characteristic values, hierarchies, hierarchy nodes, texts and formula elements, and can be processed in different ways. The processing type determines how a variable is filled with a value for the runtime of the query or Web application Variables are reusable objects, if we create a variable for a Characteristic InfoObject we can use that variable in all the InfoProviders that use this characteristic.
  • 40. 40 There are different types of variables depending on the object for which the variable is defined as placeholder. Types of variables are: - Characteristic value variables • Characteristics value variables are used to select values of characteristics in the query at runtime. • Variables can be used to select single values and value ranges. - Hierarchy variables • Hierarchy variables represent hierarchies and can be used wherever hierarchies can be selected. Variable Types
  • 41. 41 - Hierarchy Node Variables • Hierarchy node variables represent a node in a hierarchy and can be used wherever hierarchy nodes are used. - Text variables • Text variables represent a text and can be used in descriptions of queries, calculated key figures and structural components. - Formula variables • Formula variables represent numerical values and can be used in formulas. • Numerical values are used for selecting exceptions and conditions and one can also use formula variables here. Variable Types .. Contd..
  • 42. 42 The processing type of a variable determines how a variable is filled with a value at runtime. The following processing types are available: - Manual Entry/Default Value - Replacement Path - Customer Exit - SAP Exit - Authorizations Variable Processing Types
  • 43. 43 Conditions Conditions can be formulated in the query designer to make data analysis more efficient. On defining condition, the data in the query is filtered accordingly so that only the part of the results area that you are interested in is displayed. With the help of conditions, we can analyze combinations of characteristics using ranked lists. Example: Displaying ten best customers by sales revenue. We can define multiple conditions for a query, and then activate or deactivate them in the report itself to create different views of the data.
  • 44. 44 Conditions Example: The sales department wants the flexibility to restrict a report so that only ‘Top 10’ materials as per Gross Sales are displayed.
  • 45. 45 Exceptions Exception function in reporting enables you to select and highlight unusual deviations of key figure values in a query. The exception reporting function allows users to detect variances early on, thus giving a chance to react effectively and immediately. The results that vary from defined threshold values and interval are marked in different colors in the worksheet so you can identify them instantly.
  • 46. 46 Exceptions Gross sales below 1000$ is Bad, between 1000$ and 5000$ is Medium and sales 5000$ above is Good.
  • 47. 47 Cell Editor Cell Editor is used when complex calculations are needed to be performed, and it cannot be accomplished by restricted and calculated key figures. It gets enabled only if the query definition contains two structures. Cell-specific definitions allow you to define explicit formulas, along with implicit cell definition, and selection conditions for cells and in this way, to override implicitly created cell values. Help on cells can be defined via Cell Editor.
  • 48. 48 Cell Editor Cell is the intersection between two structural components. The formulas or selection conditions that you define for a cell always take effect at the intersection between two structural components. For each cell you can define a custom selection, a custom formula, or a custom cell definition.