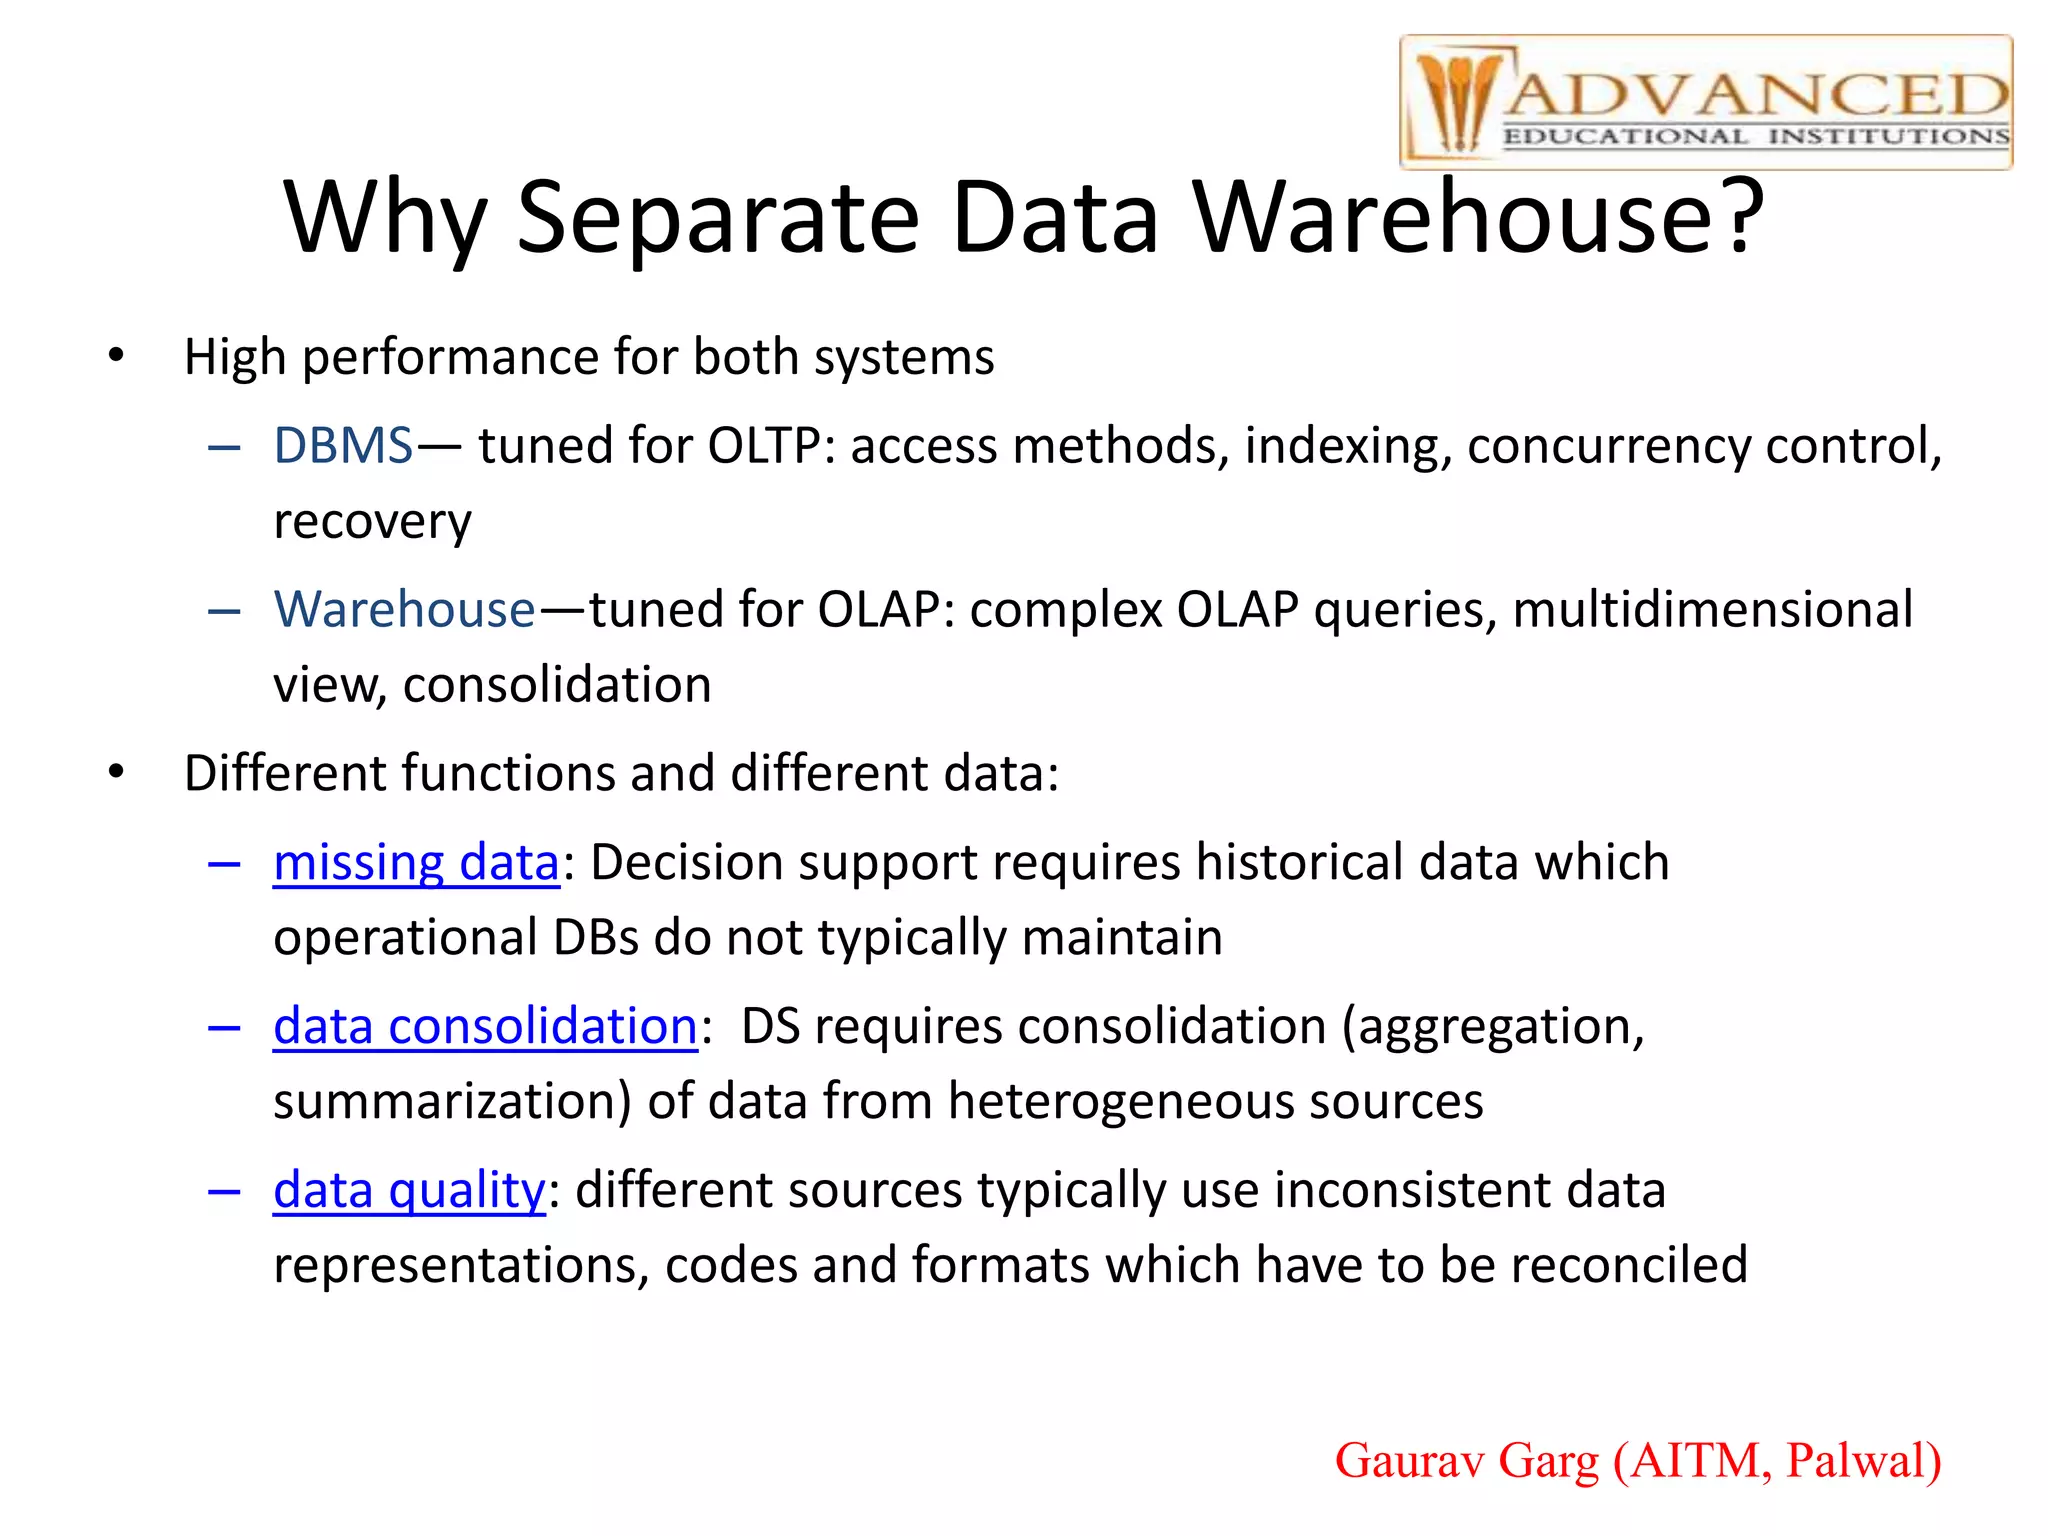
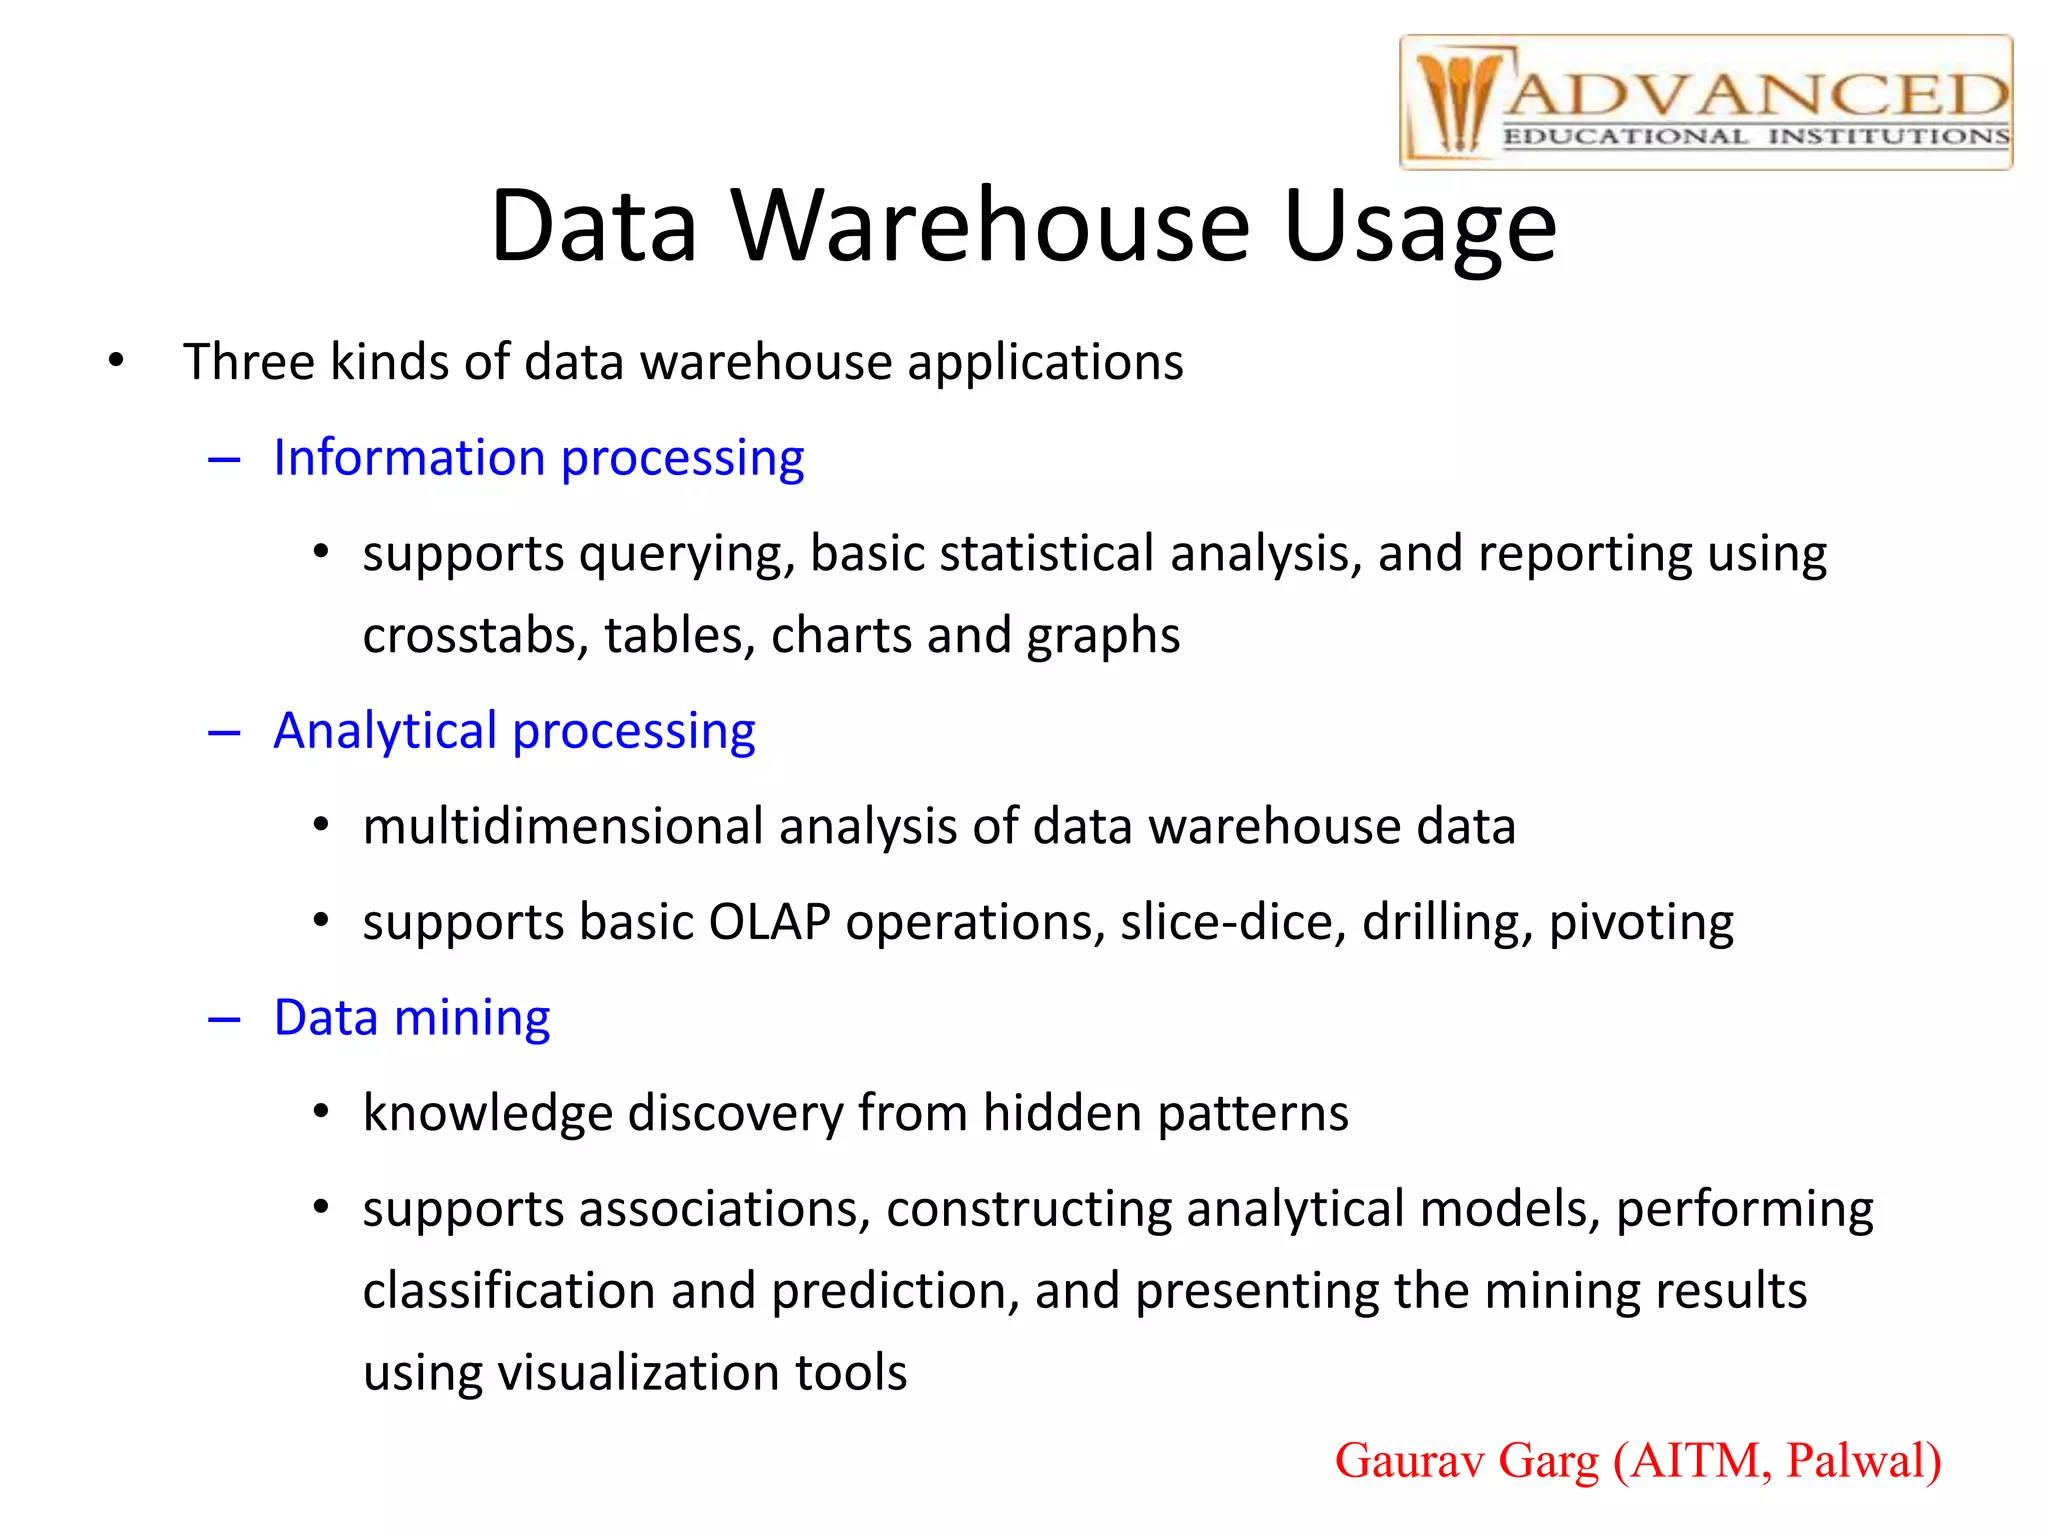
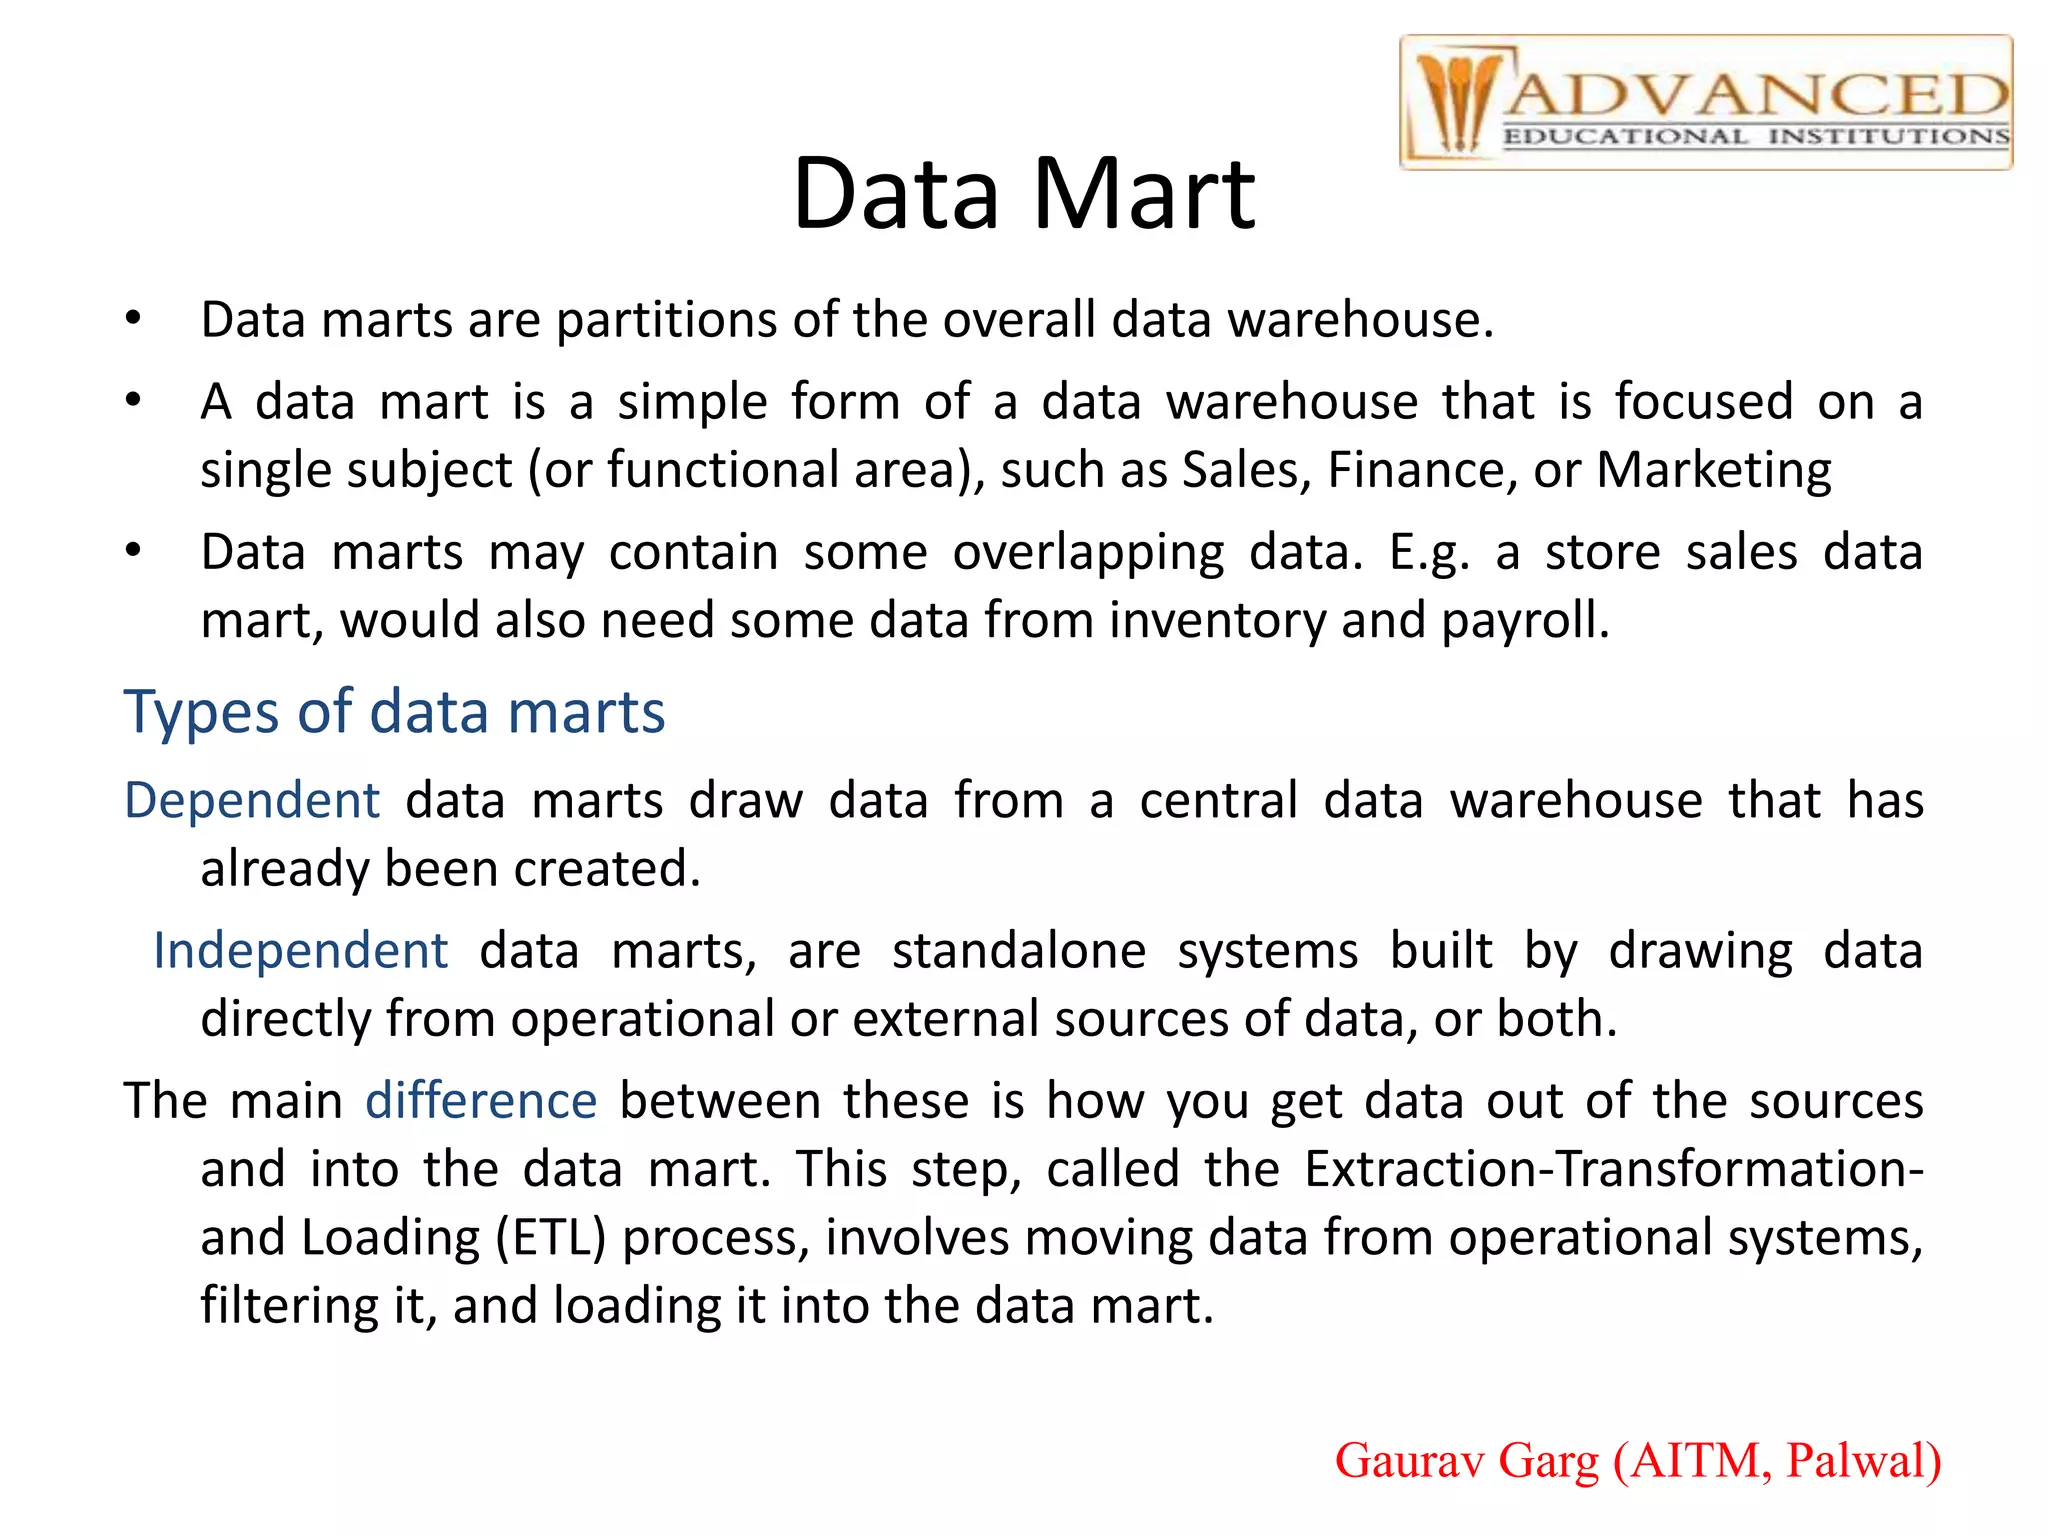
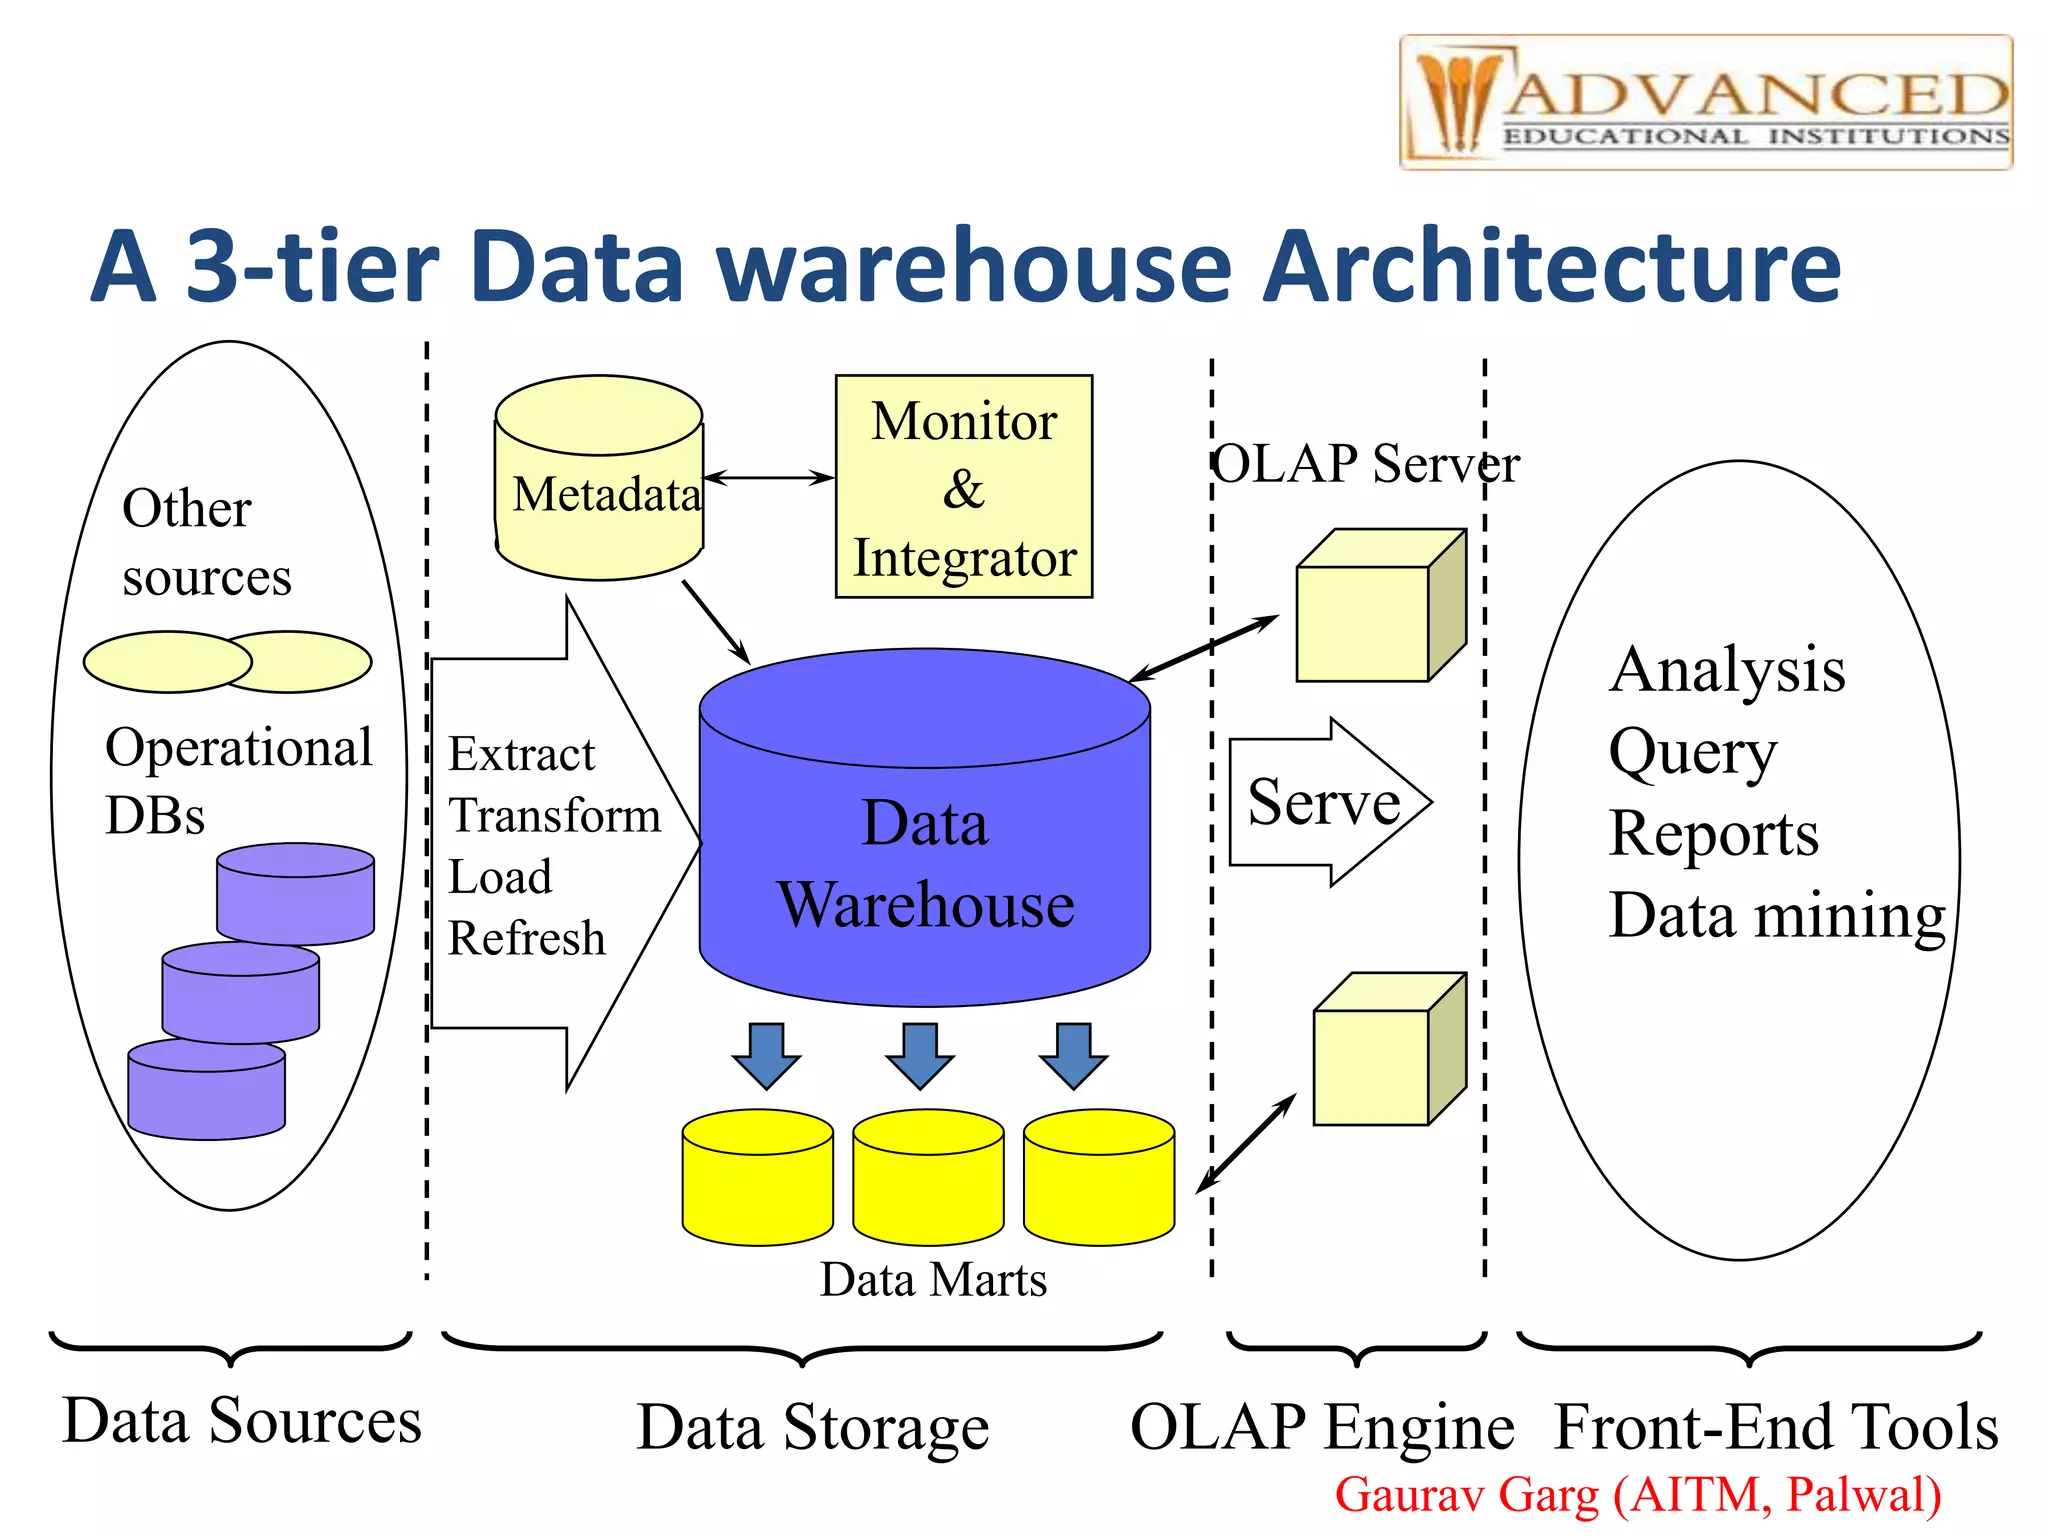
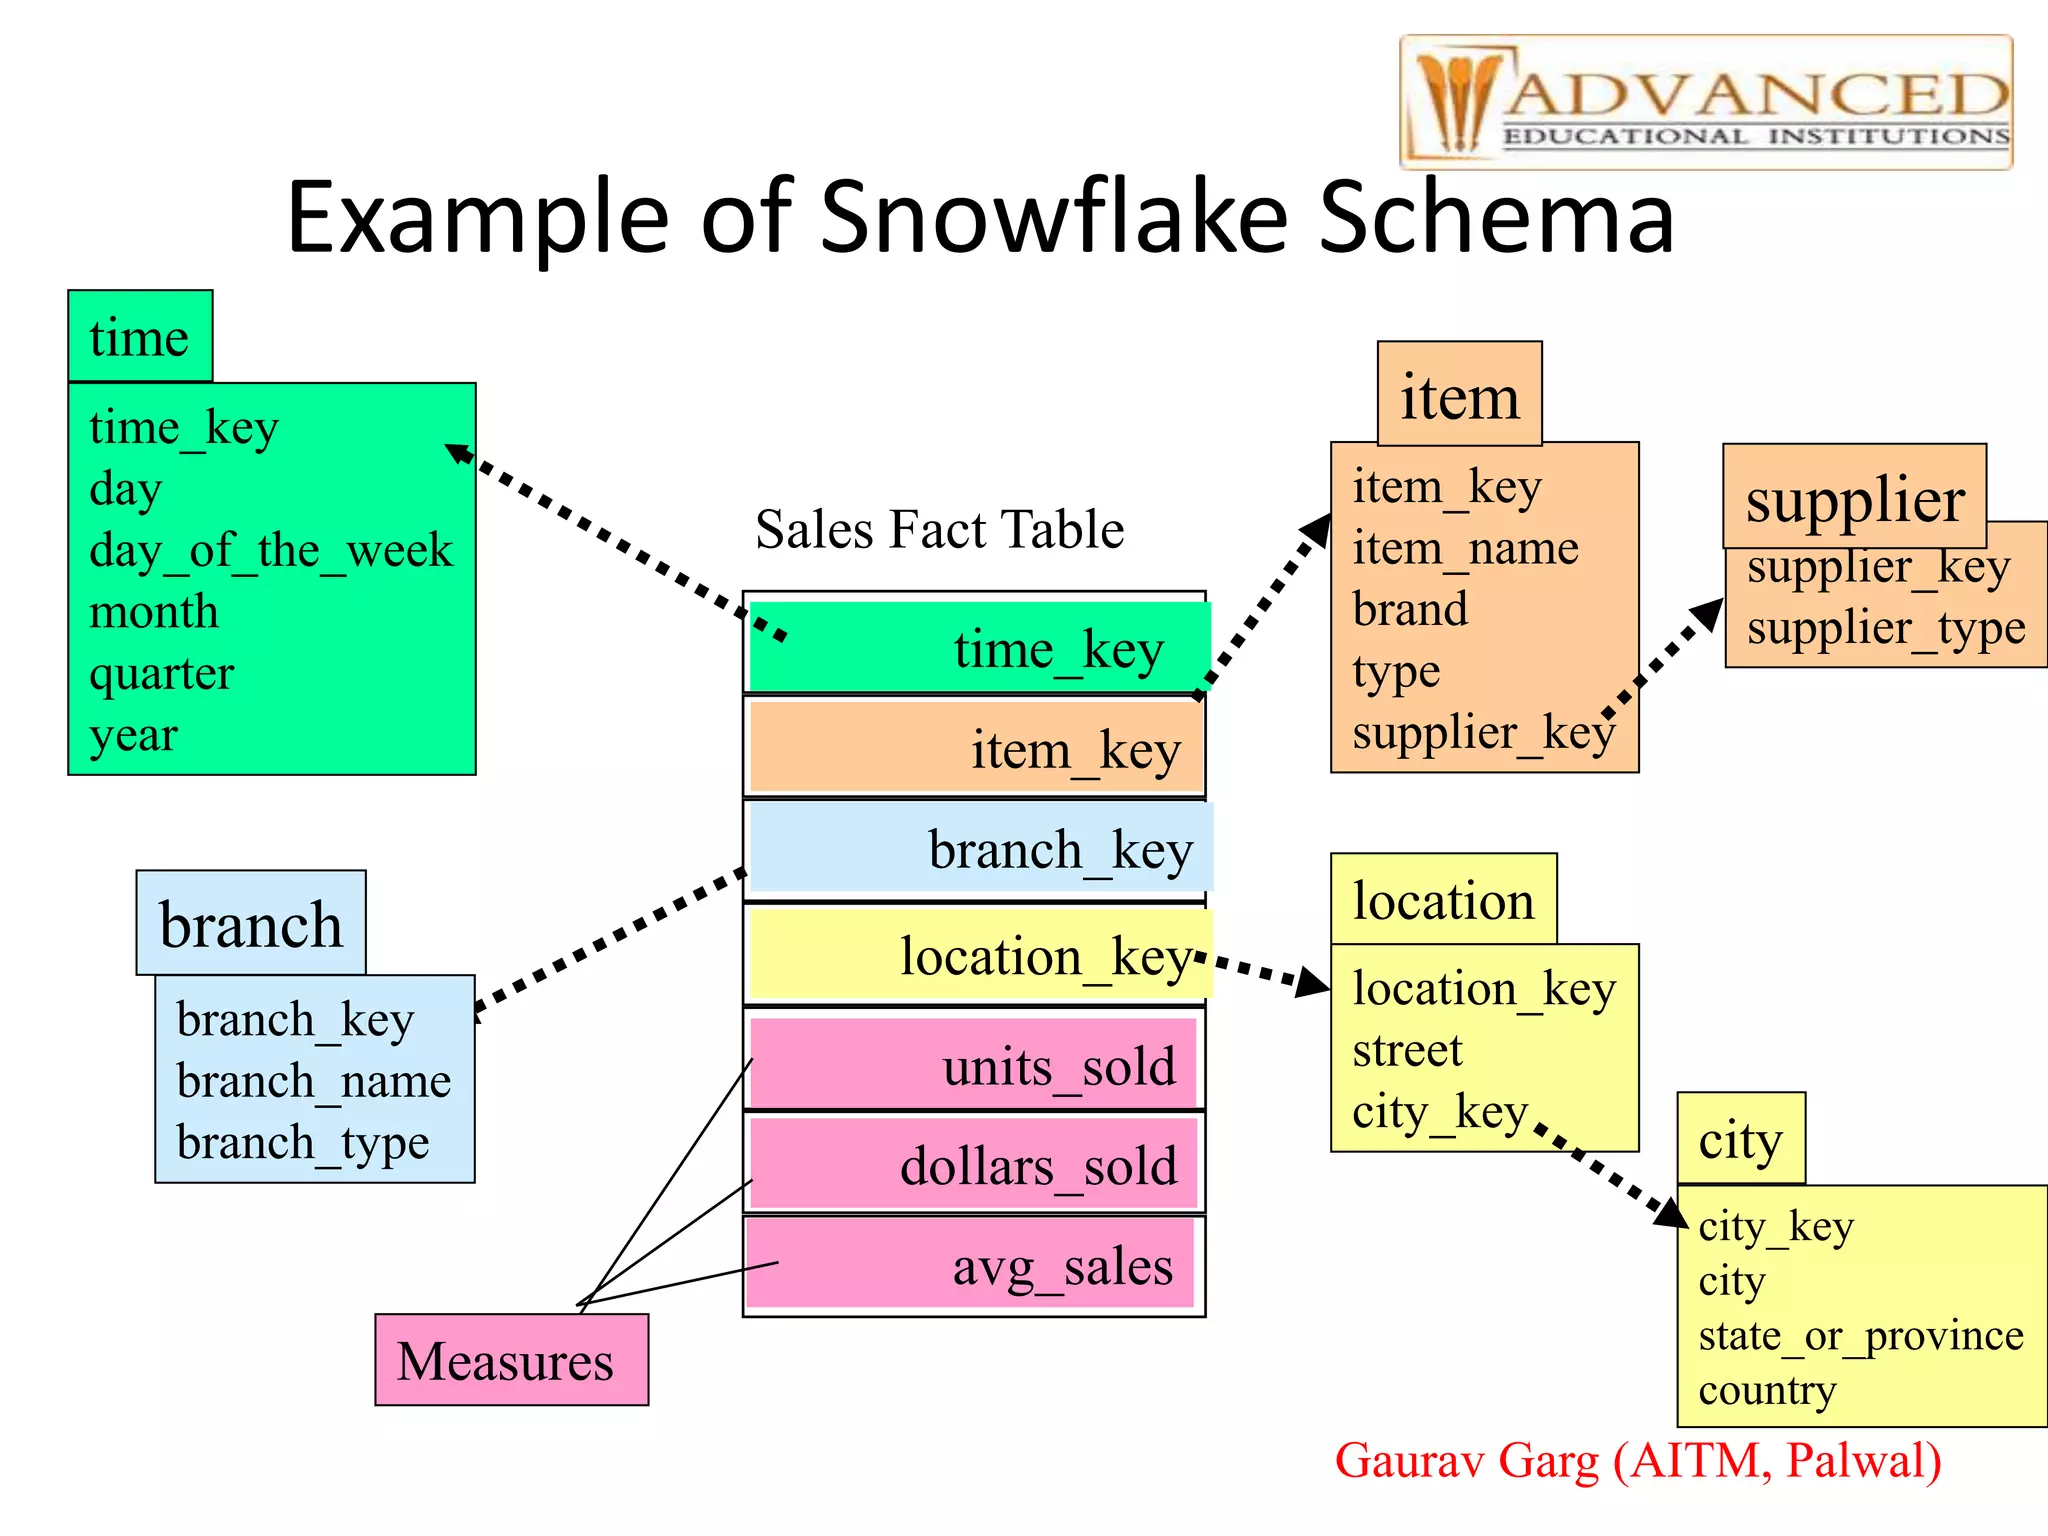
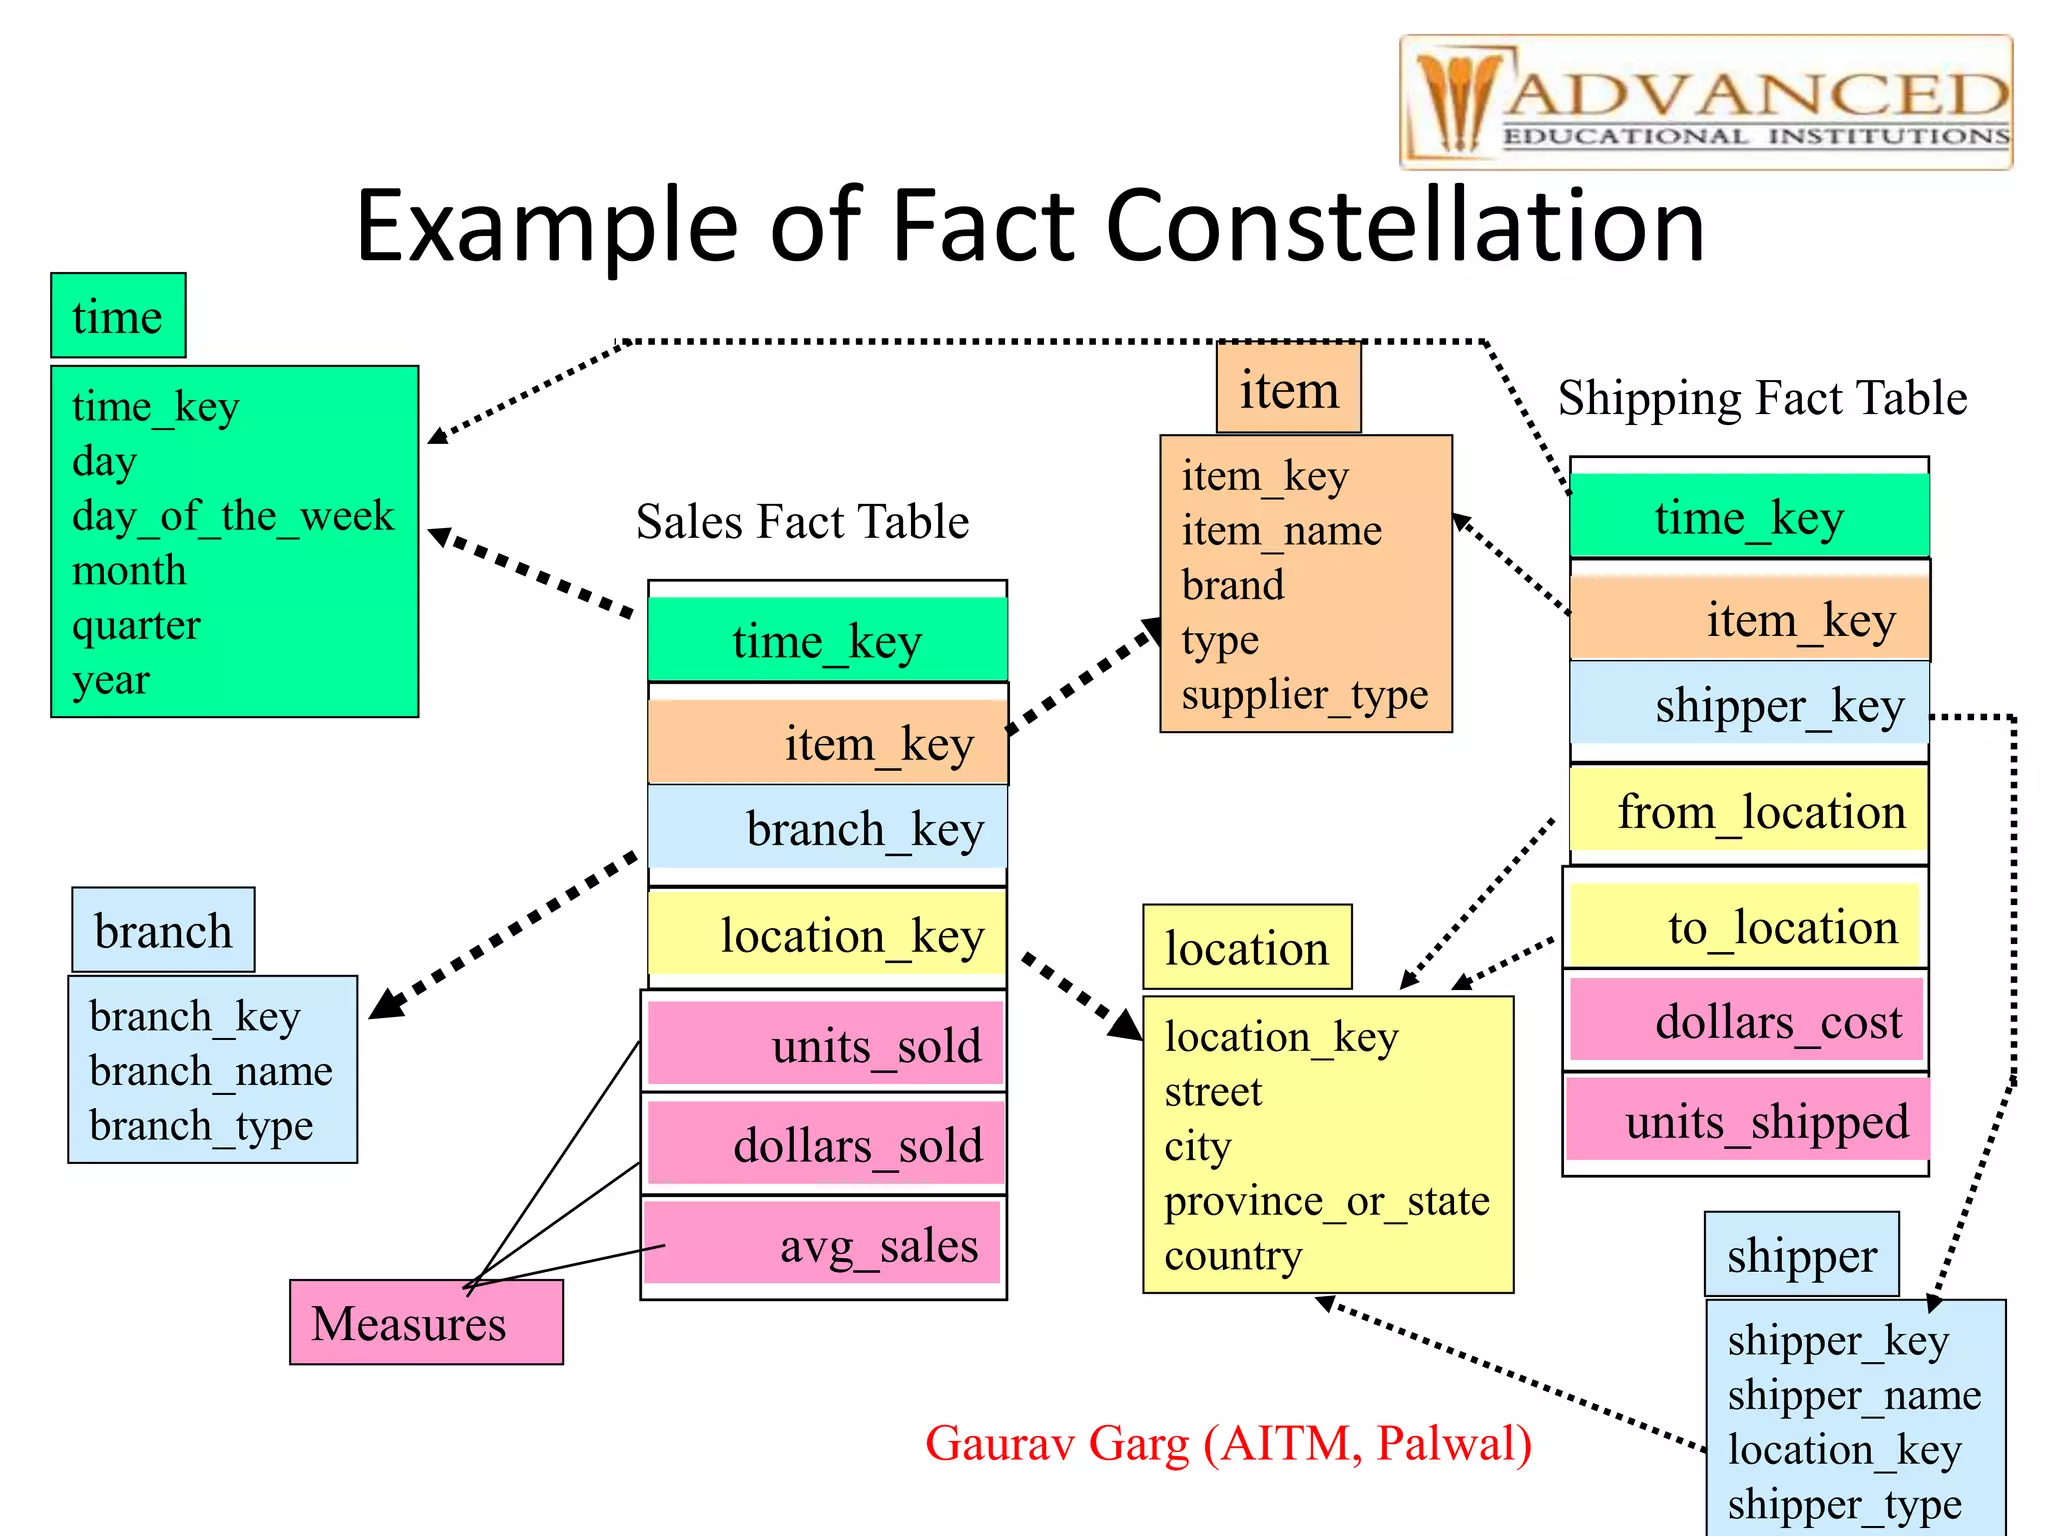
These slides will help in understanding what is Data warehouse? why we need it? DWh architecture, OLAP, Metadata, Data Mart, Schemas for multidimensional data, partitioning of data warehouse
2. Table of Contents
• Data warehouse
• Data Warehouse vs. Operational DBMS
• OLTP vs. OLAP
• Why Need Separate Data Warehouse?
• Data Mart
• Data warehouse Architecture
• Data warehouse backend process
• Metadata Repository
• OLAP Server Architecture
• Schemas for multidimensional data
• Partitioning the Data warehouse
3. What is Data Warehouse?
• Defined in many different ways, but not rigorously.
– A decision support database that is maintained separately from the
organization’s operational database
– Support information processing by providing a solid platform of
consolidated, historical data for analysis.
• “A data warehouse is a subject-oriented, integrated, time-variant, and
nonvolatile collection of data in support of management’s decision-making
process.”—W. H. Inmno
• Data warehousing:
– The process of constructing and using data warehouses
Gaurav Garg (AITM, Palwal)
4. Data Warehouse—Subject-Oriented
• Organized around major subjects, such as customer, product, sales
• Focusing on the modeling and analysis of data for decision makers, not on
daily operations or transaction processing
• Provide a simple and concise view around particular subject issues by
excluding data that are not useful in the decision support process
Gaurav Garg (AITM, Palwal)
5. Data Warehouse—Integrated
• Constructed by integrating multiple, heterogeneous data
sources
– relational databases, flat files, on-line transaction records
• Data cleaning and data integration techniques are applied.
– Ensure consistency in naming conventions, encoding structures,
attribute measures, etc. among different data sources
• E.g., Hotel price: currency, tax, breakfast covered, etc.
– When data is moved to the warehouse, it is converted.
Gaurav Garg (AITM, Palwal)
6. Data Warehouse—Time Variant
• The time horizon for the data warehouse is significantly longer
than that of operational systems
– Operational database: current value data
– Data warehouse data: provide information from a historical perspective
(e.g., past 5-10 years)
• Every key structure in the data warehouse
– Contains an element of time, explicitly or implicitly
– But the key of operational data may or may not contain “time element”
Gaurav Garg (AITM, Palwal)
7. Data Warehouse vs. Operational DBMS
• OLTP (on-line transaction processing)
– Major task of traditional relational DBMS
– Day-to-day operations: purchasing, inventory, banking, manufacturing,
payroll, registration, accounting, etc.
• OLAP (on-line analytical processing)
– Major task of data warehouse system
– Data analysis and decision making
• Distinct features (OLTP vs. OLAP):
– User and system orientation: customer vs. market
– Data contents: current, detailed vs. historical, consolidated
– Database design: ER + application vs. star + subject
– View: current, local vs. evolutionary, integrated
– Access patterns: update vs. read-only but complex queries
Gaurav Garg (AITM, Palwal)
8. OLTP vs. OLAP
OLTP OLAP
users clerk, IT professional knowledge worker
function day to day operations decision support
DB design application-oriented subject-oriented
data current, up-to-date
detailed, flat relational
isolated
historical,
summarized, multidimensional
integrated, consolidated
usage repetitive ad-hoc
access read/write
index/hash on prim. key
lots of scans
unit of work short, simple transaction complex query
# records accessed tens millions
#users thousands hundreds
DB size 100MB-GB 100GB-TB
metric transaction throughput query throughput, response
Gaurav Garg (AITM, Palwal)
9. Why Separate Data Warehouse?
• High performance for both systems
– DBMS— tuned for OLTP: access methods, indexing, concurrency control,
recovery
– Warehouse—tuned for OLAP: complex OLAP queries, multidimensional
view, consolidation
• Different functions and different data:
– missing data: Decision support requires historical data which
operational DBs do not typically maintain
– data consolidation: DS requires consolidation (aggregation,
summarization) of data from heterogeneous sources
– data quality: different sources typically use inconsistent data
representations, codes and formats which have to be reconciled
Gaurav Garg (AITM, Palwal)
10. Data Warehouse Usage
• Three kinds of data warehouse applications
– Information processing
• supports querying, basic statistical analysis, and reporting using
crosstabs, tables, charts and graphs
– Analytical processing
• multidimensional analysis of data warehouse data
• supports basic OLAP operations, slice-dice, drilling, pivoting
– Data mining
• knowledge discovery from hidden patterns
• supports associations, constructing analytical models, performing
classification and prediction, and presenting the mining results
using visualization tools
Gaurav Garg (AITM, Palwal)
11. Data Mart
• Data marts are partitions of the overall data warehouse.
• A data mart is a simple form of a data warehouse that is focused on a
single subject (or functional area), such as Sales, Finance, or Marketing
• Data marts may contain some overlapping data. E.g. a store sales data
mart, would also need some data from inventory and payroll.
Types of data marts
Dependent data marts draw data from a central data warehouse that has
already been created.
Independent data marts, are standalone systems built by drawing data
directly from operational or external sources of data, or both.
The main difference between these is how you get data out of the sources
and into the data mart. This step, called the Extraction-Transformation-
and Loading (ETL) process, involves moving data from operational systems,
filtering it, and loading it into the data mart.
Gaurav Garg (AITM, Palwal)
12. A 3-tier Data warehouse Architecture
Data
Warehouse
Extract
Transform
Load
Refresh
OLAP Engine
Analysis
Query
Reports
Data mining
Monitor
&
Integrator
Metadata
Data Sources Front-End Tools
Serve
Data Marts
Operational
DBs
Other
sources
Data Storage
OLAP Server
Gaurav Garg (AITM, Palwal)
13. Data warehouse backend process
Data extraction
It’s a process of extracting data for the warehouse from various sources.
Data cleaning
Its an essential operation for construction of quality data warehouse. Because
a large volume of data from heterogeneous sources are involved,so there
is high probability of errors in the data. The data cleaning process include
• Using transformation rules e.g. translating attribute name like ‘age’ to
‘DOB’
• Using domain specific knowledge
• Performing parsing and fuzzy matching e.g for multiple data sources, one
can designate a preferred source as a matching standard
• Auditing
it is difficult and costly to clean the data.
Gaurav Garg (AITM, Palwal)
14. Data Transformation
It’s a process of transforming heterogeneous data to an uniform structure so
that data can be combined and integrated .i.e convert data from legacy or
host format to warehouse format.
Data Loading
For loading correct, refined, processed data( huge in size) into data
warehouse, there are some data loading strategies.
Batch loading.
Sequential loading.
Incremental loading.
Refresh
The process of updating the data.
Gaurav Garg (AITM, Palwal)
15. Metadata Repository
• Meta data is the data defining warehouse objects. It stores:
• Description of the structure of the data warehouse
– schema, view, dimensions, hierarchies, derived data defn, data mart
locations and contents
• Operational meta-data
– data lineage (history of migrated data and transformation path), currency
of data (active, archived, or purged), monitoring information (warehouse
usage statistics, error reports, audit trails)
• The algorithms used for summarization
• The mapping from operational environment to the data warehouse
• Data related to system performance
– warehouse schema, view and derived data definitions
• Business data
– business terms and definitions, ownership of data, charging policies
Gaurav Garg (AITM, Palwal)
16. OLAP Server Architecture
• Relational OLAP (ROLAP)
– Use relational or extended-relational DBMS to store and manage
warehouse data and OLAP middle ware
– Include optimization of DBMS backend, implementation of aggregation
navigation logic, and additional tools and services
– Greater scalability
• Multidimensional OLAP (MOLAP)
– Sparse array-based multidimensional storage engine
– Fast indexing to pre-computed summarized data
• Hybrid OLAP (HOLAP) (e.g., Microsoft SQLServer)
– Flexibility, e.g., low level: relational, high-level: array
• Specialized SQL servers (e.g., Redbricks)
– Specialized support for SQL queries over star/snowflake schemas
Gaurav Garg (AITM, Palwal)
17. Multidimensional Data
• Sales volume as a function of product, month,
and region
Product
Month
Dimensions: Product, Location, Time
Hierarchical summarization paths
Industry Region Year
Category Country Quarter
Product City Month Week
Office Day
Gaurav Garg (AITM, Palwal)
18. Multidimensional Data Model
“what is a data cube?”
“what do you mean by dimensions?”
Data cube allows data to be modeled and viewed in multiple dimensions. It is
defined by dimensions and facts.
Dimensions are the perspectives or entities with respect to which an
organizations wants to keep records.
Each dimension may have a table associated with it, called a dimension table.
A dimension table for the item may contain the attributes item_name,
brand etc.
A multidimensional data model is typically organized around a central theme,
like sales. These theme is represented by fact table.
Facts are numerical measure. Examples of facts for a sales data warehouse
include dollars_sold,unit_sold,amount_budgeted.
Facts table contains the names of the facts, or measures, as well as keys to
each related dimension tables.
Gaurav Garg (AITM, Palwal)
19. Schemas for multidimensional data
These multidimensional model can exist in the form of a star schema, a
snowflake schema, or a fact constellation schema (galaxy schema).
Star Shcema
It is the most common schema type in which the data warehouse contains
a large central table (fact table) which contains the bulk of data, with no
redundancy, and a set of smaller attendant tables (dimension tables), one
for each dimension. The dimension tables displayed a radial pattern
around the central fact table.
Snowflake schema
It is a variant of the star schema model, where some dimension tables are
normalized, thereby further splitting the data into additional tables. The
resulting schema graph forms a shape similar to a snowflake.
Gaurav Garg (AITM, Palwal)
20. Example of Star Schema
time_key
day
day_of_the_week
month
quarter
year
time
location_key
street
city
state_or_province
country
location
Sales Fact Table
time_key
item_key
branch_key
location_key
units_sold
dollars_sold
avg_sales
Measures
item_key
item_name
brand
type
supplier_type
item
branch_key
branch_name
branch_type
branch
Gaurav Garg (AITM, Palwal)
21. Example of Snowflake Schema
time_key
day
day_of_the_week
month
quarter
year
time
location_key
street
city_key
location
Sales Fact Table
time_key
item_key
branch_key
location_key
units_sold
dollars_sold
avg_sales
Measures
item_key
item_name
brand
type
supplier_key
item
branch_key
branch_name
branch_type
branch
supplier_key
supplier_type
supplier
city_key
city
state_or_province
country
city
Gaurav Garg (AITM, Palwal)
22. Fact constellation (galaxy schema)
Some sophisticated applications may require multiple fact tables to share
dimension tables. This kind of schema can be viewed as a collection of
stars, and hence is called a galaxy schema or fact constellation.
Gaurav Garg (AITM, Palwal)
23. Example of Fact Constellation
time_key
day
day_of_the_week
month
quarter
year
time
location_key
street
city
province_or_state
country
location
Sales Fact Table
time_key
item_key
branch_key
location_key
units_sold
dollars_sold
avg_sales
Measures
item_key
item_name
brand
type
supplier_type
item
branch_key
branch_name
branch_type
branch
Shipping Fact Table
time_key
item_key
shipper_key
from_location
to_location
dollars_cost
units_shipped
shipper_key
shipper_name
location_key
shipper_type
shipper
Gaurav Garg (AITM, Palwal)
24. Partitioning the Data warehouse
Data warehouses often contain large tables and require techniques both
for managing these large tables and for providing good query performance
across these large tables.
Partitioning have many advantages, some are as
Scalability
Partitioning helps scaling a data warehouse by dividing database objects
into smaller pieces, enabling access to smaller, more manageable objects.
Having direct access to smaller objects .
Performance
Good performance is a key to success for a data warehouse. Analyses run
against the database should return within a reasonable amount of time,
even if the queries access large amounts of data in tables that are
terabytes in size. Partitioning increases the performance of data
warehouse.
Note: partitions of database are generally known as clusters.
Gaurav Garg (AITM, Palwal)
25. Types of partitioning
• Basically it has two types
1. Horizontal partitioning
2. Vertical partitioning
There are two main categories of partitioning algorithms
1. k-means algorithm, where each cluster is represented by the center of
gravity of the cluster.
2. K-medoid algorithm, where each cluster is represented by one of the
objects of the cluster located near the center.
Gaurav Garg (AITM, Palwal)
26. Some general methods of partitioning
Range Partitioning
Range partitioning maps data to partitions based on ranges of partition
key values that you establish for each partition. It is the most common
type of partitioning and is often used with dates. For example, you might
want to partition sales data into monthly partitions.
Hash Partitioning
Hash partitioning maps data to partitions based on a hashing algorithm
The hashing algorithm evenly distributes rows among partitions, giving
partitions approximately the same size.
List Partitioning
List partitioning enables you to explicitly control how rows map to
partitions. This is different from range partitioning, where a range of
values is associated with a partition and with hash partitioning, where you
have no control of the row-to-partition mapping. The advantage of list
partitioning is that you can group and organize unordered and unrelated
sets of data in a natural way.
Gaurav Garg (AITM, Palwal)