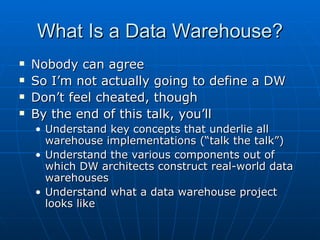
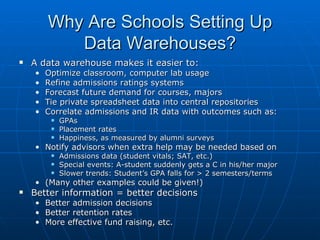
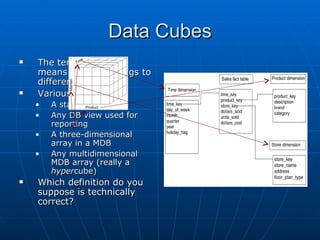
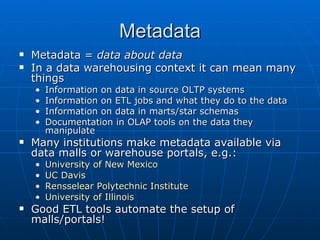
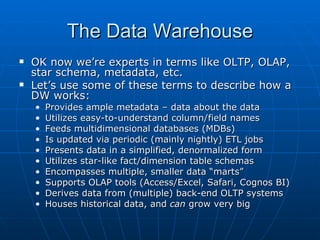
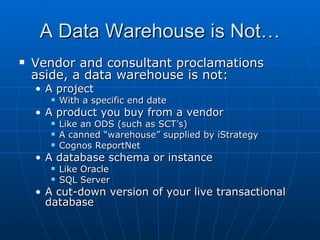
Richard discusses what a data warehouse is and why schools are setting them up. He explains that a data warehouse makes it easier for schools to optimize classroom usage, refine admissions systems, forecast demand, and more by bringing together data from different sources. It provides better information to make better admissions, retention, and fundraising decisions. He then discusses key data warehouse concepts like OLTP, OLAP, ETL, star schemas, and metadata to help the audience understand warehouse implementations.
The document discusses what a data warehouse is and why schools are setting them up. It provides key concepts like OLTP, OLAP, ETL, star schemas, and data marts. A data warehouse extracts data from transactional systems, transforms and loads it into a dimensional data store to support analysis. It is updated via periodic ETL jobs and presents data in simplified, denormalized schemas to support decision making. Implementing a data warehouse requires defining requirements and priorities through collaboration between decision makers and technologists.
The document provides an overview of data warehousing concepts. It defines a data warehouse as a subject-oriented, integrated, time-variant, and non-volatile collection of data. It discusses the differences between OLTP and OLAP systems. It also covers data warehouse architectures, components, and processes. Additionally, it explains key concepts like facts and dimensions, star schemas, normalization forms, and metadata.
This document provides an overview and agenda for a Teradata training session. It discusses key concepts about Teradata including its architecture, components, storage and retrieval processes, high availability features, object types, and manageability advantages compared to other databases. The training covers topics such as creating tables, indexes, views, joins, macros and using commands like help, show and explain.
- Data warehousing aims to help knowledge workers make better decisions by integrating data from multiple sources and providing historical and aggregated data views. It separates analytical processing from operational processing for improved performance.
- A data warehouse contains subject-oriented, integrated, time-variant, and non-volatile data to support analysis. It is maintained separately from operational databases. Common schemas include star schemas and snowflake schemas.
- Online analytical processing (OLAP) supports ad-hoc querying of data warehouses for analysis. It uses multidimensional views of aggregated measures and dimensions. Relational and multidimensional OLAP are common architectures. Measures are metrics like sales, and dimensions provide context like products and time periods.
The document provides an overview of database, big data, and data science concepts. It discusses topics such as database management systems (DBMS), data warehousing, OLTP vs OLAP, data mining, and the data science process. Key points include:
- DBMS are used to store and manage data in an organized way for use by multiple users. Data warehousing is used to consolidate data from different sources.
- OLTP systems are for real-time transactional systems, while OLAP systems are used for analysis and reporting of historical data.
- Data mining involves applying algorithms to large datasets to discover patterns and relationships. The data science process involves business understanding, data preparation, modeling, evaluation, and deployment
Data Warehouse Testing: It’s All about the PlanningTechWell
Today’s data warehouses are complex and contain heterogeneous data from many different sources. Testing these warehouses is complex, requiring exceptional human and technical resources. So how do you achieve the desired testing success? Geoff Horne believes that it is through test planning that includes technical artifacts such as data models, business rules, data mapping documents, and data warehouse loading design logic. Wayne shares planning checklists, a test plan outline, concepts for data profiling, and methods for data verification. He demonstrates how to effectively create a test strategy to discover empty fields, missing records, truncated data, duplicate records, and incorrectly applied business rules—all of which can dramatically impact the usefulness of the data warehouse. Learn common pitfalls, which can cost your business hundreds of thousands of dollars or more, when test planning shortcuts are taken. If you work in an environment that often performs data warehouse testing without proper planning and technical skills, this session is for you.
SKILLWISE-SSIS DESIGN PATTERN FOR DATA WAREHOUSINGSkillwise Group
This document provides an overview of the SSIS design pattern for data warehousing and change data capture. It discusses what design patterns are and how they are commonly used for SSIS and data warehousing projects. It then covers 13 specific patterns including truncate and load, slowly changing dimensions, hashbytes, change data capture, merge, and master/child workflows. The document explains when each pattern is best used and provides pros and cons. It also provides guidance on configuring and using SQL Server change data capture functionality.
A data warehouse uses a multi-dimensional data model to consolidate data from multiple sources and support analysis. It uses a star schema with fact and dimension tables or a snowflake schema that normalizes dimensions. This allows for interactive exploration of data through OLAP operations like roll-up, drill-down, slice and dice to gain business insights. The document provides an overview of data warehousing concepts like schemas, cubes, measures and hierarchies to model and analyze historical data for decision making.
This document provides an overview of OLAP cubes and multidimensional databases. It discusses key concepts such as star schemas, dimensions and hierarchies, cube aggregation and operators like roll-up and drill-down. It also compares the relational and multidimensional models, highlighting how multidimensional databases allow for intuitive analysis and fast retrieval of large datasets by predefining dimensional perspectives.
FedX - Optimization Techniques for Federated Query Processing on Linked Dataaschwarte
The final slides of our talk about FedX at the 10th International Semantic Web Conference in Bonn. For details about FedX see http://www.fluidops.com/fedx/
This document discusses OLAP (online analytical processing) and data warehousing. It begins by comparing OLTP (online transaction processing) and OLAP, noting that OLTP is for simple, frequent queries with fast response needed, while OLAP is for complex, long-running queries on aggregated data. It then discusses how data warehouses are used to store aggregated data from multiple sources to support OLAP querying. Examples are provided of slicing and dicing data using dimensions like date, dealer, and auto make/model. The document concludes by explaining the CUBE operator, which provides aggregated results across all combinations of dimensions, and comparing it to the ROLLUP operator. Homework is assigned to use a sample data warehouse database to execute
This document outlines new capabilities in Oracle's 12c optimizer. It discusses adaptive query optimization, which allows the optimizer to adapt join methods and parallel distribution methods at runtime based on statistics collected during query execution. It also discusses enhancements to optimizer statistics, including new types of histograms, online statistics gathering, and automatic detection of column groups.
Presentation introducing materialized views in PostgreSQL with use cases. These slides were used for my talk at Indian PostgreSQL Users Group meetup at Hyderabad on 28th March, 2014
The document discusses data workflows and integrating open data from different sources. It defines a data workflow as a series of well-defined functional units where data is streamed between activities such as extraction, transformation, and delivery. The document outlines key steps in data workflows including extraction, integration, aggregation, and validation. It also discusses challenges around finding rules and ontologies, data quality, and maintaining workflows over time. Finally, it provides examples of data integration systems and relationships between global and source schemas.
This document discusses OLAP cubes, which provide a multi-dimensional representation of data. It describes cubes as containing facts and dimensions, and how dimensions can be organized hierarchically. It also outlines common operations on cubes like slicing, dicing, and drilling up and down hierarchies. Finally, it provides an overview of the process of building an OLAP cube in SQL Server Analysis Services.
This document provides an overview of data resource management and file organization concepts. It discusses key terms like binary, bit, byte, field, record, and file. It explains different file organization methods like traditional file environments and database management systems. It also summarizes different types of databases like relational, hierarchical, network, and object-oriented databases. Finally, it discusses database design, management, querying, distribution, warehousing, and trends like linking databases to the web.
This document discusses the evolution of database technology and data mining. It provides a brief history of databases from the 1960s to the 2010s and their purposes over time. It then discusses the motivation for data mining, noting the explosion in data collection and need to extract useful knowledge from large databases. The rest of the document defines data mining, outlines the basic process, discusses common techniques like classification and clustering, and provides examples of data mining applications in industries like telecommunications, finance, and retail.
The document discusses OLAP cubes and data warehousing. It defines OLAP as online analytical processing used to analyze aggregated data in data warehouses. Key concepts covered include star schemas, dimensions and facts, cube operations like roll-up and drill-down, and different OLAP architectures like MOLAP and ROLAP that use multidimensional or relational storage respectively.
OLAP performs multidimensional analysis of business data and provides the capability for complex calculations, trend analysis, and sophisticated data modeling.
Customer Relationship Management (CRM) involves managing all aspects of a customer's relationship with a company. It uses technologies like data warehousing, data mining, and online analytical processing to collect and analyze customer data to better understand customer needs and interactions. This allows companies to increase customer retention and find new customers. Major CRM software vendors include Siebel, SAP, Oracle, and Microsoft. While CRM can improve customer service and sales, it also requires significant resources to implement properly.
This document discusses data cubes, which are multidimensional data structures used in online analytical processing (OLAP) to enable fast retrieval of data organized by dimensions and measures. Data cubes can have 2-3 dimensions or more and contain measures like costs or units. Key concepts are slicing to select a 2D page, dicing to define a subcube, and rotating to change dimensional orientation. Data cubes represent categories through dimensions and levels, and store facts as measures in cells. They can be pre-computed fully, not at all, or partially to balance query speed and memory usage. Totals can also be stored to improve performance of aggregate queries.
The document provides information about new features in Cassandra 2.2 and 3.0, including materialized views. Materialized views allow data to be pre-computed and denormalized to relieve the pain of manual denormalization. Materialized views are implemented by taking a write lock on the base table partition, reading the current values, constructing a batch log of delete and insert operations for the view, executing this asynchronously on the view replica, and then applying the base table update locally. This allows views to be kept in sync with the base table in an efficient manner.
Data warehousing is an architectural model that gathers data from various sources into a single unified data model for analysis purposes. It consists of extracting data from operational systems, transforming it, and loading it into a database optimized for querying and analysis. This allows organizations to integrate data from different sources, provide historical views of data, and perform flexible analysis without impacting transaction systems. While implementation and maintenance of a data warehouse requires significant costs, the benefits include a single access point for all organizational data and optimized systems for analysis and decision making.
Relational databases have pretty much ruled over the IT world for the last 30 years. However, Web 2.0 and the incipient Internet of Things (IoT) are some of the sources of a data explosion that has proved to exceed the limits of what modern relational databases can handle in a growing number of cases. As a result, new technologies had to be developed to handle these new use cases. We generally group these technologies under the umbrella of Big Data. In this two part presentation, we will start by understanding how relational databases have evolved to become the powerhouses they are today. In part 2 we will look at how non SQL databases are tackling the big data problem to scale beyond what relational databases can provide us today.
Various Applications of Data Warehouse.pptRafiulHasan19
The document discusses various applications of data warehousing. It begins by describing problems with traditional transactional systems and how data warehouses address these issues. It then defines key components of a data warehouse including the extraction, transformation, and loading of data from various sources. The document outlines how online analytical processing (OLAP) tools, metadata repositories, and data mining techniques analyze and explore the collected data. Finally, it weighs the benefits of a data warehouse against the costs of implementation and maintenance.
The document discusses trends in data modeling for analytics. It outlines weaknesses in traditional enterprise data architectures that rely on ETL processes and large centralized data warehouses. A modern approach uses a data lake to store raw data files and enable just-in-time analytics using data virtualization. Key aspects of the data lake include storing data in folders by level of processing (raw, staging, ODS, aggregated), using file formats like Parquet, and creating star schemas and aggregations on top of the stored data.
A data warehouse is a central repository for storing historical and integrated data from multiple sources to be used for analysis and reporting. It contains a single version of the truth and is optimized for read access. In contrast, operational databases are optimized for transaction processing and contain current detailed data. A key aspect of data warehousing is using a dimensional model with fact and dimension tables. This allows for analyzing relationships between measures and dimensions in a multi-dimensional structure known as a data cube.
The document defines a data warehouse as a copy of transaction data structured specifically for querying and reporting. Key points are that a data warehouse can have various data storage forms, often focuses on a specific activity or entity, and is designed for querying and analysis rather than transactions. Data warehouses differ from operational systems in goals, structure, size, technologies used, and prioritizing historic over current data. They are used for knowledge discovery through consolidated reporting, finding relationships, and data mining.
Types of database processing,OLTP VS Data Warehouses(OLAP), Subject-oriented
Integrated
Time-variant
Non-volatile,
Functionalities of Data Warehouse,Roll-Up(Consolidation),
Drill-down,
Slicing,
Dicing,
Pivot,
KDD Process,Application of Data Mining
This document discusses decision support, data warehousing, and online analytical processing (OLAP). It defines these terms and compares online transaction processing (OLTP) to OLAP. It describes the evolution of decision support from batch reports to integrated data warehouses. The benefits of separating data warehouses from operational databases are outlined. Common architectures and the design/operational process are summarized.
This document provides an overview of data warehousing and related concepts. It defines a data warehouse as a centralized database for analysis and reporting that stores current and historical data from multiple sources. The document describes key elements of data warehousing including Extract-Transform-Load (ETL) processes, multidimensional data models, online analytical processing (OLAP), and data marts. It also outlines advantages such as enhanced access and consistency, and disadvantages like time required for data extraction and loading.
The document discusses building a data platform for analytics in Azure. It outlines common issues with traditional data warehouse architectures and recommends building a data lake approach using Azure Synapse Analytics. The key elements include ingesting raw data from various sources into landing zones, creating a raw layer using file formats like Parquet, building star schemas in dedicated SQL pools or Spark tables, implementing alerting using Log Analytics, and loading data into Power BI. Building the platform with Python pipelines, notebooks, and GitHub integration is emphasized for flexibility, testability and collaboration.
Lecture 3 - Exploratory Data Analytics (EDA), a lecture in subject module Sta...Maninda Edirisooriya
Exploratory Data Analytics (EDA) is a data Pre-Processing, manual data summarization and visualization related discipline which is an earlier phase of data processing. This was one of the lectures of a full course I taught in University of Moratuwa, Sri Lanka on 2023 second half of the year.
This document provides tips for optimizing performance in Power BI by focusing on different areas like data sources, the data model, visuals, dashboards, and using trace and log files. Some key recommendations include filtering data early, keeping the data model and queries simple, limiting visual complexity, monitoring resource usage, and leveraging log files to identify specific waits and bottlenecks. An overall approach of focusing on time-based optimization by identifying and addressing the areas contributing most to latency is advocated.
This document discusses data warehousing concepts and technologies. It defines a data warehouse as a subject-oriented, integrated, non-volatile, and time-variant collection of data used to support management decision making. It describes the data warehouse architecture including extract-transform-load processes, OLAP servers, and metadata repositories. Finally, it outlines common data warehouse applications like reporting, querying, and data mining.
This document discusses online analytical processing (OLAP) and related concepts. It defines data mining, data warehousing, OLTP, and OLAP. It explains that a data warehouse integrates data from multiple sources and stores historical data for analysis. OLAP allows users to easily extract and view data from different perspectives. The document also discusses OLAP cube operations like slicing, dicing, drilling, and pivoting. It describes different OLAP architectures like MOLAP, ROLAP, and HOLAP and data warehouse schemas and architecture.
Vanderbilt University Medical Center has annual operating expenses of $2.3 billion, an annual sponsored research budget of $471.6 million, and annual unrecovered costs of charity care, community benefits, and other costs of $843.6 million. The document then discusses challenges in accessing and analyzing healthcare data from their databases due to issues such as lack of integration, improper structuring of the data, and cultural barriers between operations and IT. Strategies provided to help address these challenges include establishing standard data requests, designating cross-functional leads, and developing relationships with different types of "data people".
1) Data warehousing aims to bring together information from multiple sources to provide a consistent database for decision support queries and analytical applications, offloading these tasks from operational transaction systems.
2) OLAP is focused on efficient multidimensional analysis of large data volumes for decision making, while OLTP is aimed at reliable processing of high-volume transactions.
3) A data warehouse is a subject-oriented, integrated collection of historical and summarized data used for analysis and decision making, separate from operational databases.
The document discusses building a data warehouse in SQL Server. It provides an agenda that covers topics like an overview of data warehousing, data warehouse design, dimension and fact tables, and physical design. It also discusses components of a data warehousing solution like the data warehouse database, ETL processes, and security considerations.
Business Intelligence (BI) involves transforming raw transactional data into meaningful information for analysis using techniques like OLAP. OLAP allows for multidimensional analysis of data through features like drill-down, slicing, dicing, and pivoting. It provides a comprehensive view of the business using concepts like dimensional modeling. The core of many BI systems is an OLAP engine and multidimensional storage that enables flexible and ad-hoc querying of consolidated data for planning, problem solving and decision making.
Business Intelligence made easy! This is the first part of a two-part presentation I prepared for one of our customers to help them understand what Business Intelligence is and what can it do...
Pushing the limits of ePRTC: 100ns holdover for 100 daysAdtran
At WSTS 2024, Alon Stern explored the topic of parametric holdover and explained how recent research findings can be implemented in real-world PNT networks to achieve 100 nanoseconds of accuracy for up to 100 days.
Dr. Sean Tan, Head of Data Science, Changi Airport Group
Discover how Changi Airport Group (CAG) leverages graph technologies and generative AI to revolutionize their search capabilities. This session delves into the unique search needs of CAG’s diverse passengers and customers, showcasing how graph data structures enhance the accuracy and relevance of AI-generated search results, mitigating the risk of “hallucinations” and improving the overall customer journey.
Unlocking Productivity: Leveraging the Potential of Copilot in Microsoft 365, a presentation by Christoforos Vlachos, Senior Solutions Manager – Modern Workplace, Uni Systems
Communications Mining Series - Zero to Hero - Session 1DianaGray10
This session provides introduction to UiPath Communication Mining, importance and platform overview. You will acquire a good understand of the phases in Communication Mining as we go over the platform with you. Topics covered:
• Communication Mining Overview
• Why is it important?
• How can it help today’s business and the benefits
• Phases in Communication Mining
• Demo on Platform overview
• Q/A
Building Production Ready Search Pipelines with Spark and MilvusZilliz
Spark is the widely used ETL tool for processing, indexing and ingesting data to serving stack for search. Milvus is the production-ready open-source vector database. In this talk we will show how to use Spark to process unstructured data to extract vector representations, and push the vectors to Milvus vector database for search serving.
UiPath Test Automation using UiPath Test Suite series, part 6DianaGray10
Welcome to UiPath Test Automation using UiPath Test Suite series part 6. In this session, we will cover Test Automation with generative AI and Open AI.
UiPath Test Automation with generative AI and Open AI webinar offers an in-depth exploration of leveraging cutting-edge technologies for test automation within the UiPath platform. Attendees will delve into the integration of generative AI, a test automation solution, with Open AI advanced natural language processing capabilities.
Throughout the session, participants will discover how this synergy empowers testers to automate repetitive tasks, enhance testing accuracy, and expedite the software testing life cycle. Topics covered include the seamless integration process, practical use cases, and the benefits of harnessing AI-driven automation for UiPath testing initiatives. By attending this webinar, testers, and automation professionals can gain valuable insights into harnessing the power of AI to optimize their test automation workflows within the UiPath ecosystem, ultimately driving efficiency and quality in software development processes.
What will you get from this session?
1. Insights into integrating generative AI.
2. Understanding how this integration enhances test automation within the UiPath platform
3. Practical demonstrations
4. Exploration of real-world use cases illustrating the benefits of AI-driven test automation for UiPath
Topics covered:
What is generative AI
Test Automation with generative AI and Open AI.
UiPath integration with generative AI
Speaker:
Deepak Rai, Automation Practice Lead, Boundaryless Group and UiPath MVP
How to Get CNIC Information System with Paksim Ga.pptxdanishmna97
Pakdata Cf is a groundbreaking system designed to streamline and facilitate access to CNIC information. This innovative platform leverages advanced technology to provide users with efficient and secure access to their CNIC details.
GraphSummit Singapore | The Art of the Possible with Graph - Q2 2024Neo4j
Neha Bajwa, Vice President of Product Marketing, Neo4j
Join us as we explore breakthrough innovations enabled by interconnected data and AI. Discover firsthand how organizations use relationships in data to uncover contextual insights and solve our most pressing challenges – from optimizing supply chains, detecting fraud, and improving customer experiences to accelerating drug discoveries.
AI 101: An Introduction to the Basics and Impact of Artificial IntelligenceIndexBug
Imagine a world where machines not only perform tasks but also learn, adapt, and make decisions. This is the promise of Artificial Intelligence (AI), a technology that's not just enhancing our lives but revolutionizing entire industries.
Threats to mobile devices are more prevalent and increasing in scope and complexity. Users of mobile devices desire to take full advantage of the features
available on those devices, but many of the features provide convenience and capability but sacrifice security. This best practices guide outlines steps the users can take to better protect personal devices and information.
TrustArc Webinar - 2024 Global Privacy SurveyTrustArc
How does your privacy program stack up against your peers? What challenges are privacy teams tackling and prioritizing in 2024?
In the fifth annual Global Privacy Benchmarks Survey, we asked over 1,800 global privacy professionals and business executives to share their perspectives on the current state of privacy inside and outside of their organizations. This year’s report focused on emerging areas of importance for privacy and compliance professionals, including considerations and implications of Artificial Intelligence (AI) technologies, building brand trust, and different approaches for achieving higher privacy competence scores.
See how organizational priorities and strategic approaches to data security and privacy are evolving around the globe.
This webinar will review:
- The top 10 privacy insights from the fifth annual Global Privacy Benchmarks Survey
- The top challenges for privacy leaders, practitioners, and organizations in 2024
- Key themes to consider in developing and maintaining your privacy program
For the full video of this presentation, please visit: https://www.edge-ai-vision.com/2024/06/building-and-scaling-ai-applications-with-the-nx-ai-manager-a-presentation-from-network-optix/
Robin van Emden, Senior Director of Data Science at Network Optix, presents the “Building and Scaling AI Applications with the Nx AI Manager,” tutorial at the May 2024 Embedded Vision Summit.
In this presentation, van Emden covers the basics of scaling edge AI solutions using the Nx tool kit. He emphasizes the process of developing AI models and deploying them globally. He also showcases the conversion of AI models and the creation of effective edge AI pipelines, with a focus on pre-processing, model conversion, selecting the appropriate inference engine for the target hardware and post-processing.
van Emden shows how Nx can simplify the developer’s life and facilitate a rapid transition from concept to production-ready applications.He provides valuable insights into developing scalable and efficient edge AI solutions, with a strong focus on practical implementation.
Maruthi Prithivirajan, Head of ASEAN & IN Solution Architecture, Neo4j
Get an inside look at the latest Neo4j innovations that enable relationship-driven intelligence at scale. Learn more about the newest cloud integrations and product enhancements that make Neo4j an essential choice for developers building apps with interconnected data and generative AI.
GraphSummit Singapore | The Future of Agility: Supercharging Digital Transfor...Neo4j
Leonard Jayamohan, Partner & Generative AI Lead, Deloitte
This keynote will reveal how Deloitte leverages Neo4j’s graph power for groundbreaking digital twin solutions, achieving a staggering 100x performance boost. Discover the essential role knowledge graphs play in successful generative AI implementations. Plus, get an exclusive look at an innovative Neo4j + Generative AI solution Deloitte is developing in-house.
GraphRAG for Life Science to increase LLM accuracyTomaz Bratanic
GraphRAG for life science domain, where you retriever information from biomedical knowledge graphs using LLMs to increase the accuracy and performance of generated answers
GraphRAG for Life Science to increase LLM accuracy
Whats A Data Warehouse
1. What is a Data Warehouse?
And Why Are So Many
Schools Setting Them Up?
Richard Goerwitz
2. What Is a Data Warehouse?
Nobody can agree
So I’m not actually going to define a DW
Don’t feel cheated, though
By the end of this talk, you’ll
• Understand key concepts that underlie all
warehouse implementations (“talk the talk”)
• Understand the various components out of
which DW architects construct real-world data
warehouses
• Understand what a data warehouse project
looks like
3. Why Are Schools Setting Up
Data Warehouses?
A data warehouse makes it easier to:
• Optimize classroom, computer lab usage
• Refine admissions ratings systems
• Forecast future demand for courses, majors
• Tie private spreadsheet data into central repositories
• Correlate admissions and IR data with outcomes such as:
GPAs
Placement rates
Happiness, as measured by alumni surveys
• Notify advisors when extra help may be needed based on
Admissions data (student vitals; SAT, etc.)
Special events: A-student suddenly gets a C in his/her major
Slower trends: Student’s GPA falls for > 2 semesters/terms
• (Many other examples could be given!)
Better information = better decisions
• Better admission decisions
• Better retention rates
• More effective fund raising, etc.
4. Talking The Talk
To think and communicate usefully about data warehouses
you’ll need to understand a set of common terms and
concepts:
• OLTP
• ODS
• OLAP, ROLAP, MOLAP
• ETL
• Star schema
• Conformed dimension
• Data mart
• Cube
• Metadata
Even if you’re not an IT person, pay heed:
• You’ll have to communicate with IT people
• More importantly:
Evidence shows that IT will only build a successful warehouse if you
are intimately involved!
5. OLTP
OLTP = online transaction processing
The process of moving data around to
handle day-to-day affairs
• Scheduling classes
• Registering students
• Tracking benefits
• Recording payments, etc.
Systems supporting this kind of activity
are called transactional systems
6. Transactional Systems
Transactional systems are optimized primarily for
the here and now
• Can support many simultaneous users
• Can support heavy read/write access
• Allow for constant change
• Are big, ugly, and often don’t give people the data they
want
As a result a lot of data ends up in shadow databases
Some ends up locked away in private spreadsheets
Transactional systems don’t record all previous
data states
Lots of data gets thrown away or archived, e.g.:
• Admissions data
• Enrollment data
• Asset tracking data (“How many computers did we
support each year, from 1996 to 2006, and where do we
expect to be in 2010?”)
7. Simple Transactional Database
Map of Microsoft
Windows Update
Service (WUS)
back-end database
• Diagrammed using
Sybase
PowerDesigner
Each green box is a
database “table”
Arrows are “joins” or
foreign keys
This is simple for an
OLTP back end
8. More Complex Example
Recruitment Plus back-end
database
Used by many admissions
offices
Note again:
• Green boxes are tables
• Lines are foreign key
relationships
• Purple boxes are views
Considerable expertise is
required to report off this
database!
Imagine what it’s like for
even more complex
systems
• Colleague
• SCT Banner (over 4,000
tables)
9. The “Reporting Problem”
Often we require OLTP data as a snapshot, in a
spreadsheet or report
Reports require querying back-end OLTP support
databases
But OLTP databases are often very complex, and
typically
• Contain many, often obscure, tables
• Utilize cryptic, unintuitive field/column names
• Don’t store all necessary historical data
As a result, reporting becomes a problem –
• Requires special expertise
• May require modifications to production OLTP systems
• Becomes harder and harder for staff to keep up!
10. Workarounds
Ways of working around the reporting
problem include:
1. Have OLTP system vendors do the work
• Provide canned reports
• Write reporting GUIs for their products
2. Hire more specialists
• To create simplified views of OLTP data
• To write reports, create snapshots
3. Periodically copy data from OLTP systems to
a place where
• The data is easier to understand
• The data is optimized for reporting
• Easily pluggable into reporting tools
11. ODS
ODS = operational data store
ODSs were an early workaround to the “reporting
problem”
To create an ODS you
• Build a separate/simplified version of an OLTP system
• Periodically copy data into it from the live OLTP system
• Hook it to operational reporting tools
An ODS can be an integration point or real-time
“reporting database” for an operational system
It’s not enough for full enterprise-level, cross-
database analytical processing
12. OLAP
OLAP = online analytical processing
OLAP is the process of creating and
summarizing historical, multidimensional
data
• To help users understand the data better
• Provide a basis for informed decisions
• Allow users to manipulate and explore data
themselves, easily and intuitively
More than just “reporting”
Reporting is just one (static) product of
OLAP
13. OLAP Support Databases
OLAP systems require support databases
These databases typically
• Support fewer simultaneous users than OLTP
back ends
• Are structured simply; i.e., denormalized
• Can grow large
Hold snapshots of data in OLTP systems
Provide history/time depth to our analyses
• Are optimized for read (not write) access
• Updated via periodic batch (e.g., nightly) ETL
processes
14. ETL Processes
ETL = extract, transform, load
• Extract data from various sources
• Transform and clean the data from those sources
• Load the data into databases used for analysis and
reporting
ETL processes are coded in various ways
• By hand in SQL, UniBASIC, etc.
• Using more general programming languages
• In semi-automated fashion using specialized ETL tools
like Cognos Decision Stream
Most institutions do hand ETL; but note well:
• Hand ETL is slow
• Requires specialized knowledge
• Becomes extremely difficult to maintain as code
accumulates and databases/personnel change!
15. Where Does the Data Go?
What sort of a database do the ETL
processes dump data into?
Typically, into very simple table
structures
These table structures are:
• Denormalized
• Minimally branched/hierarchized
• Structured into star schemas
16. So What Are Star Schemas?
Star schemas are collections of data arranged
into star-like patterns
• They have fact tables in the middle, which contain
amounts, measures (like counts, dollar amounts, GPAs)
• Dimension tables around the outside, which contain
labels and classifications (like names, geocodes, majors)
• For faster processing, aggregate fact tables are
sometimes also used (e.g., counts pre-averaged for an
entire term)
Star schemas should
• Have descriptive column/field labels
• Be easy for users to understand
• Perform well on queries
17. A Very Simple Star Schema
Data Center UPS
Power Output
Dimensions:
Phase
Time
Date
Facts:
Volts
Amps
Etc.
18. A More Complex Star Schema
Freshman survey
data (HERI/CIRP)
Dimensions:
• Questions
• Survey years
• Data about test
takers
Facts:
• Answer (text)
• Answer (raw)
• Count (1)
Oops
• Not a star
Oops, answers should have been placed in their • Snowflaked!
own dimension (creating a “factless fact table”).
I’ll demo a better version of this star later!
19. Data Marts
One definition:
• One or more star schemas that present data on a single
or related set of business processes
Data marts should not be built in isolation
They need to be connected via dimensional tables
that are
• The same or subsets of each other
• Hierarchized the same way internally
So, e.g., if I construct data marts for…
• GPA trends, student major trends, enrollments
• Freshman survey data, senior survey data, etc.
…I connect these marts via a conformed student
dimension
• Makes correlation of data across star schemas intuitive
• Makes it easier for OLAP tools to use the data
• Allows nonspecialists to do much of the work
20. Simple Data Mart Example
UPS
Battery star
By battery
Run-time
% charged
Current
Input star
By phase
Voltage
Current
Output star
By phase
Voltage
Current
Sensor star
By sensor
Temp
Humidity
Note conformed date,
time dimensions!
21. CIRP Star/Data Mart
CIRP
Freshman
survey data
Corrected
from a
previous
slide
Note the
CirpAnswer
dimension
Note student
dimension
(ties in with
other marts)
23. ROLAP, MOLAP
ROLAP = OLAP via direct relational query
• E.g., against a (materialized) view
• Against star schemas in a warehouse
MOLAP = OLAP via multidimensional
database (MDB)
• MDB is a special kind of database
• Treats data kind of like a big, fast spreadsheet
• MDBs typically draw data in from a data
warehouse
Built to work best with star schemas
24. Data Cubes
The term data cube
means different things to
different people
Various definitions:
• A star schema
• Any DB view used for
reporting
• A three-dimensional
array in a MDB
• Any multidimensional
MDB array (really a
hypercube)
Which definition do you
suppose is technically
correct?
25. Metadata
Metadata = data about data
In a data warehousing context it can mean many
things
• Information on data in source OLTP systems
• Information on ETL jobs and what they do to the data
• Information on data in marts/star schemas
• Documentation in OLAP tools on the data they
manipulate
Many institutions make metadata available via
data malls or warehouse portals, e.g.:
• University of New Mexico
• UC Davis
• Rensselear Polytechnic Institute
• University of Illinois
Good ETL tools automate the setup of
malls/portals!
26. The Data Warehouse
OK now we’re experts in terms like OLTP, OLAP,
star schema, metadata, etc.
Let’s use some of these terms to describe how a
DW works:
• Provides ample metadata – data about the data
• Utilizes easy-to-understand column/field names
• Feeds multidimensional databases (MDBs)
• Is updated via periodic (mainly nightly) ETL jobs
• Presents data in a simplified, denormalized form
• Utilizes star-like fact/dimension table schemas
• Encompasses multiple, smaller data “marts”
• Supports OLAP tools (Access/Excel, Safari, Cognos BI)
• Derives data from (multiple) back-end OLTP systems
• Houses historical data, and can grow very big
27. A Data Warehouse is Not…
Vendor and consultant proclamations
aside, a data warehouse is not:
• A project
With a specific end date
• A product you buy from a vendor
Like an ODS (such as SCT’s)
A canned “warehouse” supplied by iStrategy
Cognos ReportNet
• A database schema or instance
Like Oracle
SQL Server
• A cut-down version of your live transactional
database
28. Kimball & Caserta’s Definition
According to Ralph Kimball and Joe
Caserta, a data warehouse is:
A system that extracts, cleans, conforms, and
delivers source data into a dimensional data
store and then supports and implements
querying and analysis for the purpose of
decision making.
Another def.: The union of all the enterprise’s data marts
Aside: The Kimball model is not without some critics:
• E.g., Bill Inmon
29. Example Data Warehouse (1)
This one is
RPI’s
5 parts:
• Sources
• ETL stuff
• DW proper
• Cubes etc.
• OLAP apps
30. Example Data Warehouse (2)
Caltech’s DW
Five Parts:
• Source systems
• ETL processes
• Data marts
• FM/metadata
• Reporting and
analysis tools
• Note: They’re
also customers
of Cognos!
31. So Where is Colorado College?
Phil Goldstein (Educause Center for Applied
Research fellow) identifies the major deployment
levels:
• Level 1: Transactional systems only
• Level 2a: ODS or single data mart; no ETL
• Level 2: ODS or single data mart with ETL tools
• Level 3a: Warehouse or multiple marts; no ETL; OLAP
• Level 3b: Warehouse or multiple marts; ETL; OLAP
• Level 3: Enterprise-wide warehouse or multiple marts;
ETL tools; OLAP tools
Goldstein’s study was just released in late 2005
It’s very good; based on real survey data
Which level is Colorado College at?
32. Implementing a Data Warehouse
In many organizations IT people want to huddle and work
out a warehousing plan, but in fact
• The purpose of a DW is decision support
• The primary audience of a DW is therefore College decision
makers
• It is College decision makers therefore who must determine
Scope
Priority
Resources
Decision makers can’t make these determinations without
an understanding of data warehouses
It is therefore imperative that key decision makers first be
educated about data warehouses
• Once this occurs, it is possible to
Elicit requirements (a critical step that’s often skipped)
Determine priorities/scope
Formulate a budget
Create a plan and timeline, with real milestones and deliverables!
33. Is This Really a Good Plan?
Sure, according to Phil Goldstein (Educause Center for
Applied Research)
He’s conducted extensive surveys on “academic analytics”
(= business intelligence for higher ed)
His four recommendations for improving analytics:
• Key decisionmakers must lead the way
• Technologists must collaborate
• Must collect requirements
• Must form strong partnerships with functional sponsors
• IT must build the needed infrastructure
• Carleton violated this rule with Cognos BI
• As we discovered, without an ETL/warehouse infrastructure,
success with OLAP is elusive
• Staff must train and develop deep analysis skills
Goldstein’s findings mirror closely the advice of industry
heavyweights – Ralph Kimball, Laura Reeves, Margie Ross,
Warren Thornthwaite, etc.
34. Isn’t a DW a Huge Undertaking?
Sure, it can be huge
Don’t hold on too tightly to the big-
sounding word, “warehouse”
Luminaries like Ralph Kimball have shown
that a data warehouse can be built
incrementally
• Can start with just a few data marts
• Targeted consulting help will ensure proper,
extensible architecture and tool selection
35. What Takes Up the Most Time?
You may be surprised 90
to learn what DW step 80
70
takes the most time 60
Hardware
Try guessing which:
50 East
Database
ETL
40 West
Schemas
• Hardware 30 North
OLAP tools
20
• Physical database setup
10
• Database design 0
1st Qtr 2nd Qtr 3rd Qtr 4th Qtr
• ETL
• OLAP setup
Acc. to Kimball & Caserta, ETL will eat up 70% of the time.
Other analysts give estimates ranging from 50% to 80%.
The most often underestimated part of the warehouse
project!
36. Eight Month Initial Deployment
Step Duration Step Duration
Begin educating decision makers 21 days Secure, configure network 1 day
Collect requirements 14 days Deploy physical “target” DB 4 days
Decide general DW design 7 days Learn/deploy ETL tool 28 days
Determine budget 3 days Choose/set up modeling tool 21 days
Identify project roles 1 day Design initial data mart 7 days
Eval/choose ETL tool 21 days Design ETL processes 28 days
Eval/choose physical DB 14 days Hook up OLAP tools 7 days
Spec/order, configure server 20 days Publicize, train, train 21 days
37. Conclusion
Information is held in transactional systems
• But transactional systems are complex
• They don’t talk to each other well; each is a silo
• They require specially trained people to report off of
For normal people to explore institutional data, data in
transactional systems needs to be
• Renormalized as star schemas
• Moved to a system optimized for analysis
• Merged into a unified whole in a data warehouse
Note: This process must be led by “customers”
• Yes, IT people must build the infrastructure
• But IT people aren’t the main customers
So who are the customers?
• Admissions officers trying to make good admission decisions
• Student counselors trying to find/help students at risk
• Development offers raising funds that support the College
• Alumni affairs people trying to manage volunteers
• Faculty deans trying to right-size departments
• IT people managing software/hardware assets, etc….