Downloaded 89 times

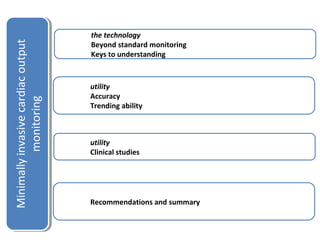
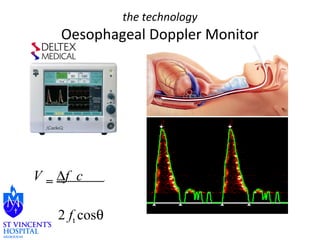


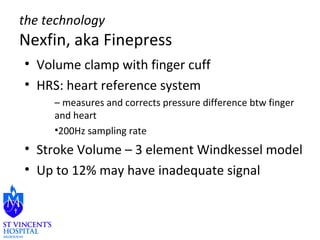

![the technology
Finepress
• Nexfin and
arterial
pressure
– MAP
correlates well
– SBP
underestimate
s
– CI has looser
agreement
Fischer M O et al. Br. J. Anaesth. 2012;109:514-521
© The Author [2012]. Published by Oxford University Press on behalf of the British Journal of
Anaesthesia. All rights reserved. For Permissions, please email:
journals.permissions@oup.com](https://image.slidesharecdn.com/01tuongphan-141203080637-conversion-gate01/85/01-tuong-phan-26-320.jpg)
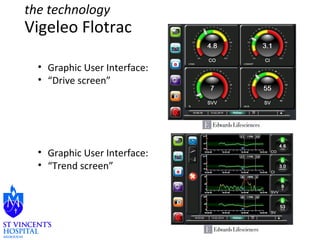
![the technology
Masimo
• Pulse oximetry
• Plethysmographic
variability index (PVI)
– It measures the dynamic
changes in perfusion index
(PI) over respiratory cycles
and calculated as follows:
– PVI = [(PImax – PImin)/PImax] x
100%.
• ΔPOP
• COHb
• Continuous Hb](https://image.slidesharecdn.com/01tuongphan-141203080637-conversion-gate01/85/01-tuong-phan-28-320.jpg)
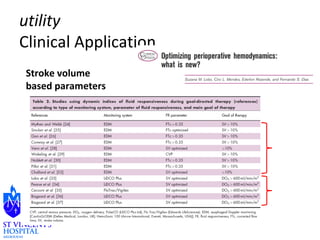
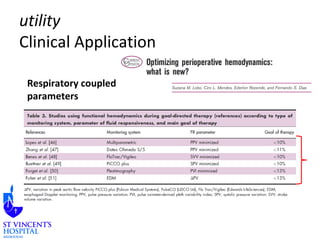
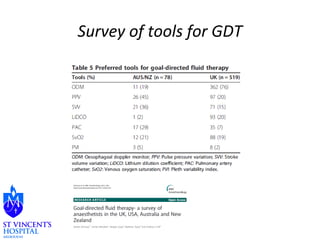
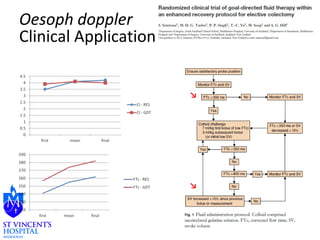
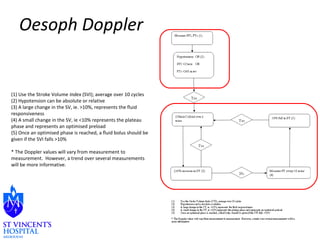
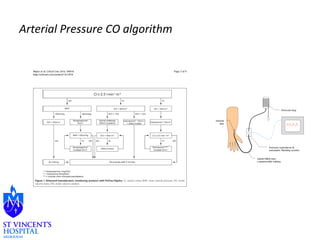

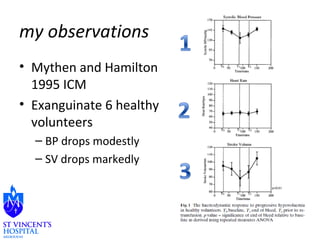
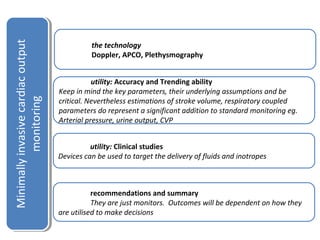

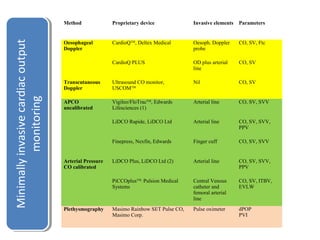
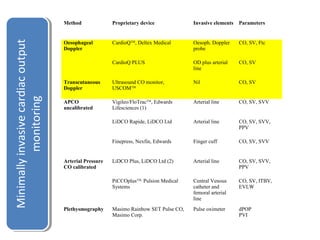
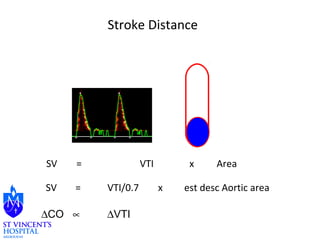
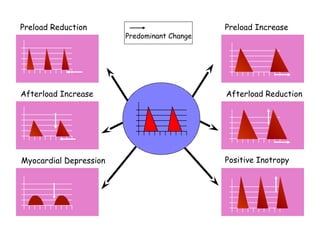
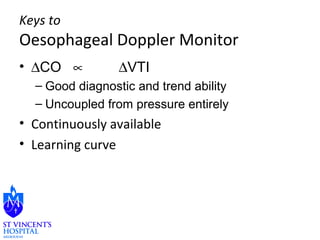
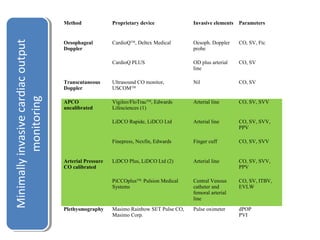
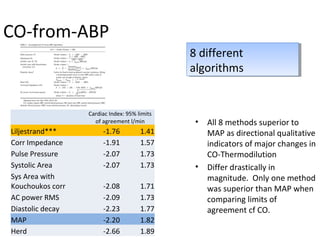
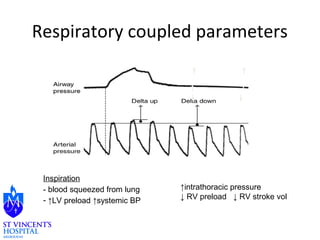
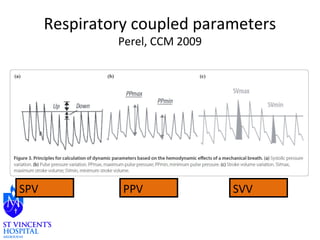
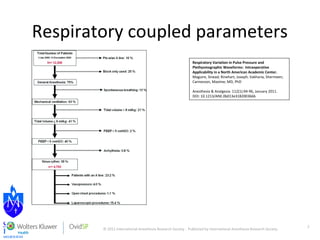
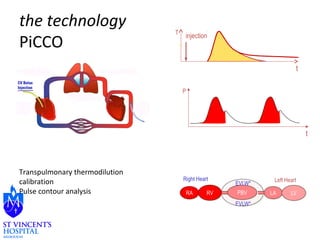
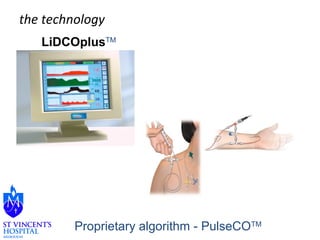
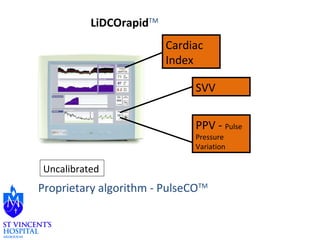
The document discusses advances in minimally invasive cardiac output monitoring technologies. It describes several technologies including oesophageal Doppler, arterial pressure waveform analysis, pulse contour analysis, pulse oximetry plethysmography, and their respective advantages. Key parameters provided include stroke volume, cardiac output, and respiratory variation indices. While accuracy varies between methods, respiratory coupled parameters have been shown to predict fluid responsiveness. Overall, minimally invasive cardiac output monitoring provides useful haemodynamic data but outcomes depend on how clinicians utilize the information to guide care.


