Downloaded 527 times
![Index of Left Ventricular Contractility*
t [s]
P [mm Hg]
dPmx* =dP/dtmax of arterial pressure curve
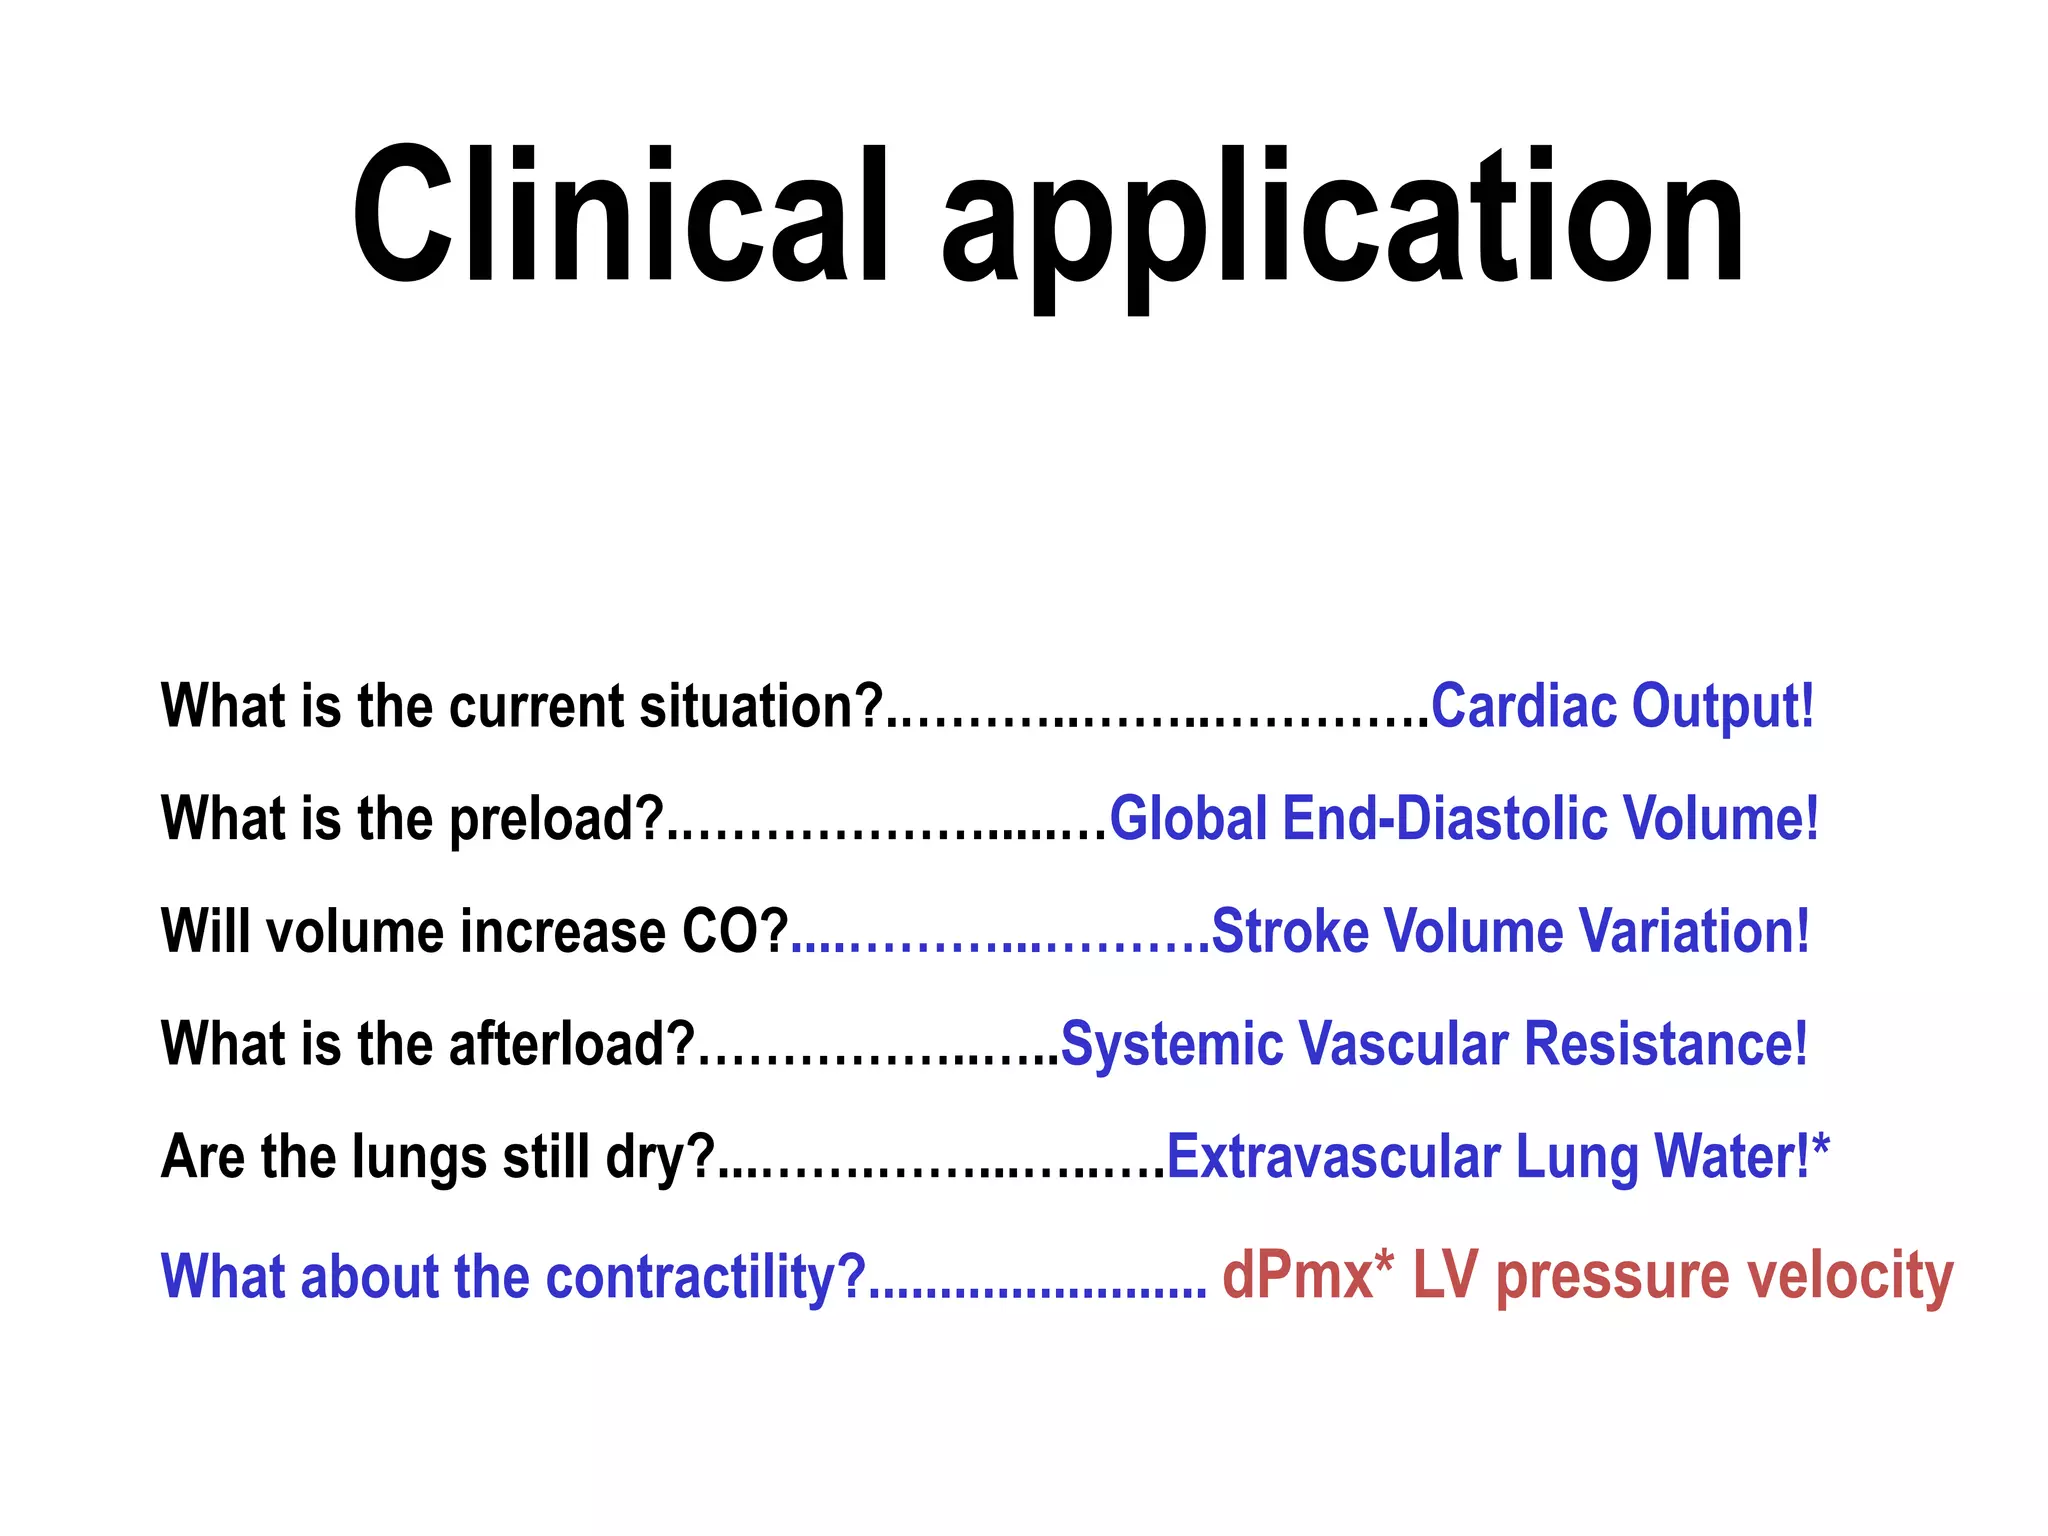
dPmx* represents left ventricular pressure velocity increase and thus is a
parameter of myocardial contractility](https://image.slidesharecdn.com/advancedhemodynamicmonitoring-140815085154-phpapp01/75/Advanced-hemodynamic-monitoring-19-2048.jpg)
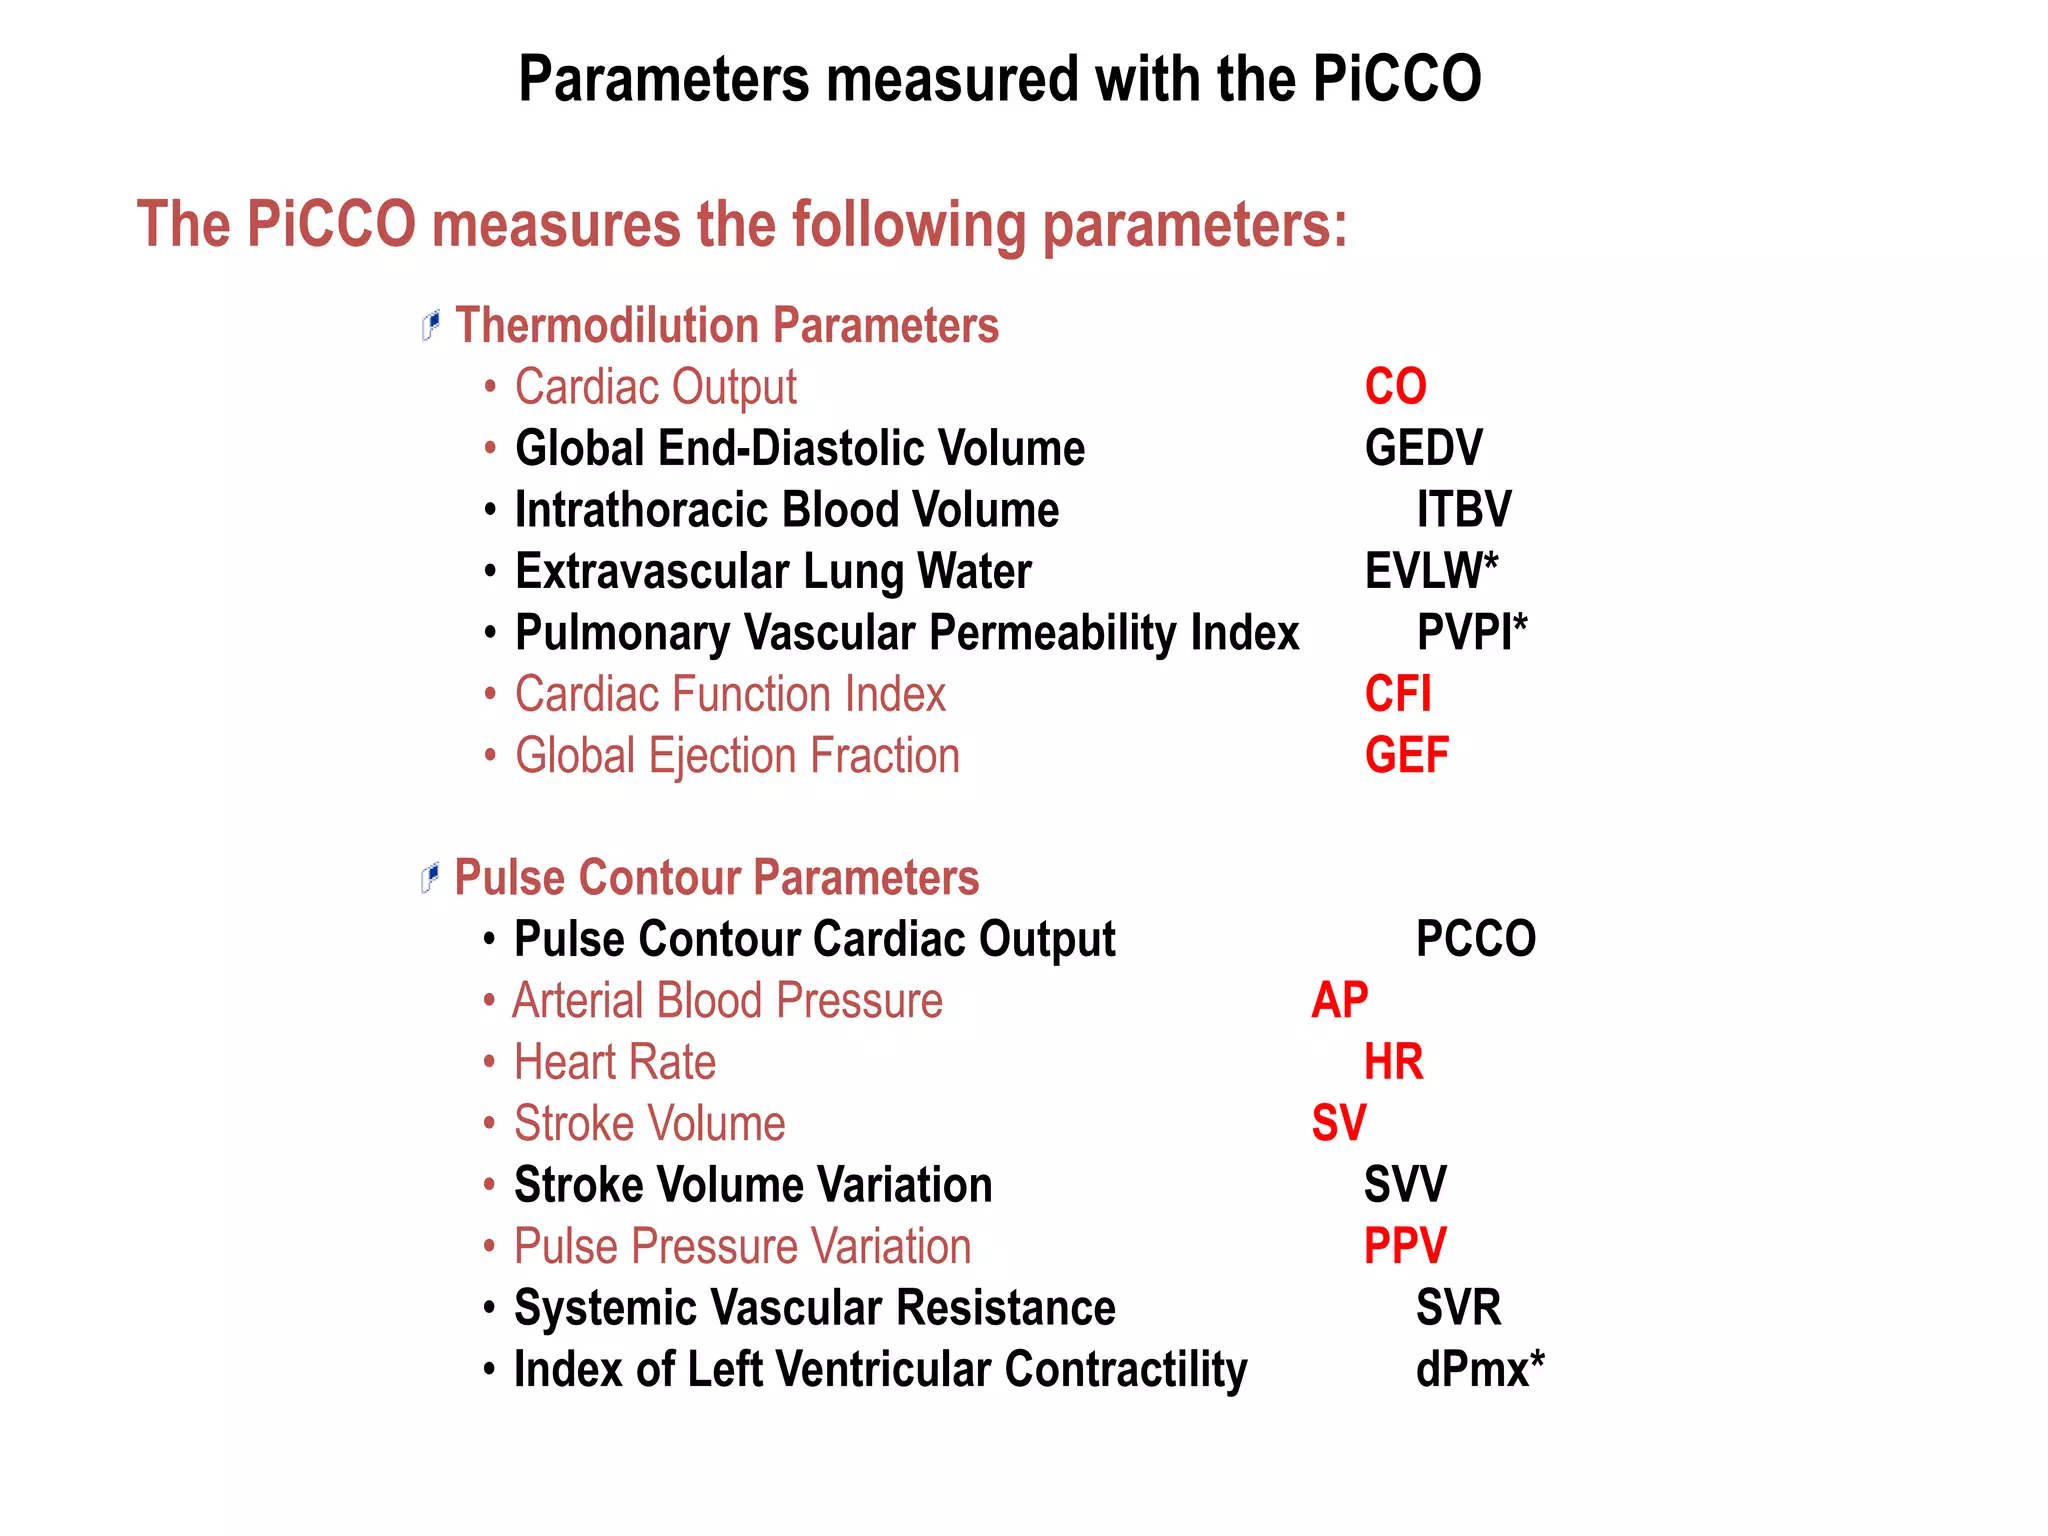
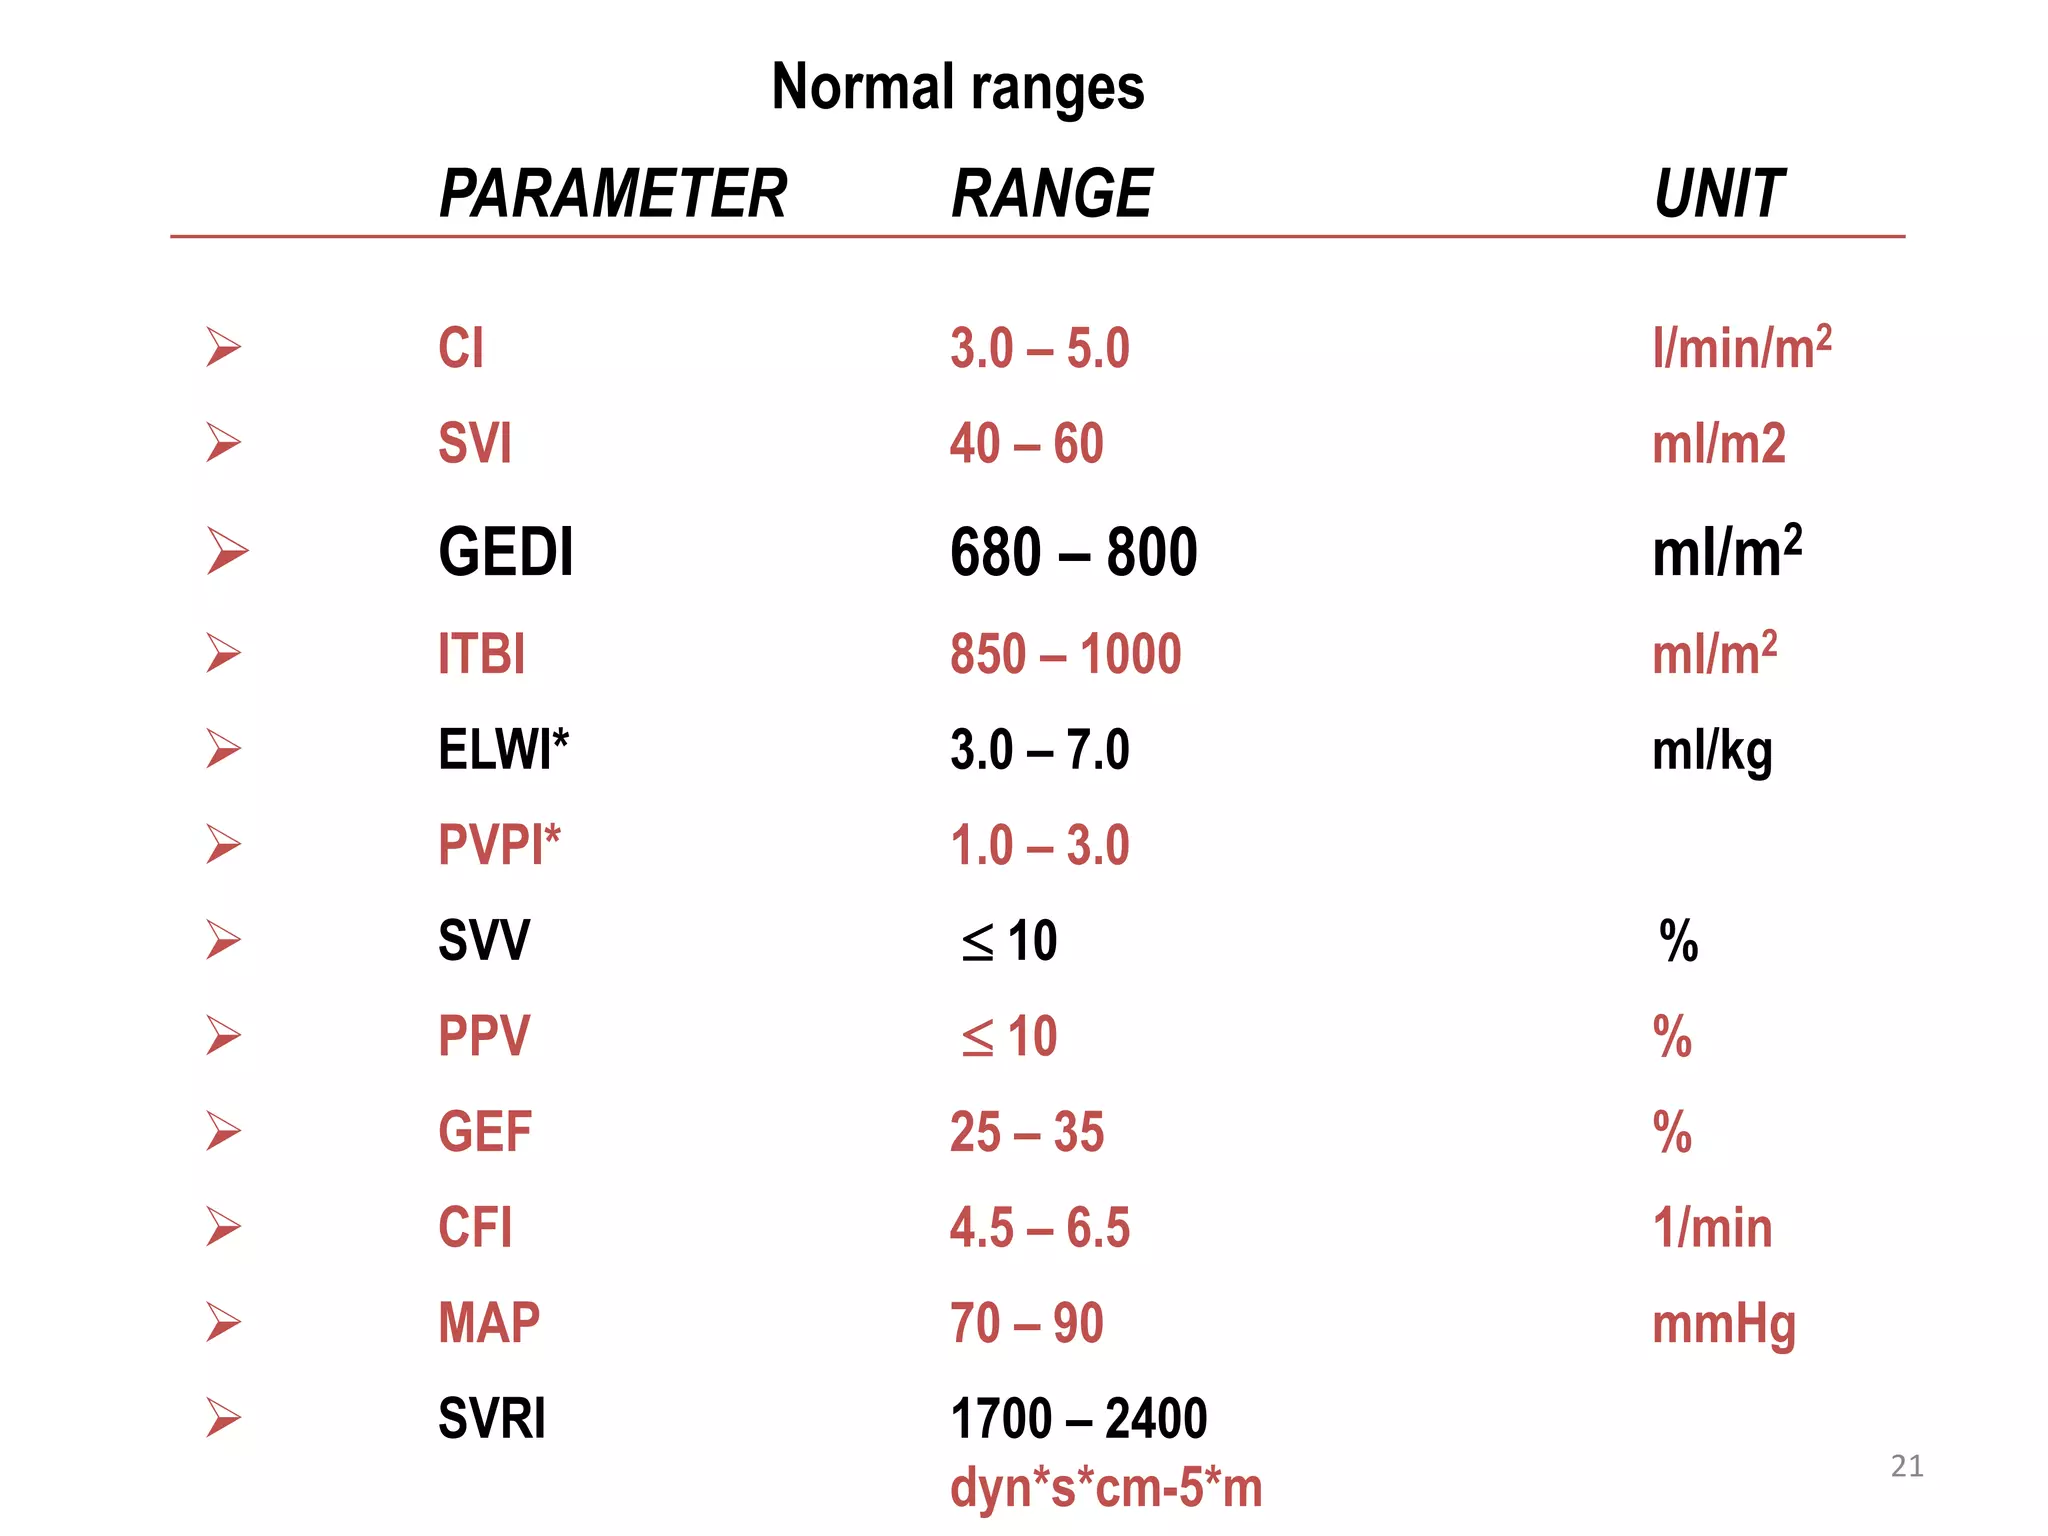
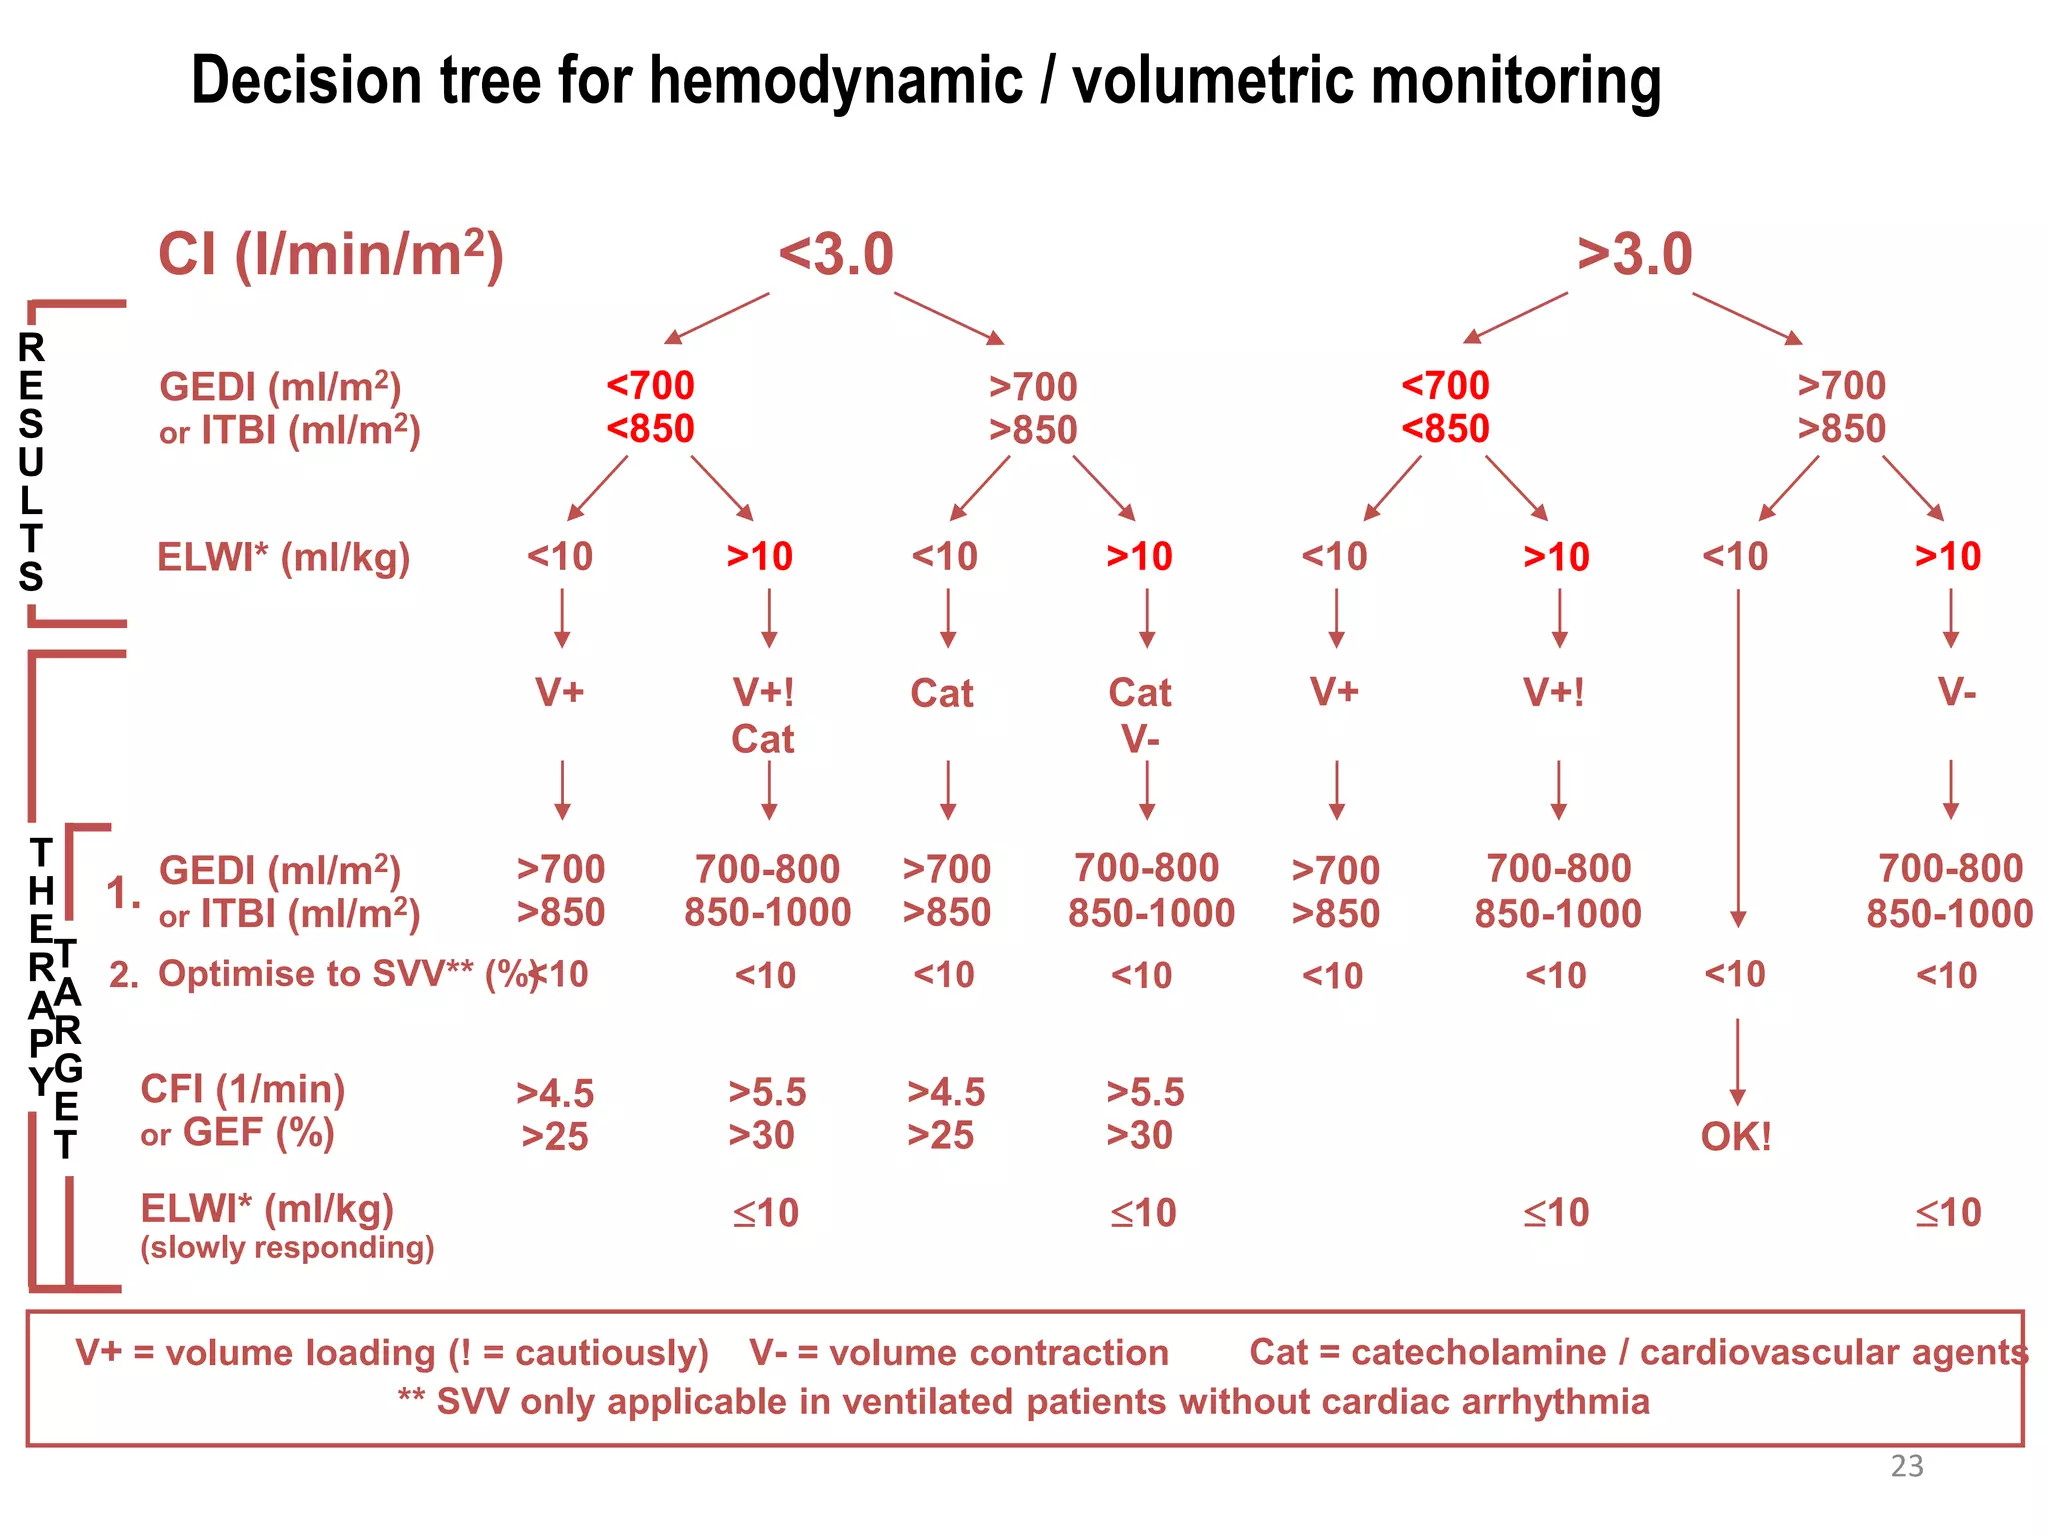
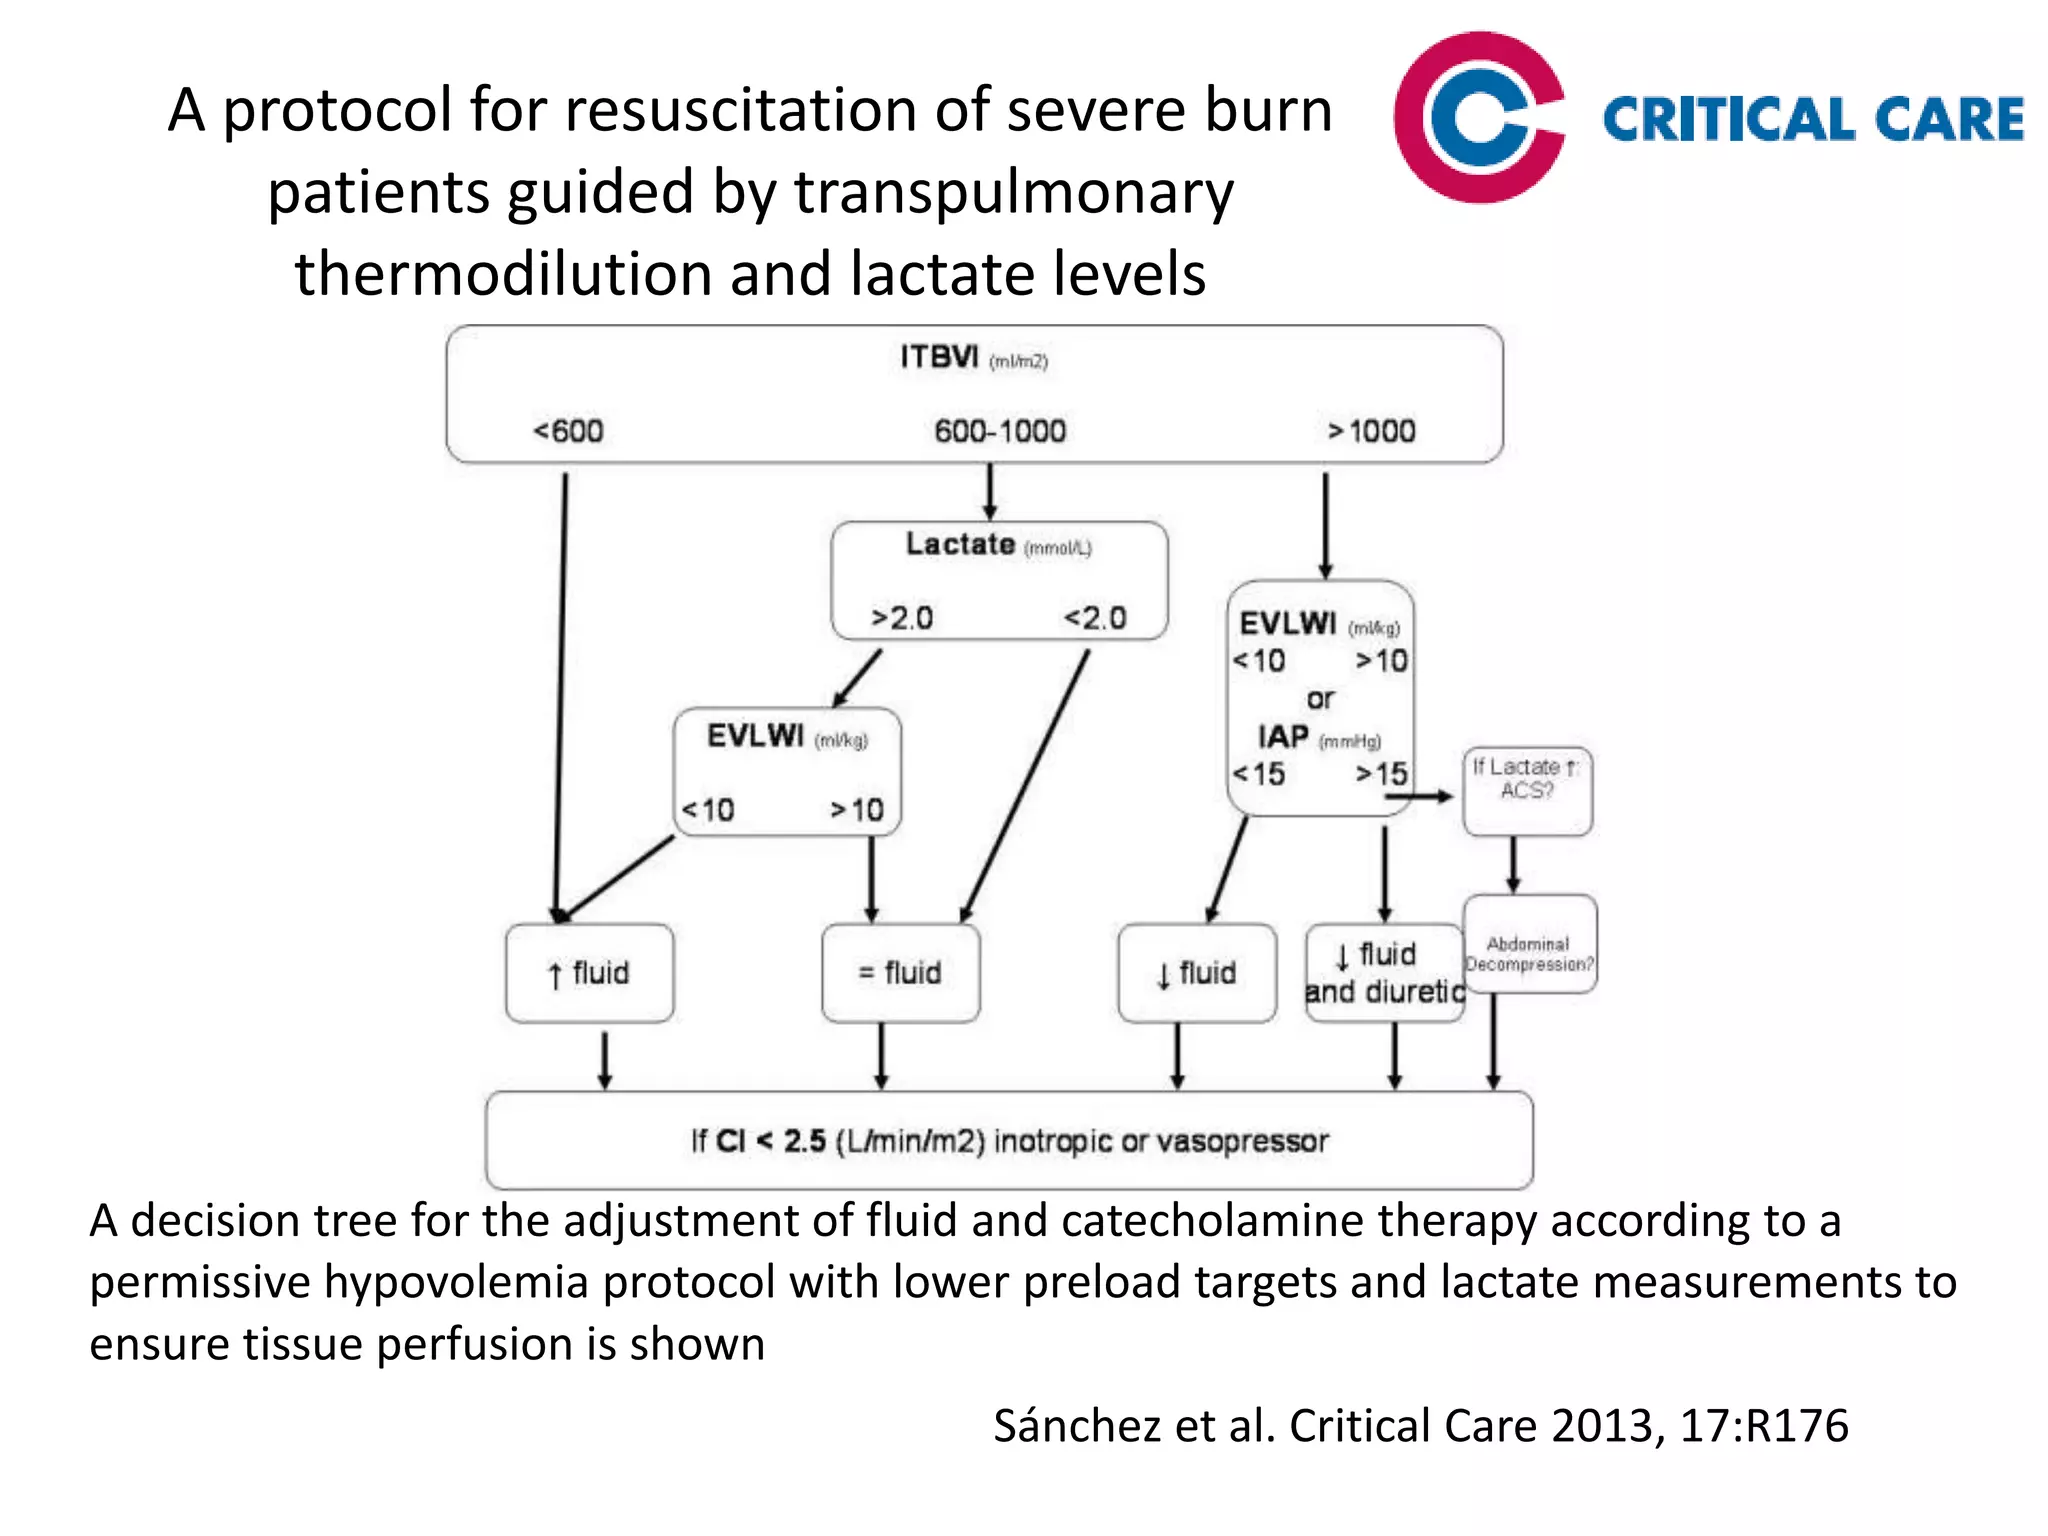
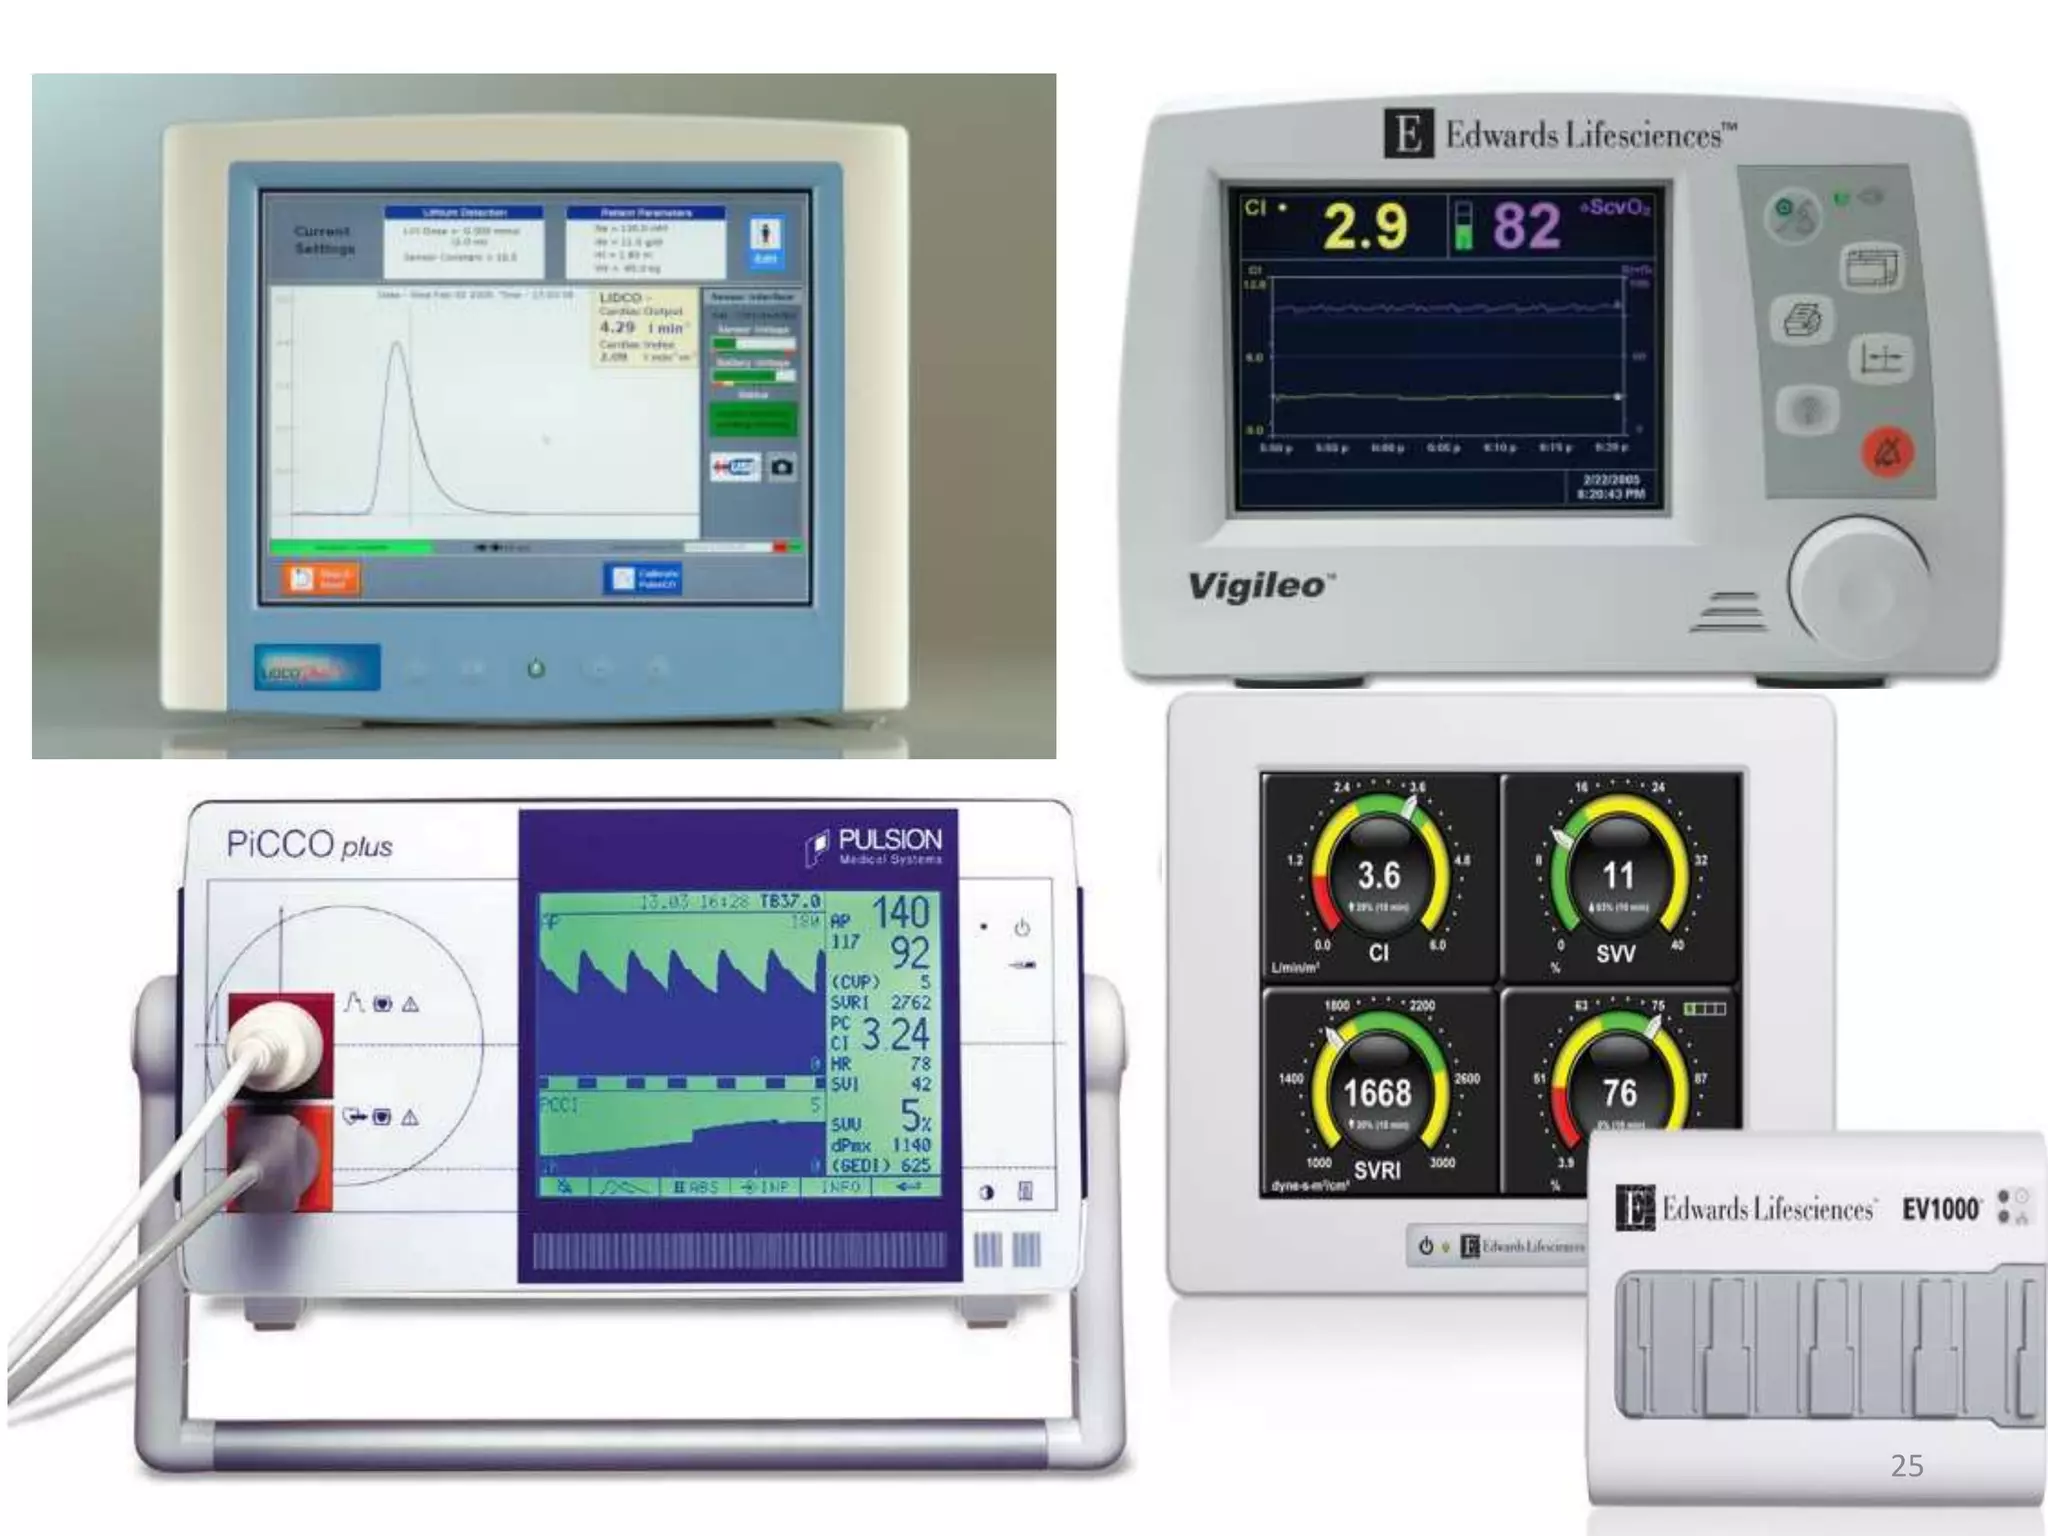


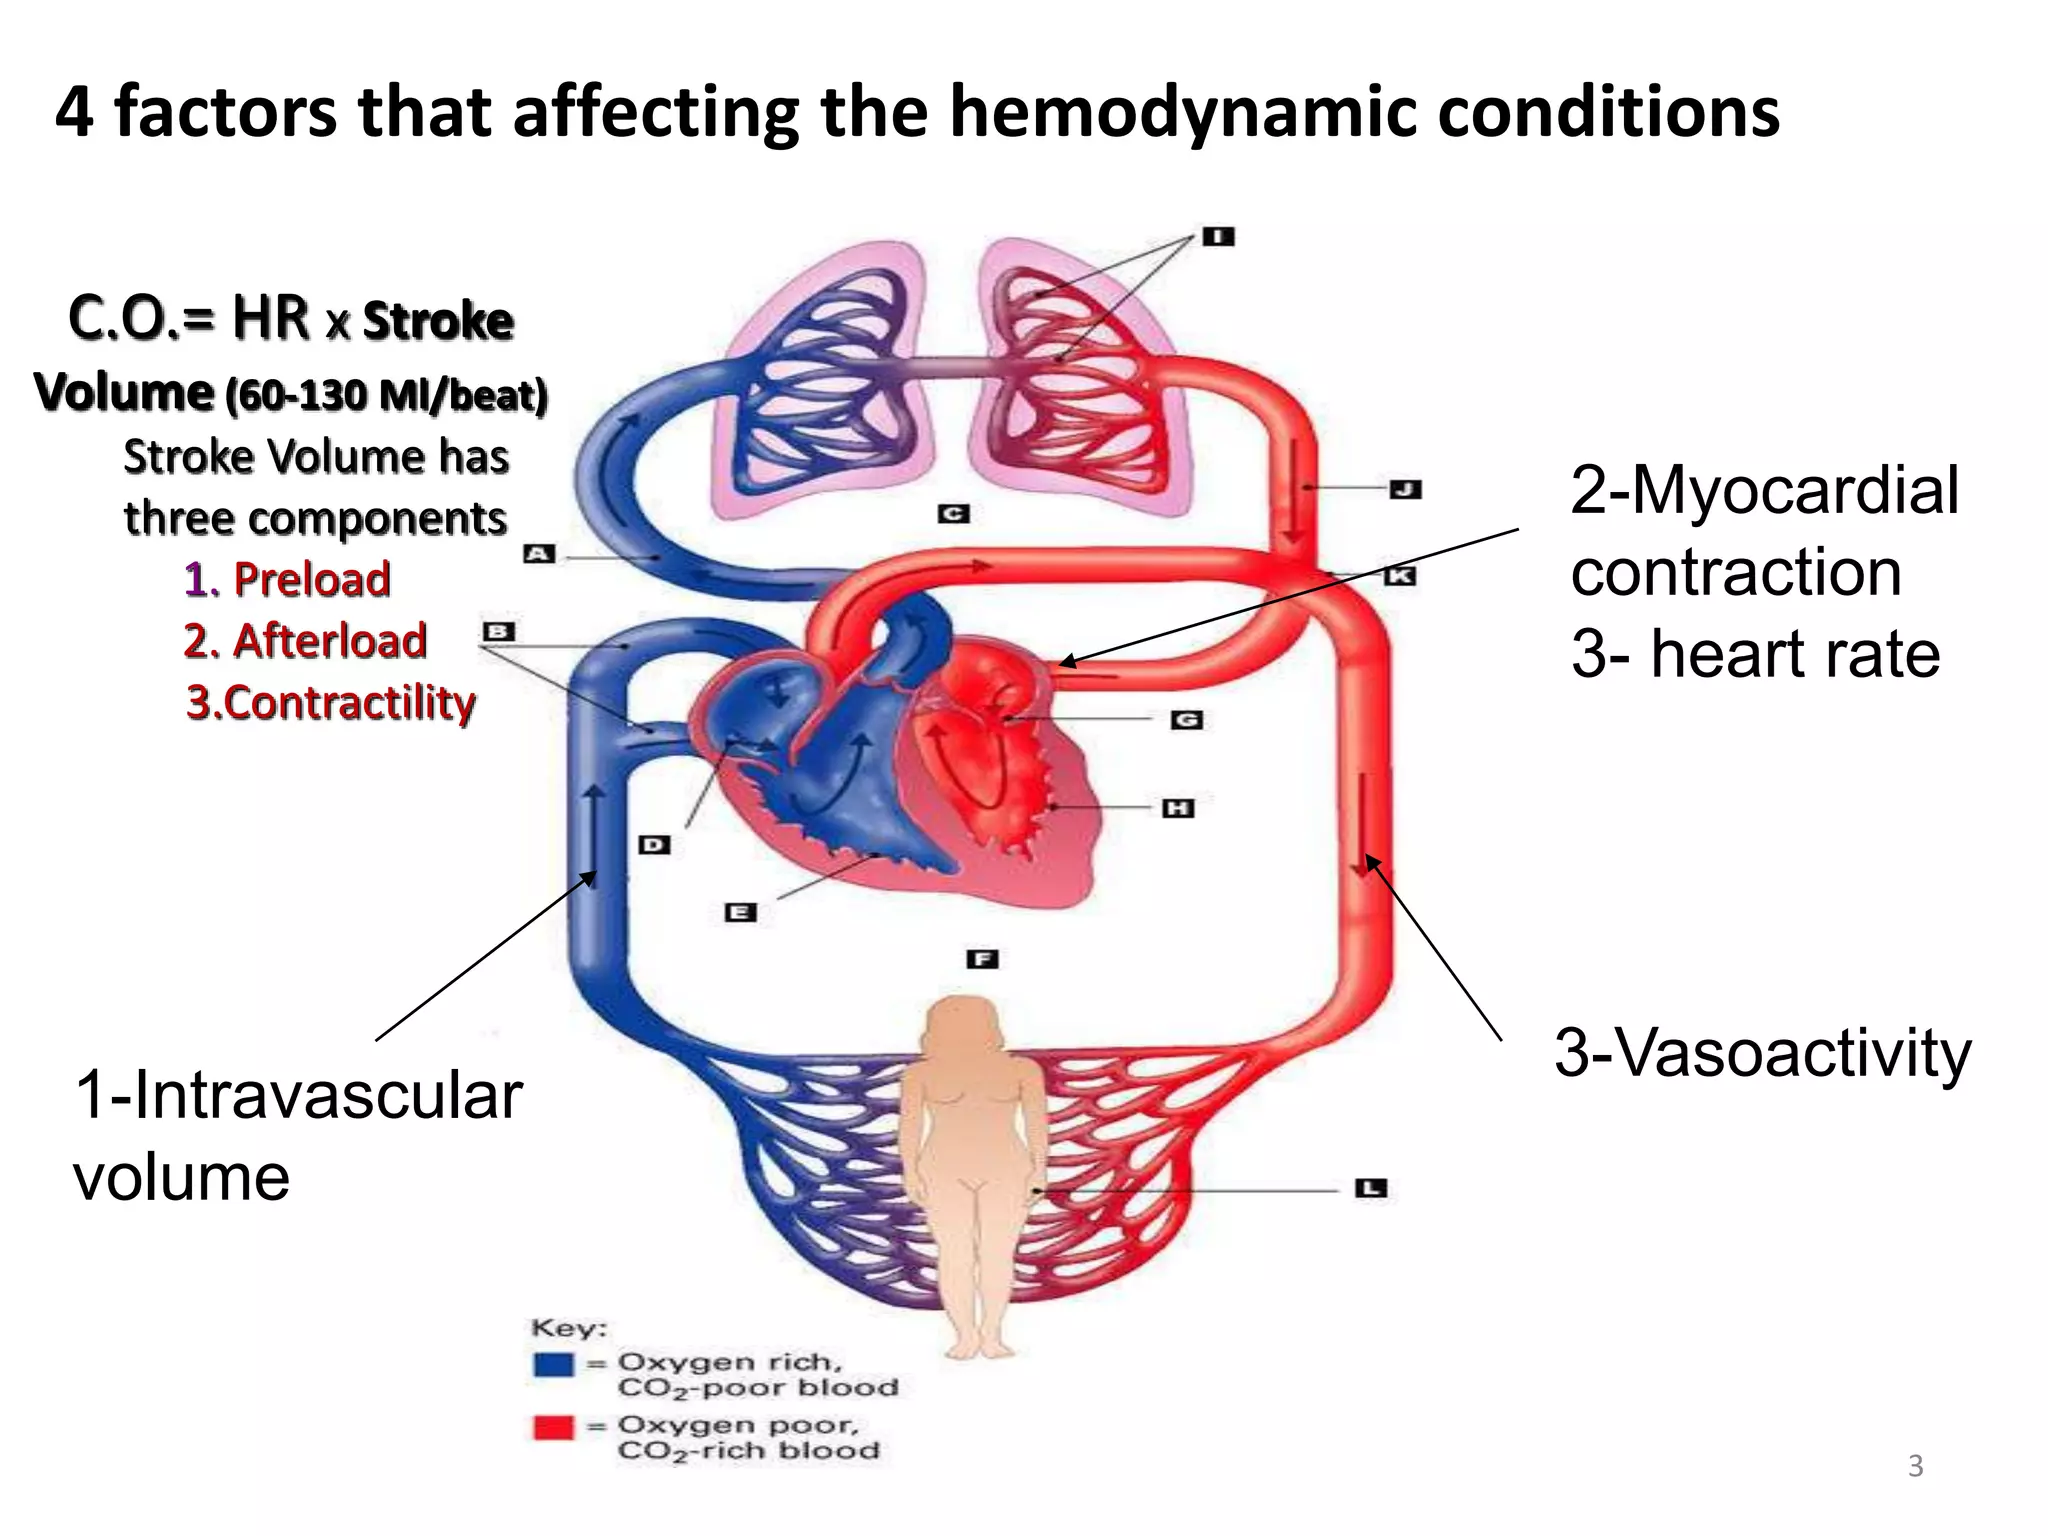
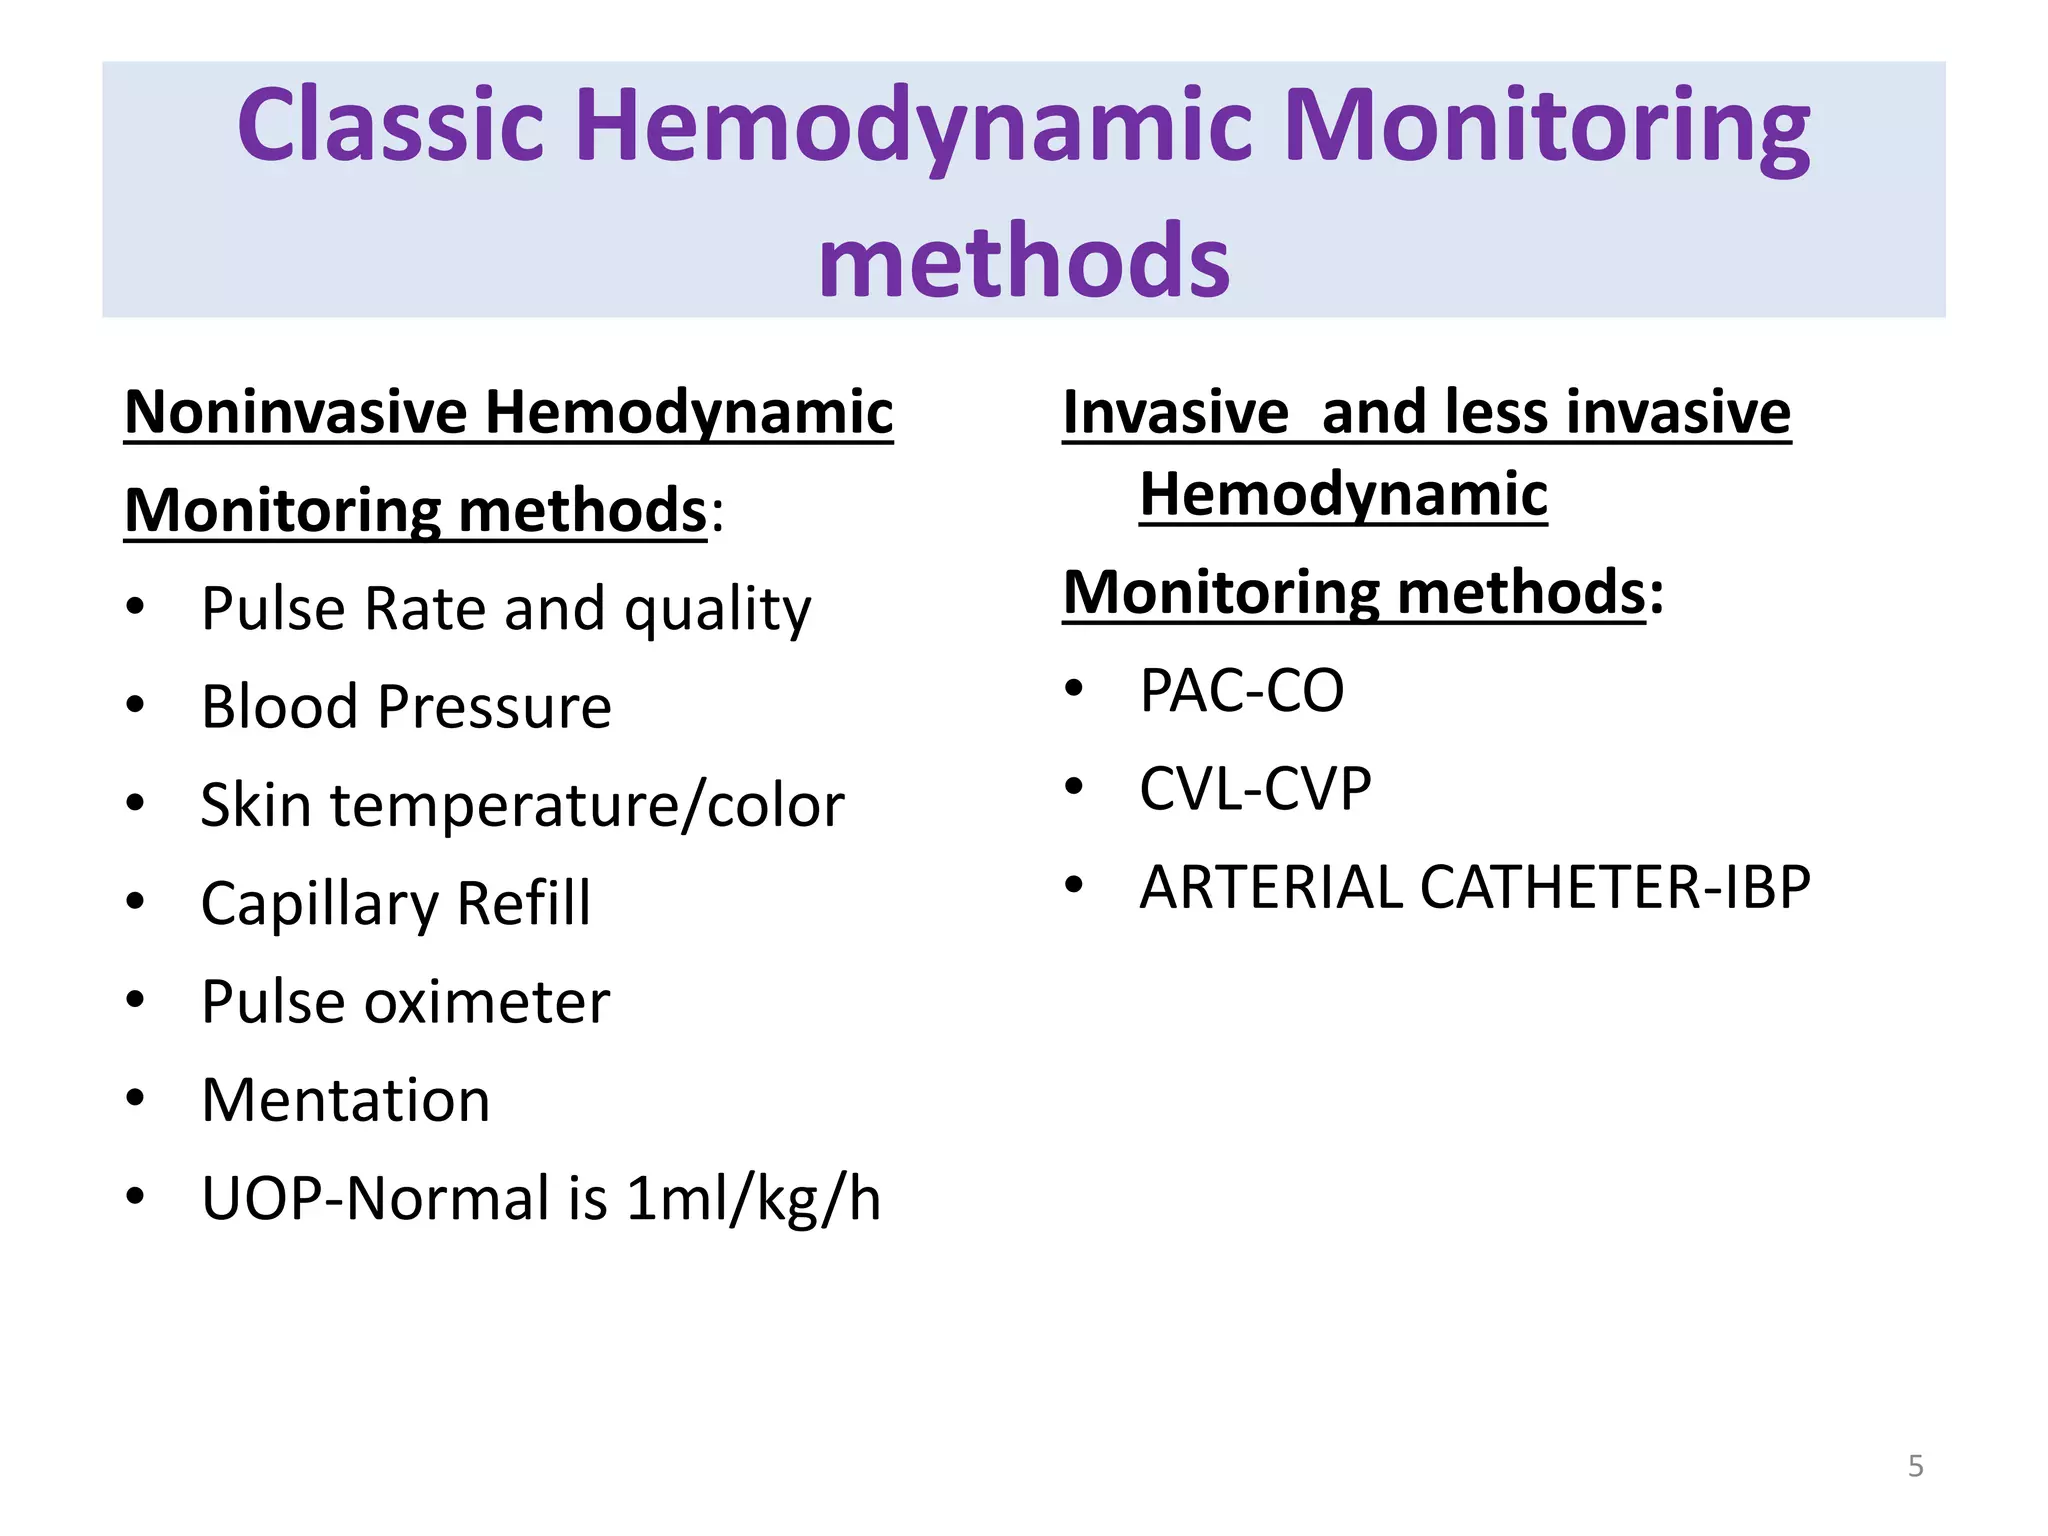
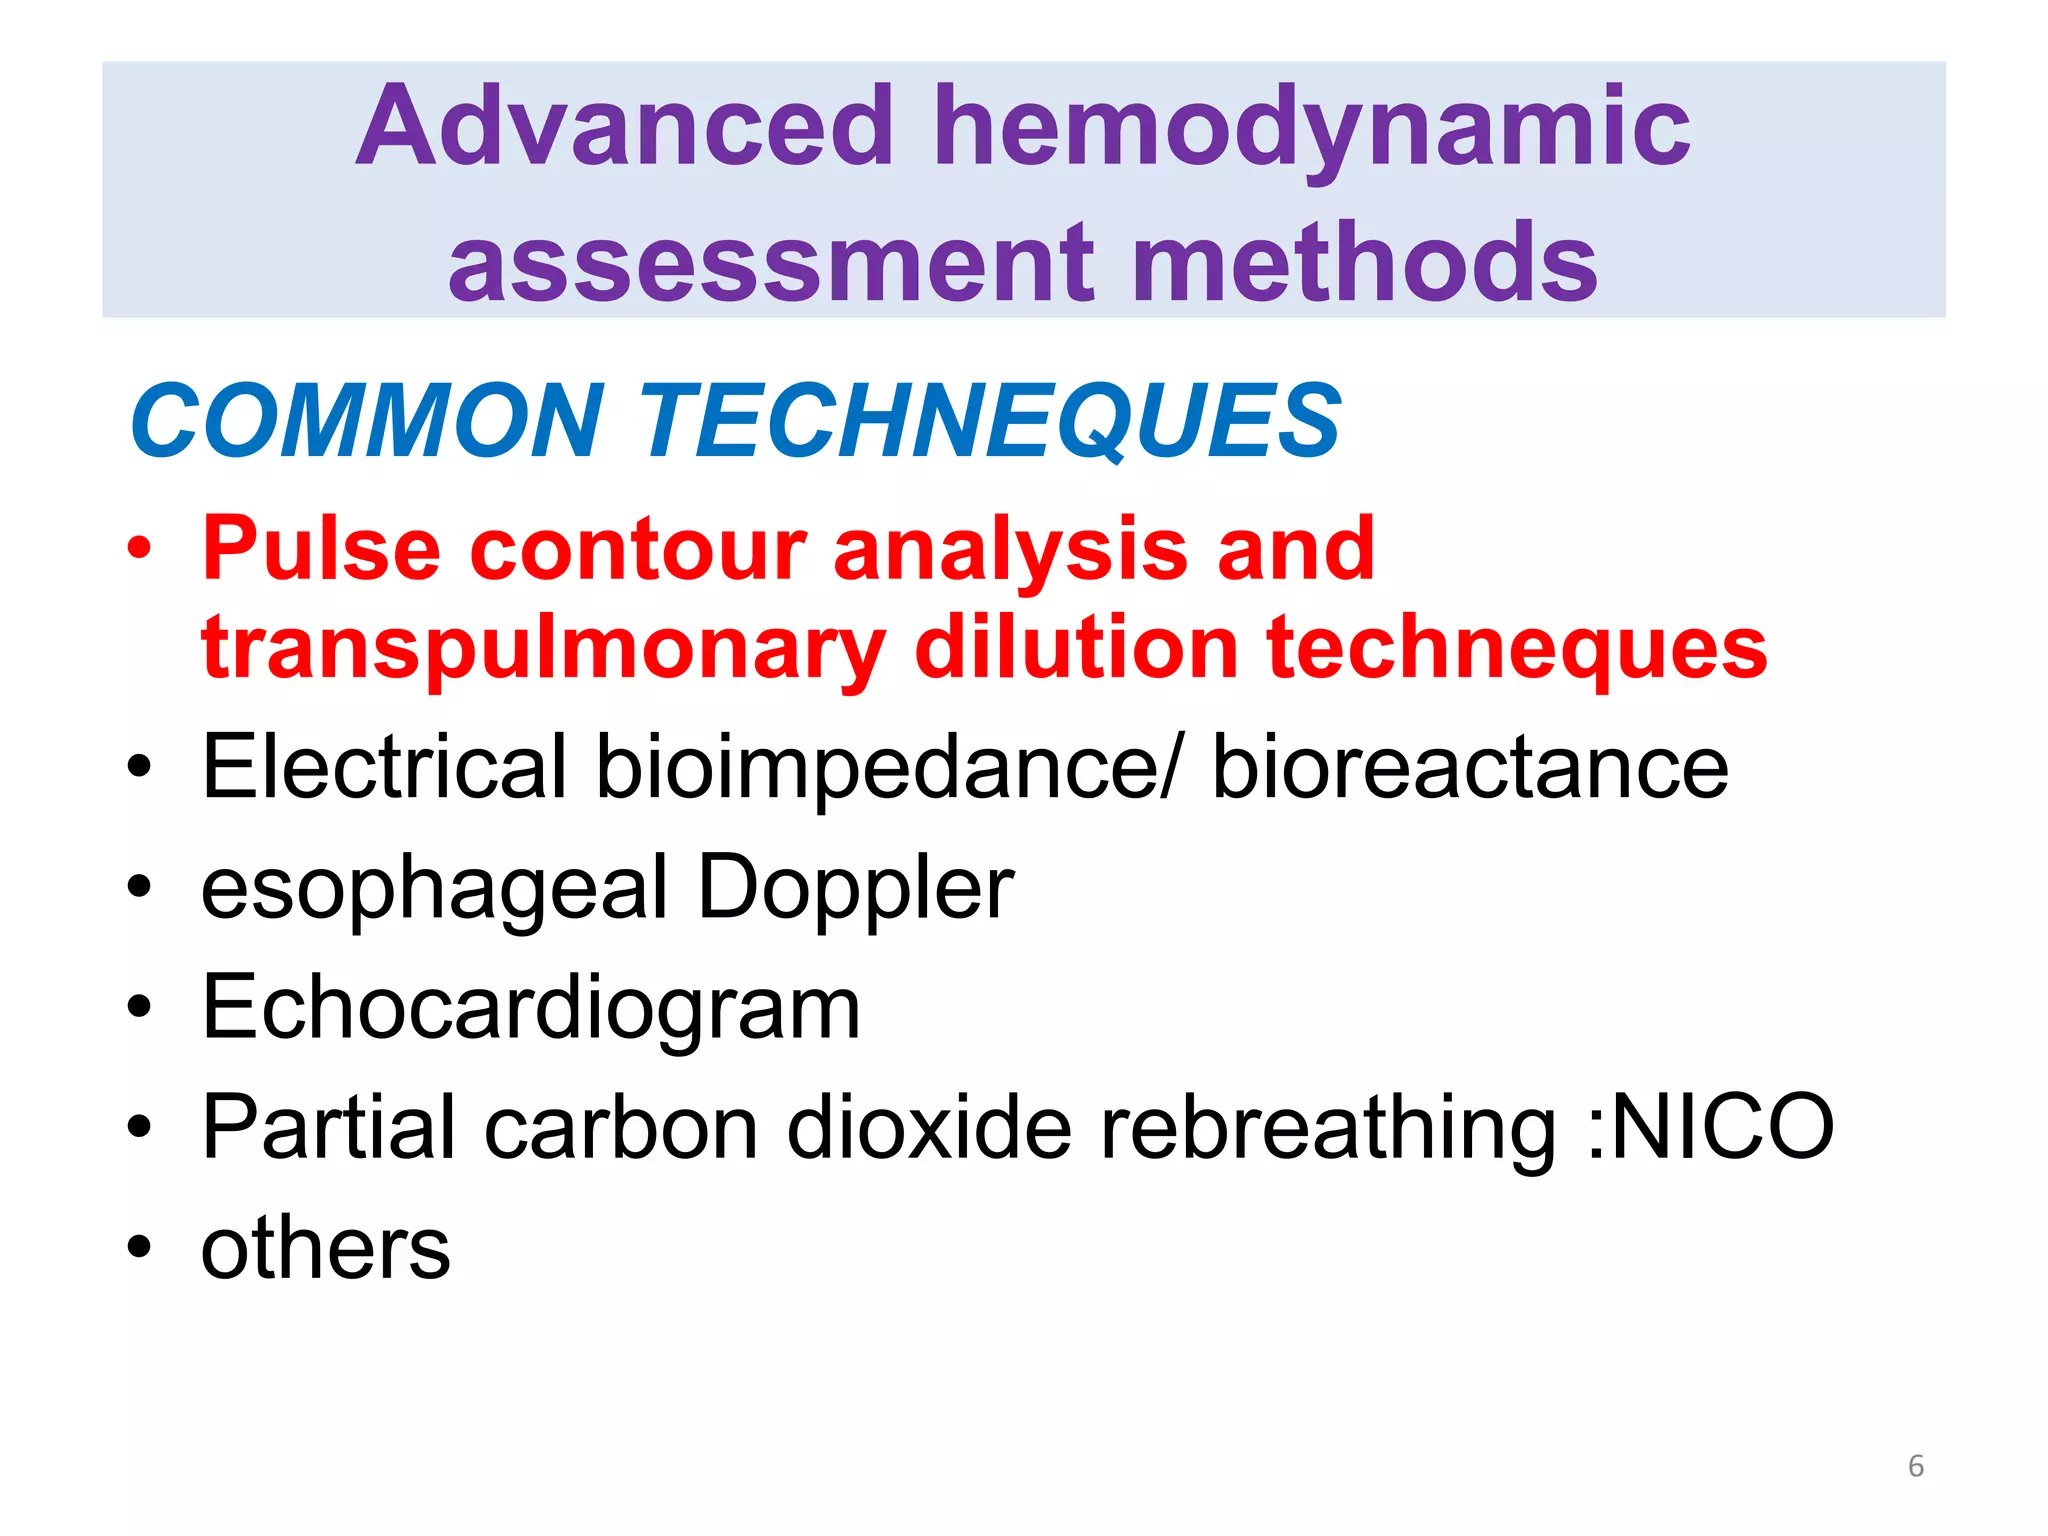
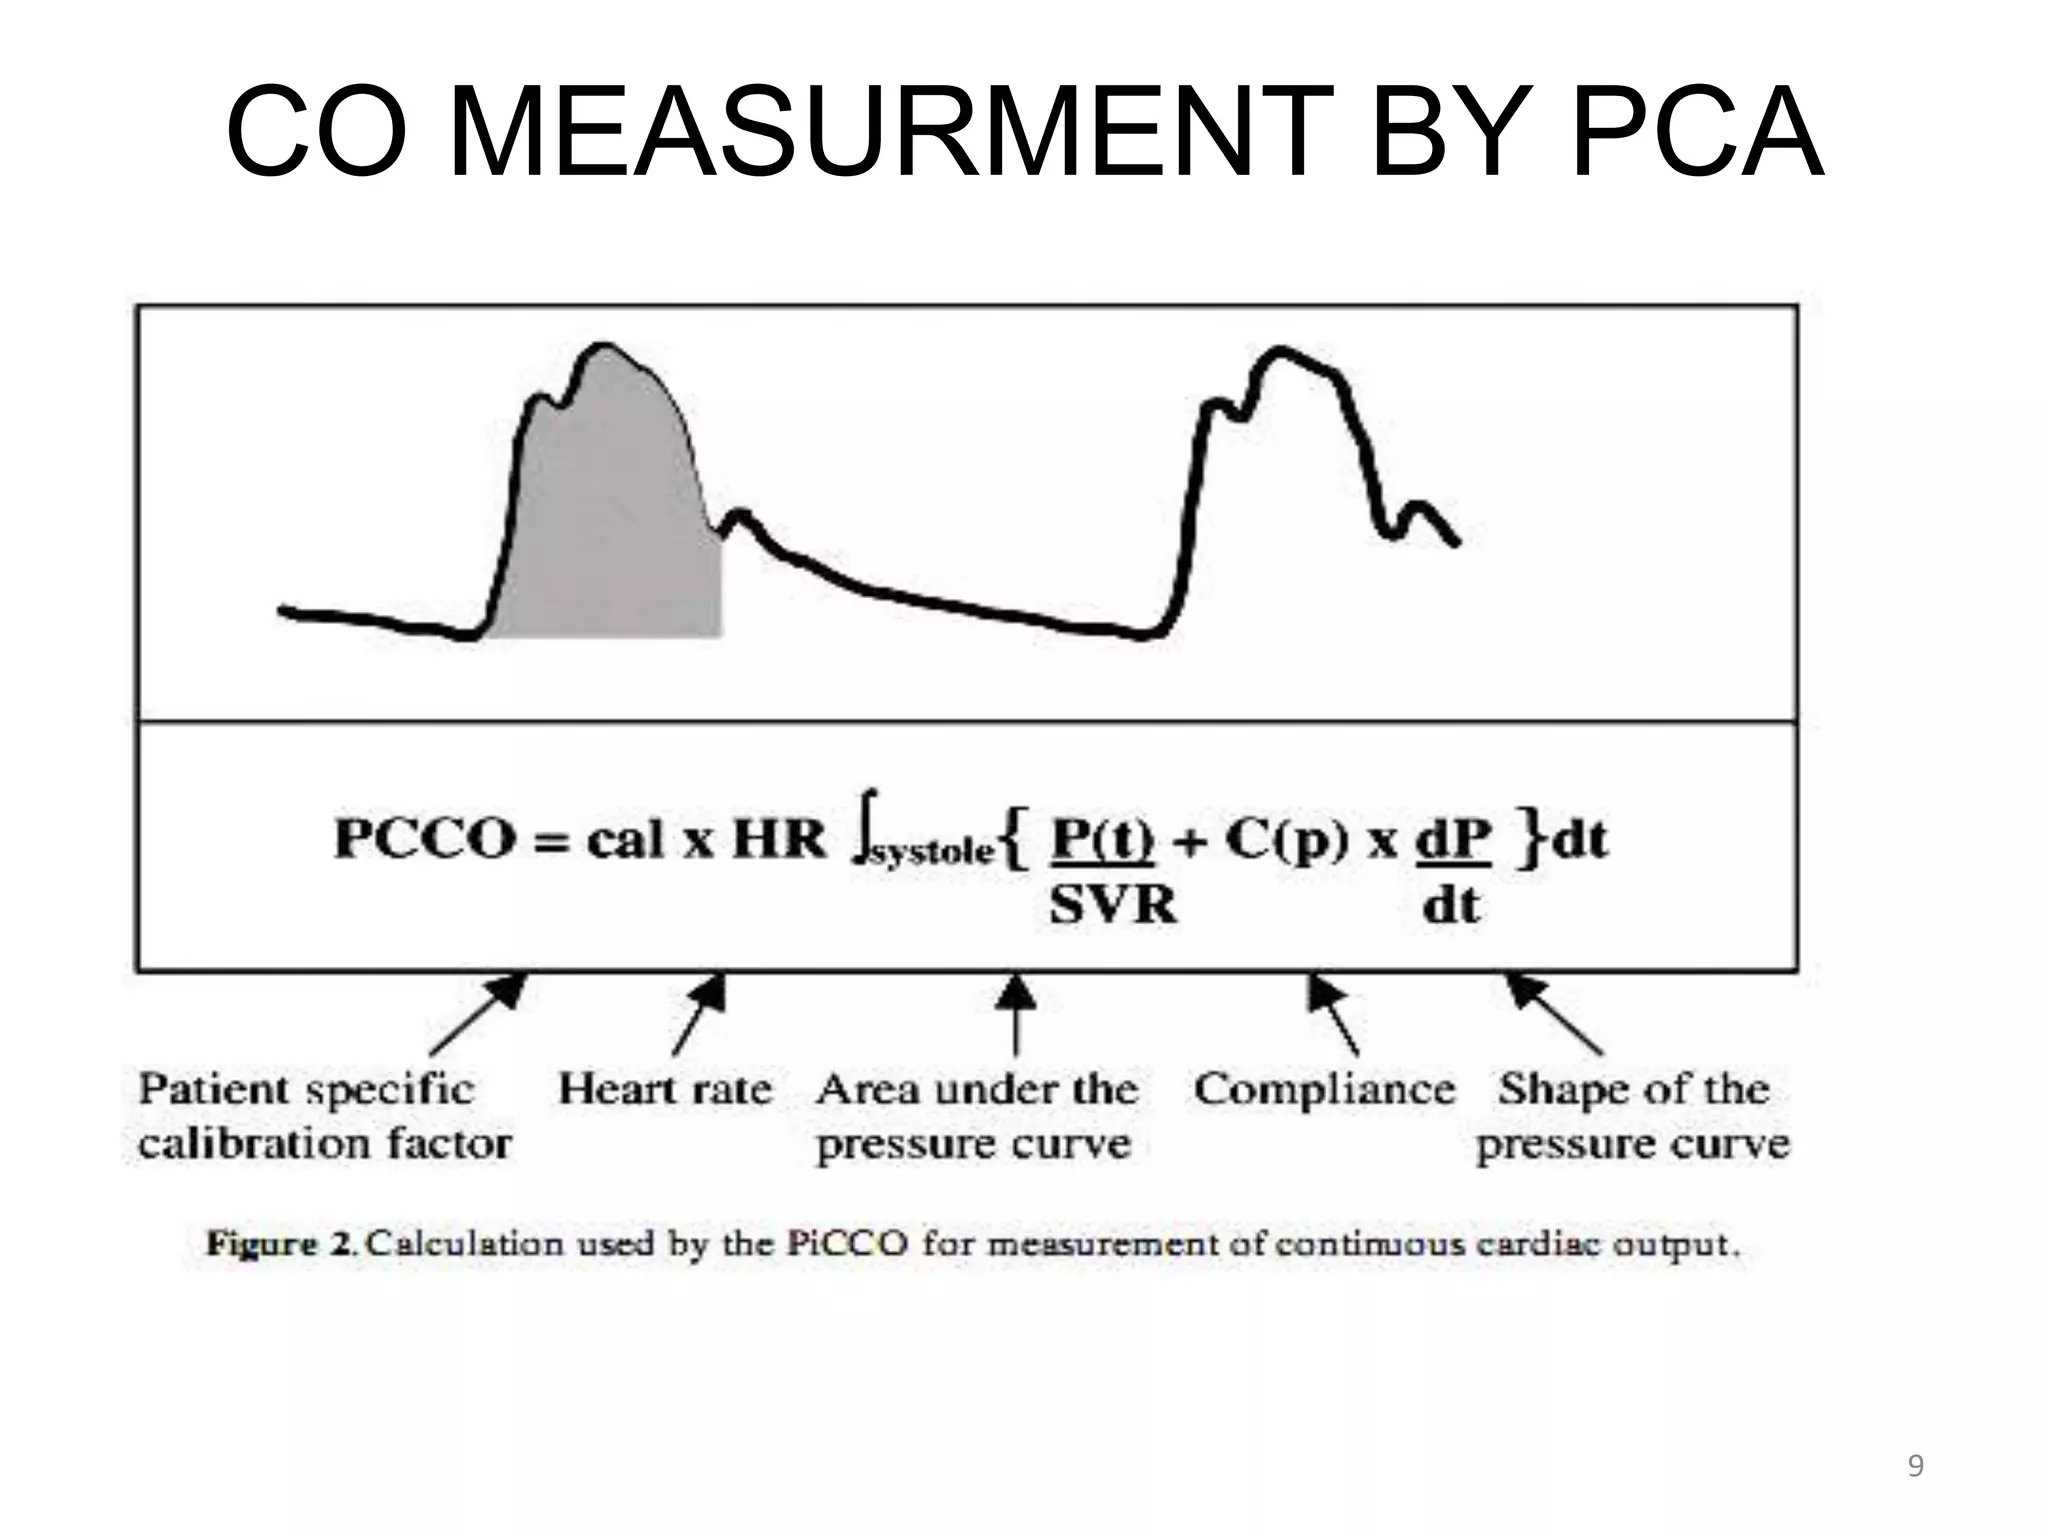
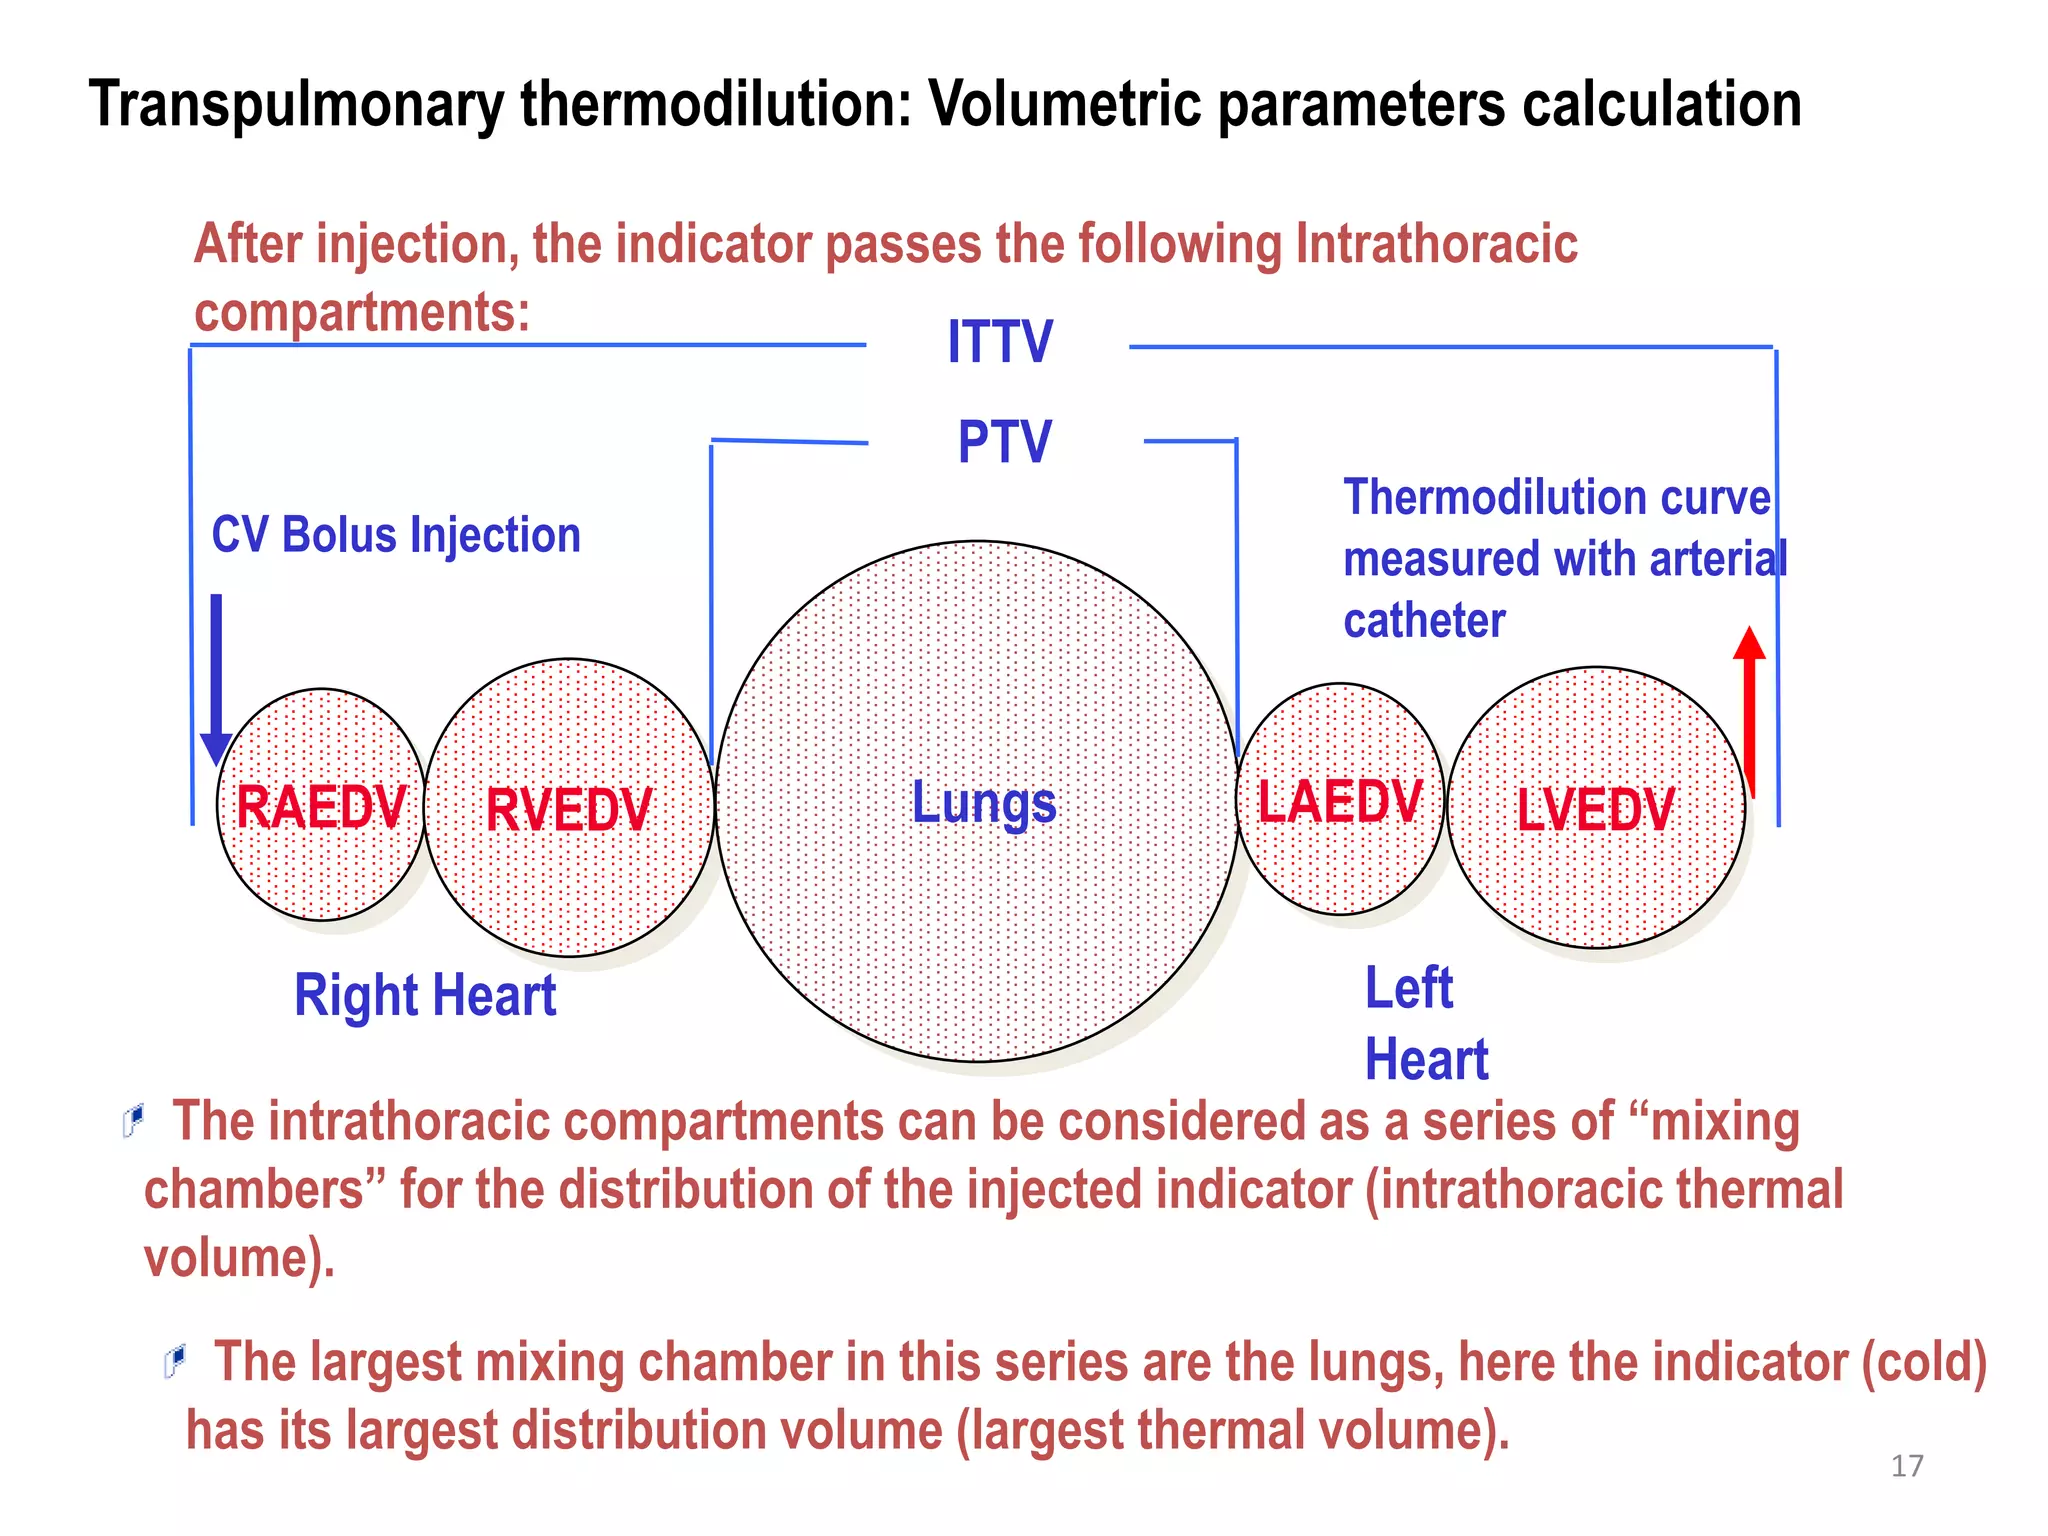
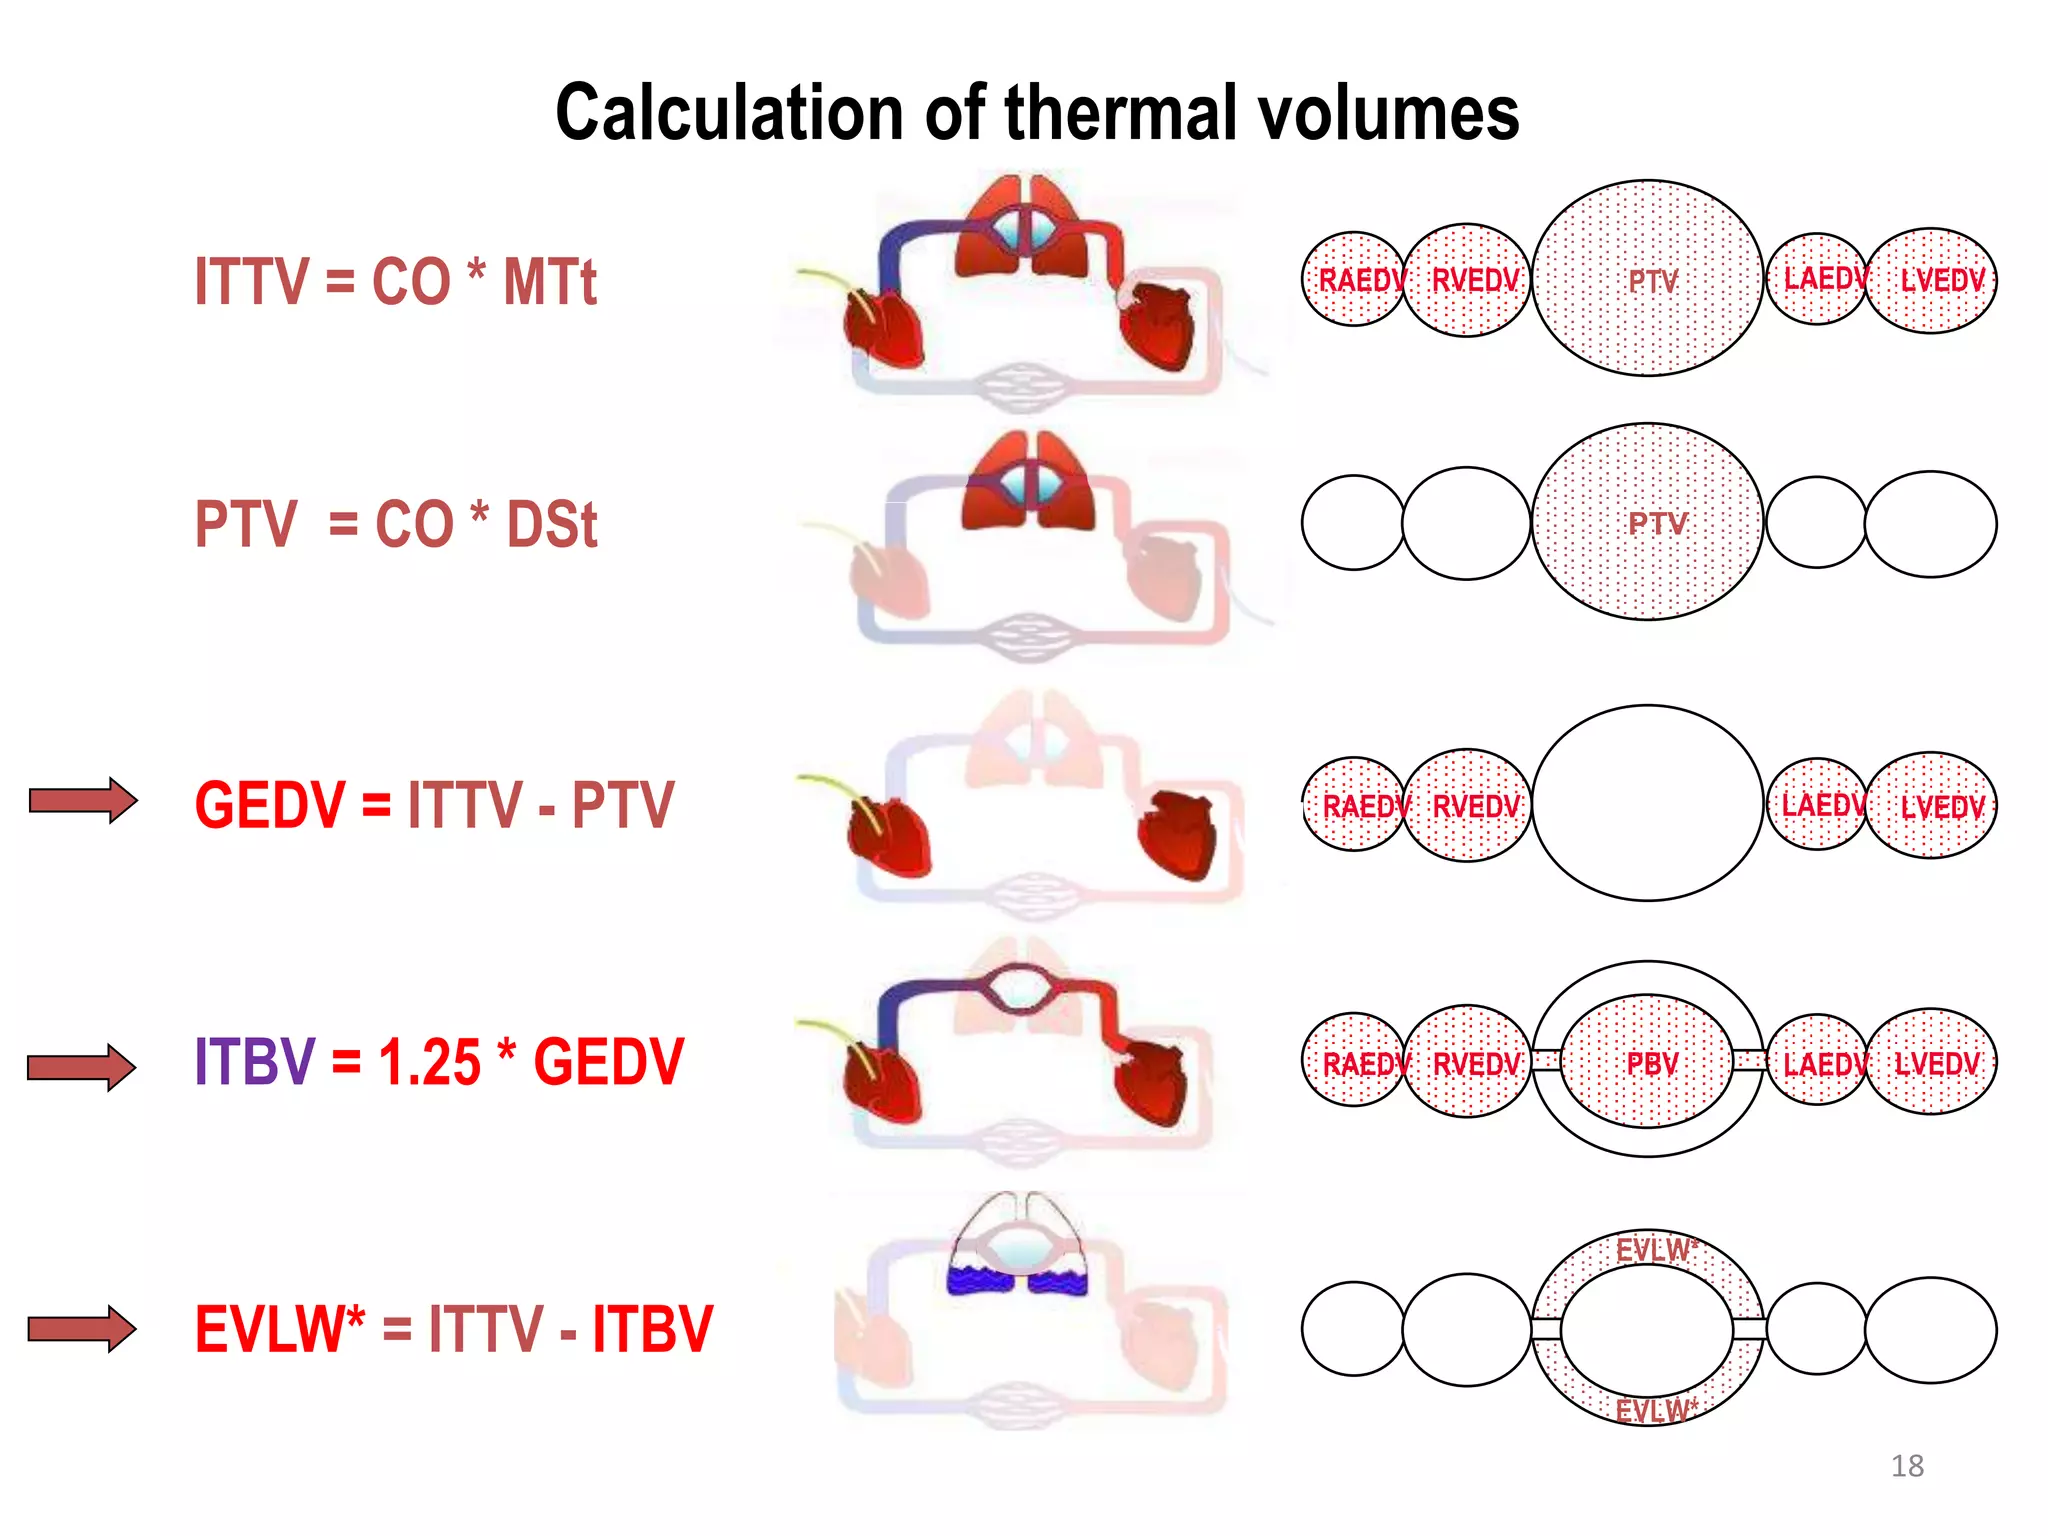
This document discusses less invasive methods of advanced hemodynamic monitoring. It begins by explaining the key factors that affect hemodynamic conditions like cardiac output, including heart rate, intravascular volume, myocardial contraction, and vasoactivity. It then discusses several noninvasive and invasive monitoring methods and focuses on pulse wave contour analysis and transpulmonary thermodilution techniques. These techniques can provide continuous cardiac output measurements along with volumetric parameters through advanced analysis of arterial pressure waveforms and thermal dilution curves. The document concludes by outlining typical values of parameters measured and providing an example decision tree for fluid and drug therapy guided by hemodynamic monitoring.


