Cardiac output monitoring provides important information about a patient's hemodynamic status. There are several invasive and non-invasive methods to measure cardiac output. Invasive methods include thermodilution, Fick method, lithium dilution. Thermodilution, using a pulmonary artery catheter, is considered the clinical gold standard but has fallen out of favor due to risks. Non-invasive options include esophageal Doppler, bioreactance, pulse contour analysis, and partial CO2 rebreathing. Choice of monitoring method depends on the patient's condition and goals of therapy.
Introduction to the presentation on cardiac output monitoring led by Dr. Pratheek Reddy and Dr. M. Madhu Chaitanya.
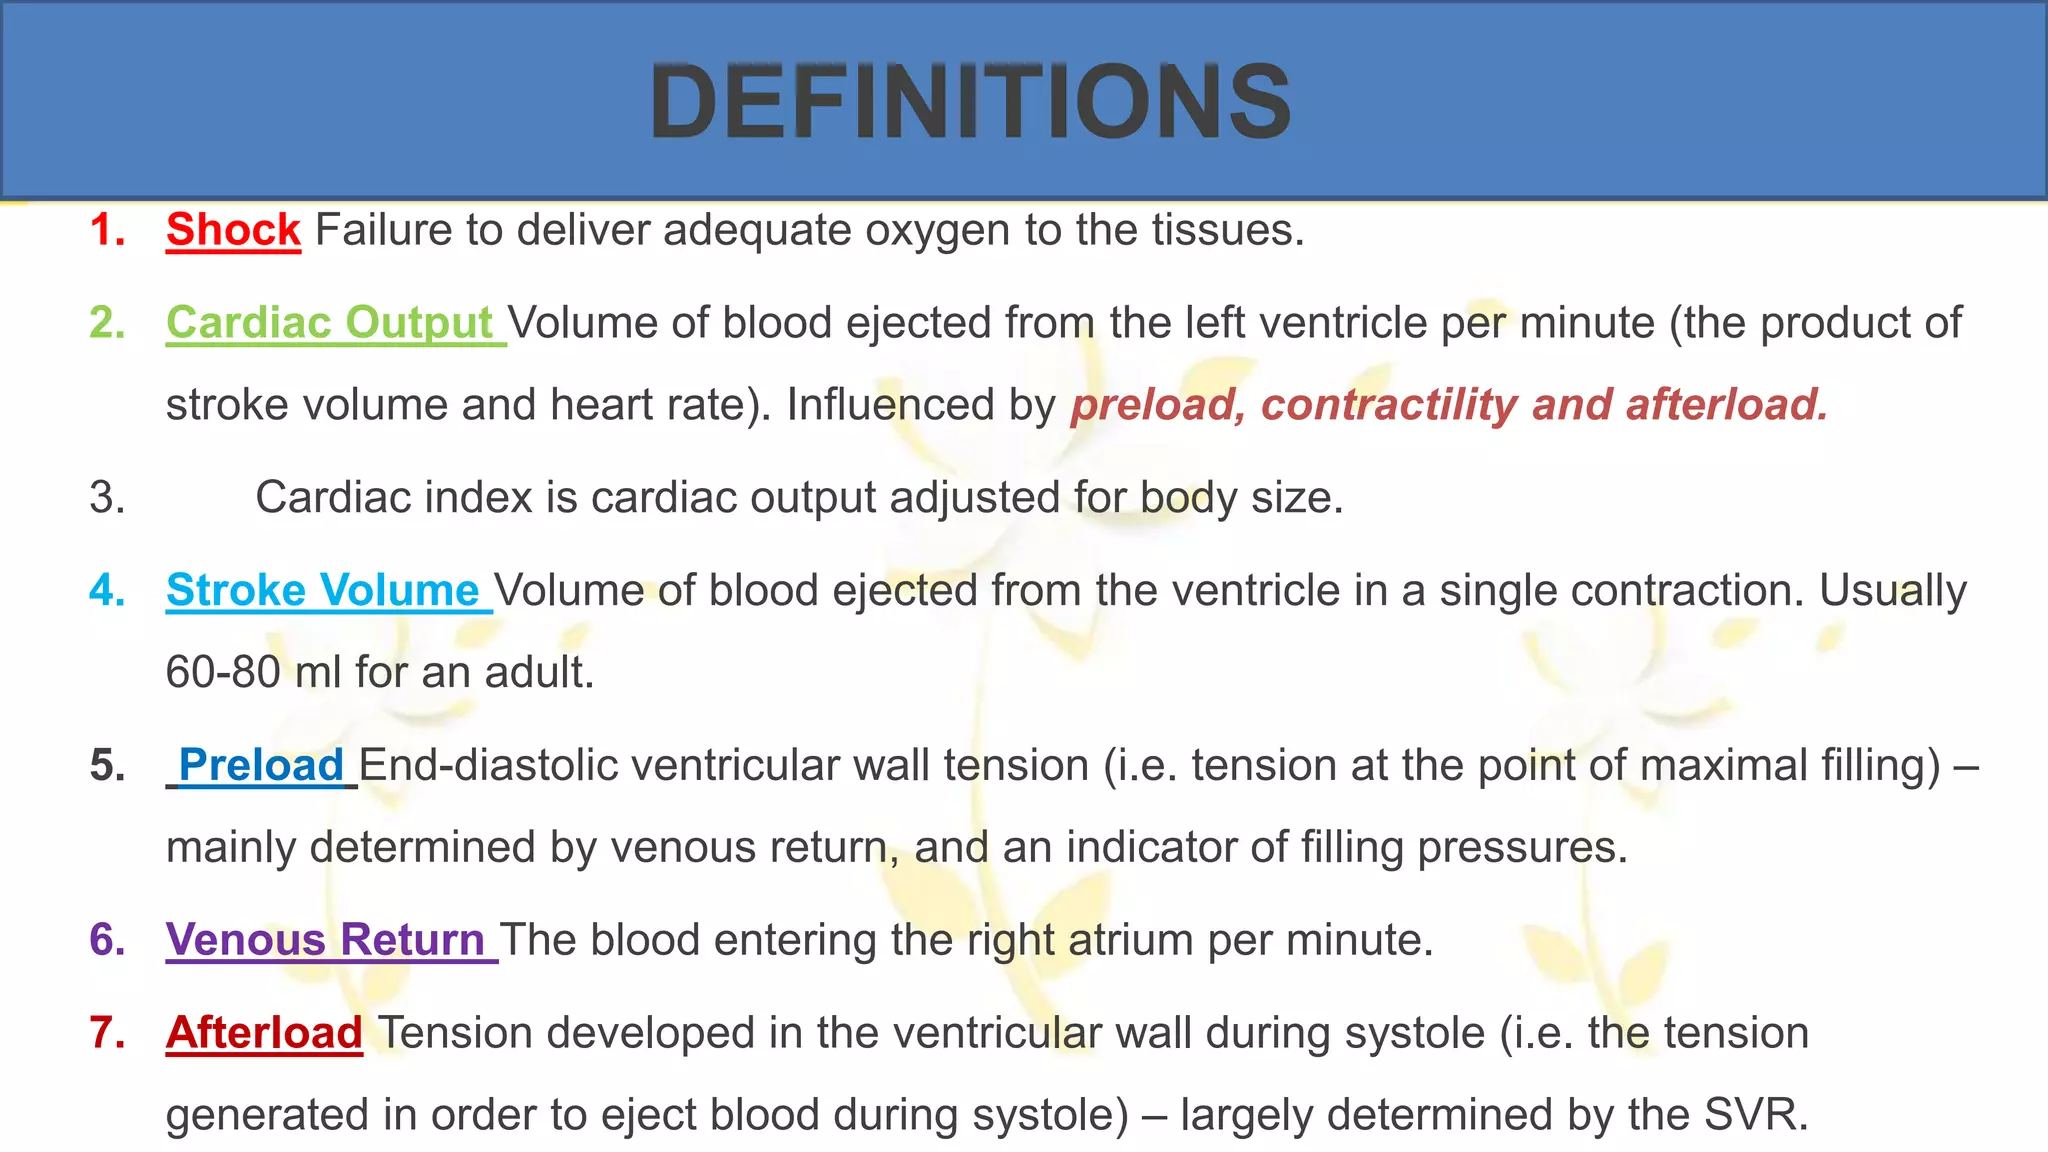
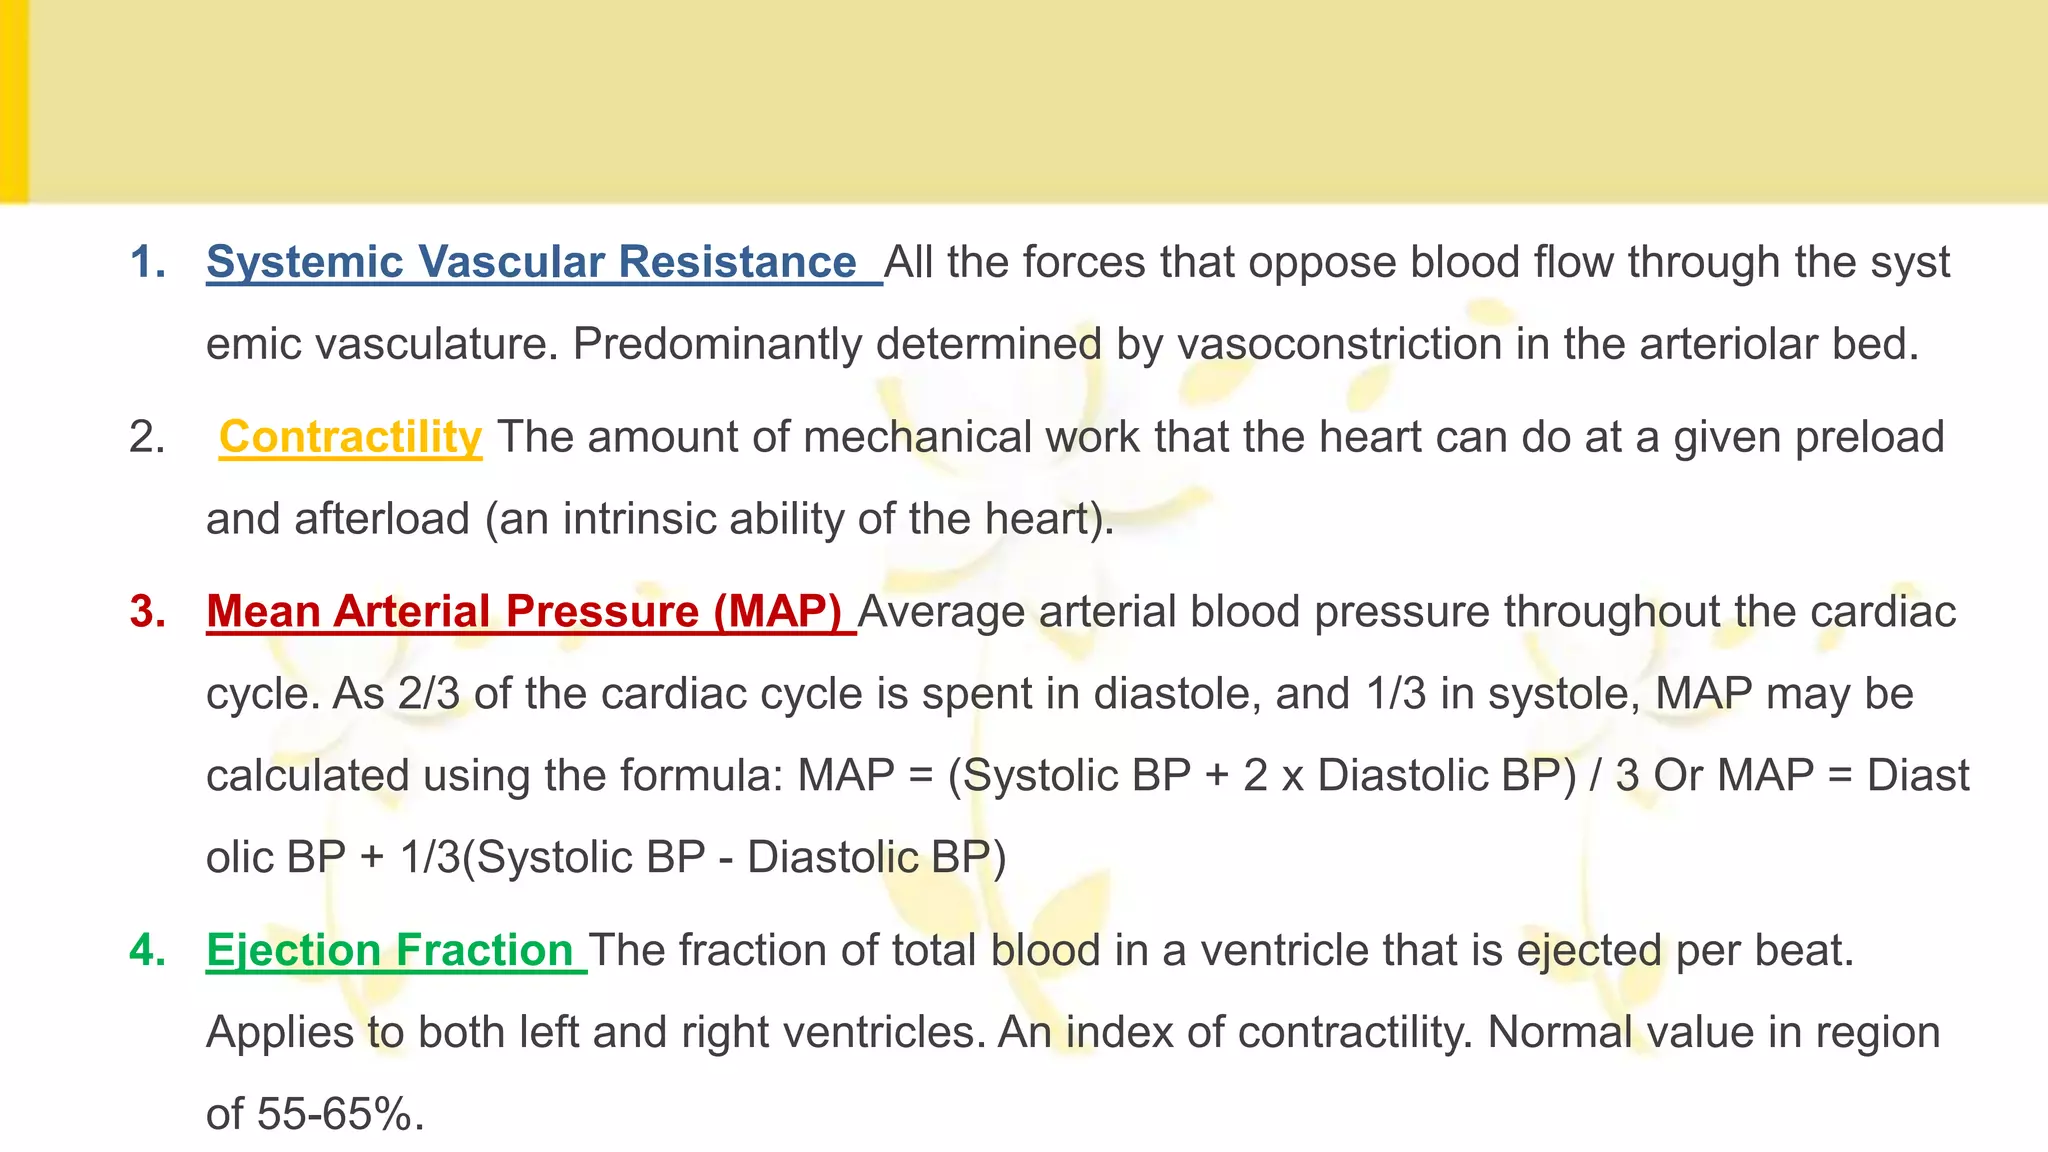
Key definitions include: Shock, Cardiac Output, Cardiac Index, Stroke Volume, Preload, Afterload, and Mean Arterial Pressure.
Clinical signs to assess cardiac output: skin color, temperature, capillary refill time, heart rate, urine output, and mental state.
Details on cardiac output significance for oxygen transport, clinical relevance in critically ill patients, and the necessity for accurate measurement.
Monitoring indications for high-risk surgical patients. Features of an ideal cardiac output monitor highlighted.
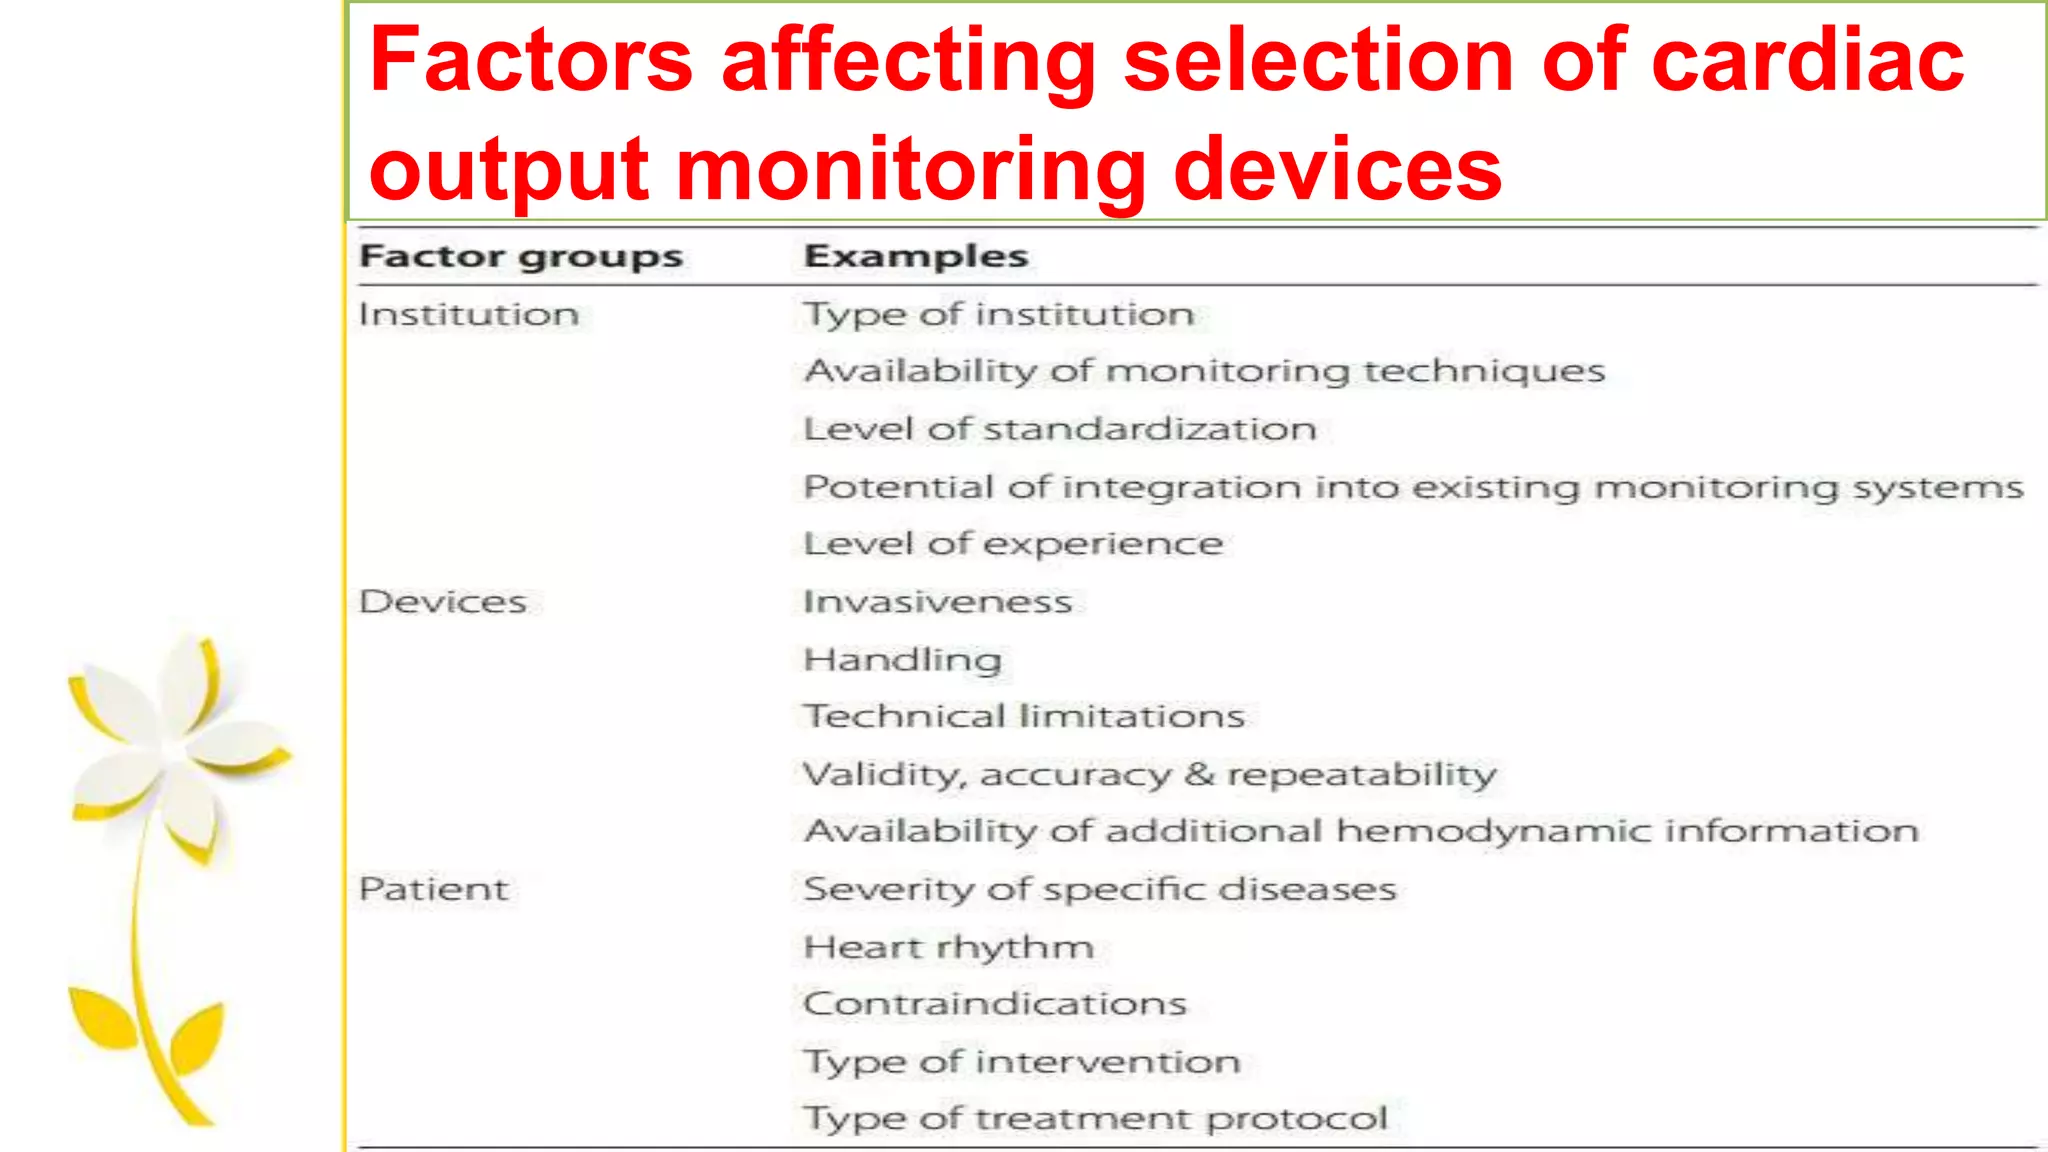
Factors affecting selection of cardiac output monitoring devices and simple methods to calculate cardiac output.
Overview of invasive (Fick's Method, Thermodilution) and non-invasive methods (Esophageal Doppler, Bioimpedance) for cardiac output measurement.
Introduction to pulmonary artery catheters and their features, developed for monitoring patients with acute myocardial infarction.
Waveforms produced by PAC used for monitoring various pressures in the right atrium and pulmonary artery.
Explanation of Fick Method as a gold standard for cardiac output measurements, its principle, and limitations.
Intermittent and continuous thermodilution methods for cardiac output monitoring and their applications.
Discussion on continuous thermodilution vs. intermittent measurement, advantages of continuous monitoring.Transpulmonary thermodilution, lithium dilution, and how these methods apply to monitoring cardiac output.
Details of esophageal doppler technique for cardiac output monitoring, its advantages, disadvantages, and use cases.
Other methods for cardiac output monitoring including bioimpedance, partial CO2 rebreathing, pulse contour, and gastric tonometry.
DEFINITIONS
1. Shock Failureto deliver adequate oxygen to the tissues.
2. Cardiac Output Volume of blood ejected from the left ventricle per minute (the product of
stroke volume and heart rate). Influenced by preload, contractility and afterload.
3. Cardiac index is cardiac output adjusted for body size.
4. Stroke Volume Volume of blood ejected from the ventricle in a single contraction. Usually
60-80 ml for an adult.
5. Preload End-diastolic ventricular wall tension (i.e. tension at the point of maximal filling) –
mainly determined by venous return, and an indicator of filling pressures.
6. Venous Return The blood entering the right atrium per minute.
7. Afterload Tension developed in the ventricular wall during systole (i.e. the tension
generated in order to eject blood during systole) – largely determined by the SVR.
3.
1. Systemic VascularResistance All the forces that oppose blood flow through the syst
emic vasculature. Predominantly determined by vasoconstriction in the arteriolar bed.
2. Contractility The amount of mechanical work that the heart can do at a given preload
and afterload (an intrinsic ability of the heart).
3. Mean Arterial Pressure (MAP) Average arterial blood pressure throughout the cardiac
cycle. As 2/3 of the cardiac cycle is spent in diastole, and 1/3 in systole, MAP may be
calculated using the formula: MAP = (Systolic BP + 2 x Diastolic BP) / 3 Or MAP = Diast
olic BP + 1/3(Systolic BP - Diastolic BP)
4. Ejection Fraction The fraction of total blood in a ventricle that is ejected per beat.
Applies to both left and right ventricles. An index of contractility. Normal value in region
of 55-65%.
4.
CLINICAL INDICATORS OFCARDIAC
OUTPUT
Clinical signs include:
1. Skin colour
2. Skin temperature, and core-peripheral temperature
difference
3. Capillary Refill Time
4. Heart Rate
5. Urine Output
6. Mental State
5.
Cardiac output isthe volume of blood pumped by the heart per minute and is the
product of the heart rate and stroke volume
• It is the determinant of global oxygen transport to the body
• It reflects the efficiency of cardiovascular system
• There no absolute value for cardiac output measurement
Cardiacoutput
6.
CardiacOutput Measurement
AIM :Hemodynamic monitoring and support in the critically ill
so as to optimize oxygen delivery to the tissues.
• Oxygen delivery is determined by Cardiac Output and
amount of oxygen carried in the blood.
• Allows us to assess the blood flow to the tissues, and
provides information on how to best support a failing
circulation.
7.
Why shouldwe measure?
1.Therecognition that in many critically ill patients, low cardiac
output leads to significant morbidity and mortality.
2.The clinical assessment of cardiac output is unreliable/
inaccurate.
8.
When shouldwe monitor?
•High risk critically ill surgical patients in whom large fluid shifts
are expected along with bleeding and hemodynamic instability.
• An important component of goal directed therapy (GDT), i.e.,
when a monitor is used in conjunction with administration of fluids
and vasopressors to achieve set therapeutic endpoints thereby
improving patient care and outcome.
9.
Featuresof anideal CardiacOutput
monitor
1.Safe and accurate
2. Quick and easy to use both in terms of
set-up and interpretation of information
3. Operator independent i.e. the skill of the operator
doesn’t affect the information collected
4. Provide continuous measurement
5. Reliable during various physiological states
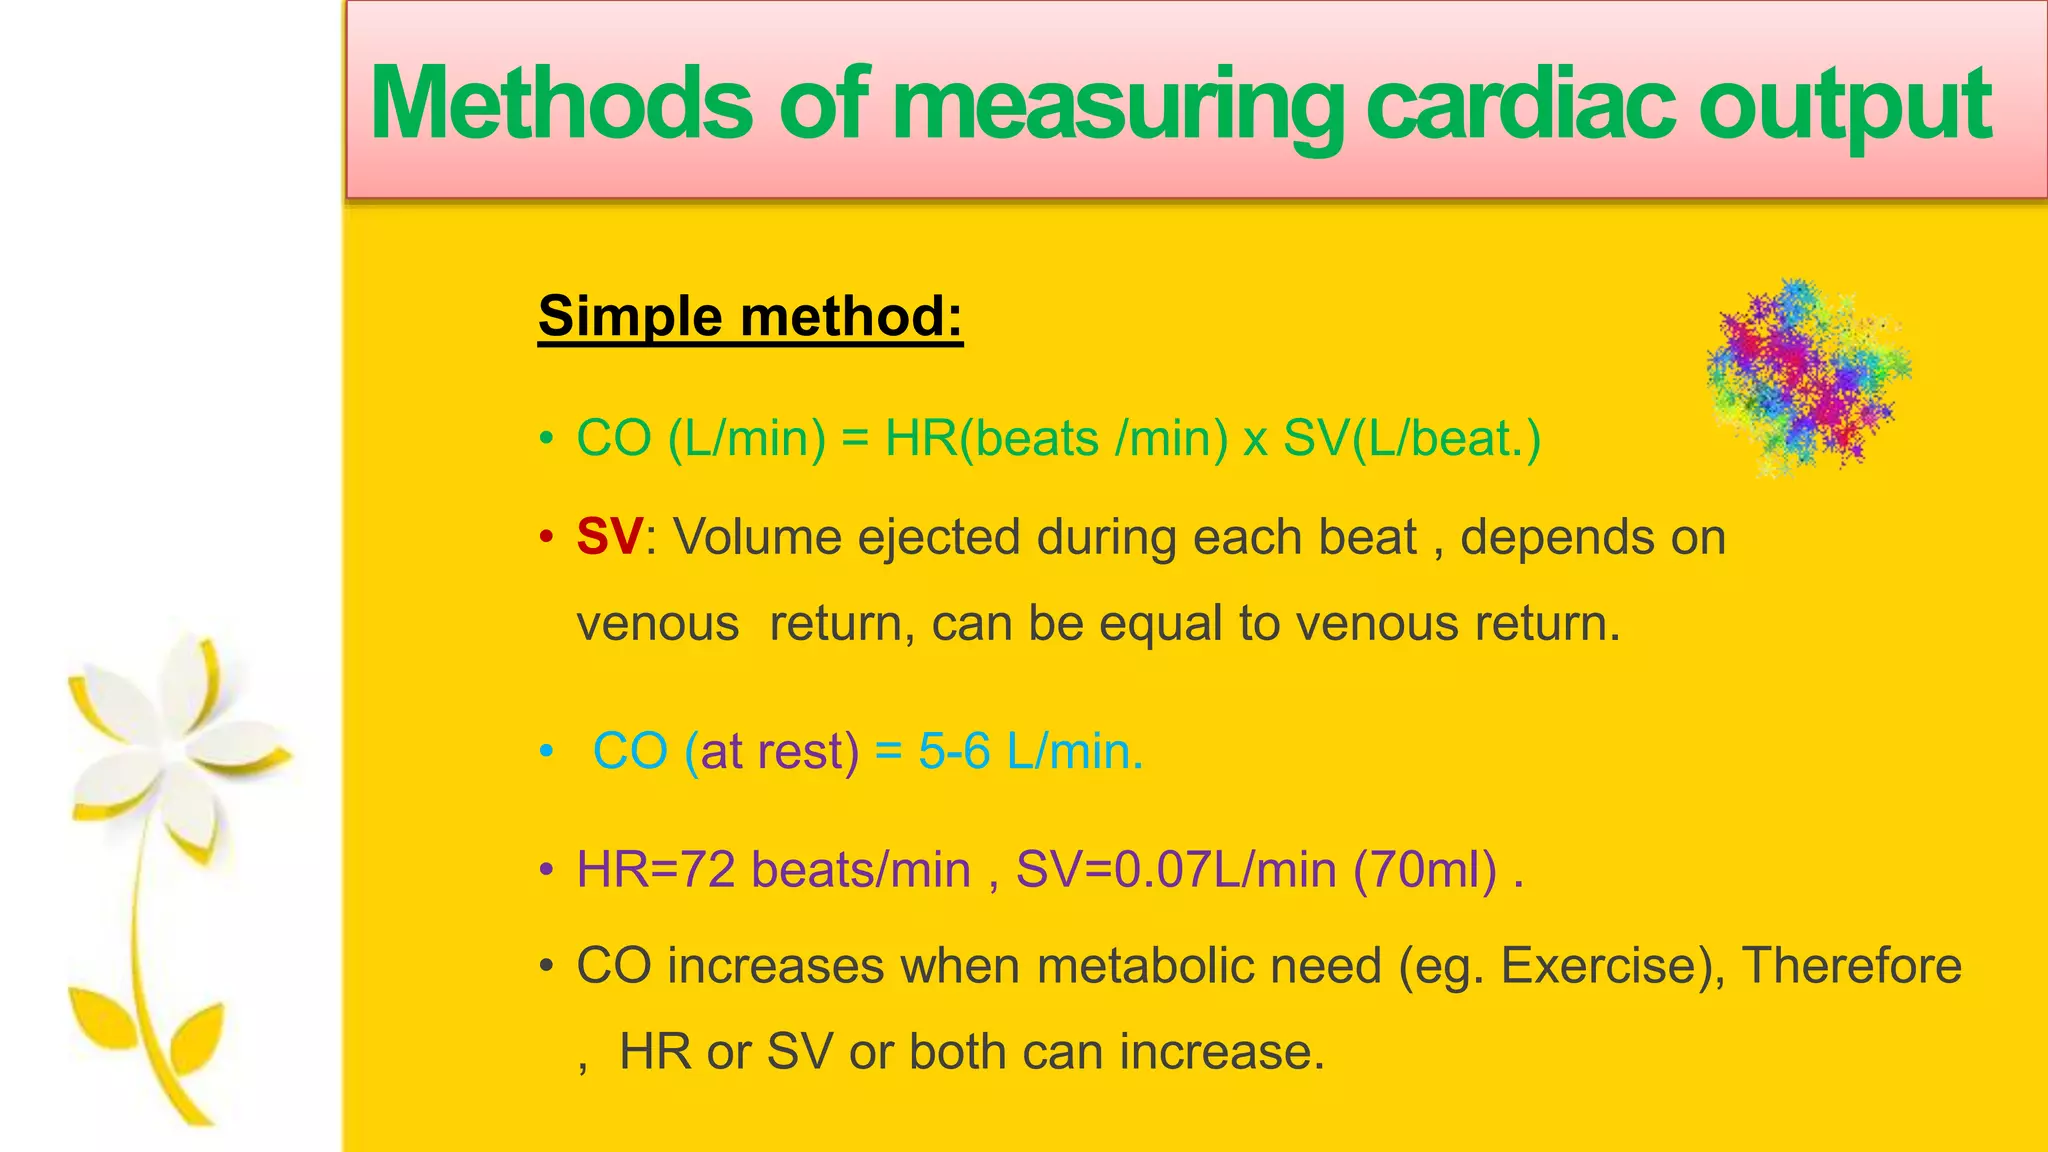
Methods of measuringcardiacoutput
Simple method:
• CO (L/min) = HR(beats /min) x SV(L/beat.)
• SV: Volume ejected during each beat , depends on
venous return, can be equal to venous return.
• CO (at rest) = 5-6 L/min.
• HR=72 beats/min , SV=0.07L/min (70ml) .
• CO increases when metabolic need (eg. Exercise), Therefore
, HR or SV or both can increase.
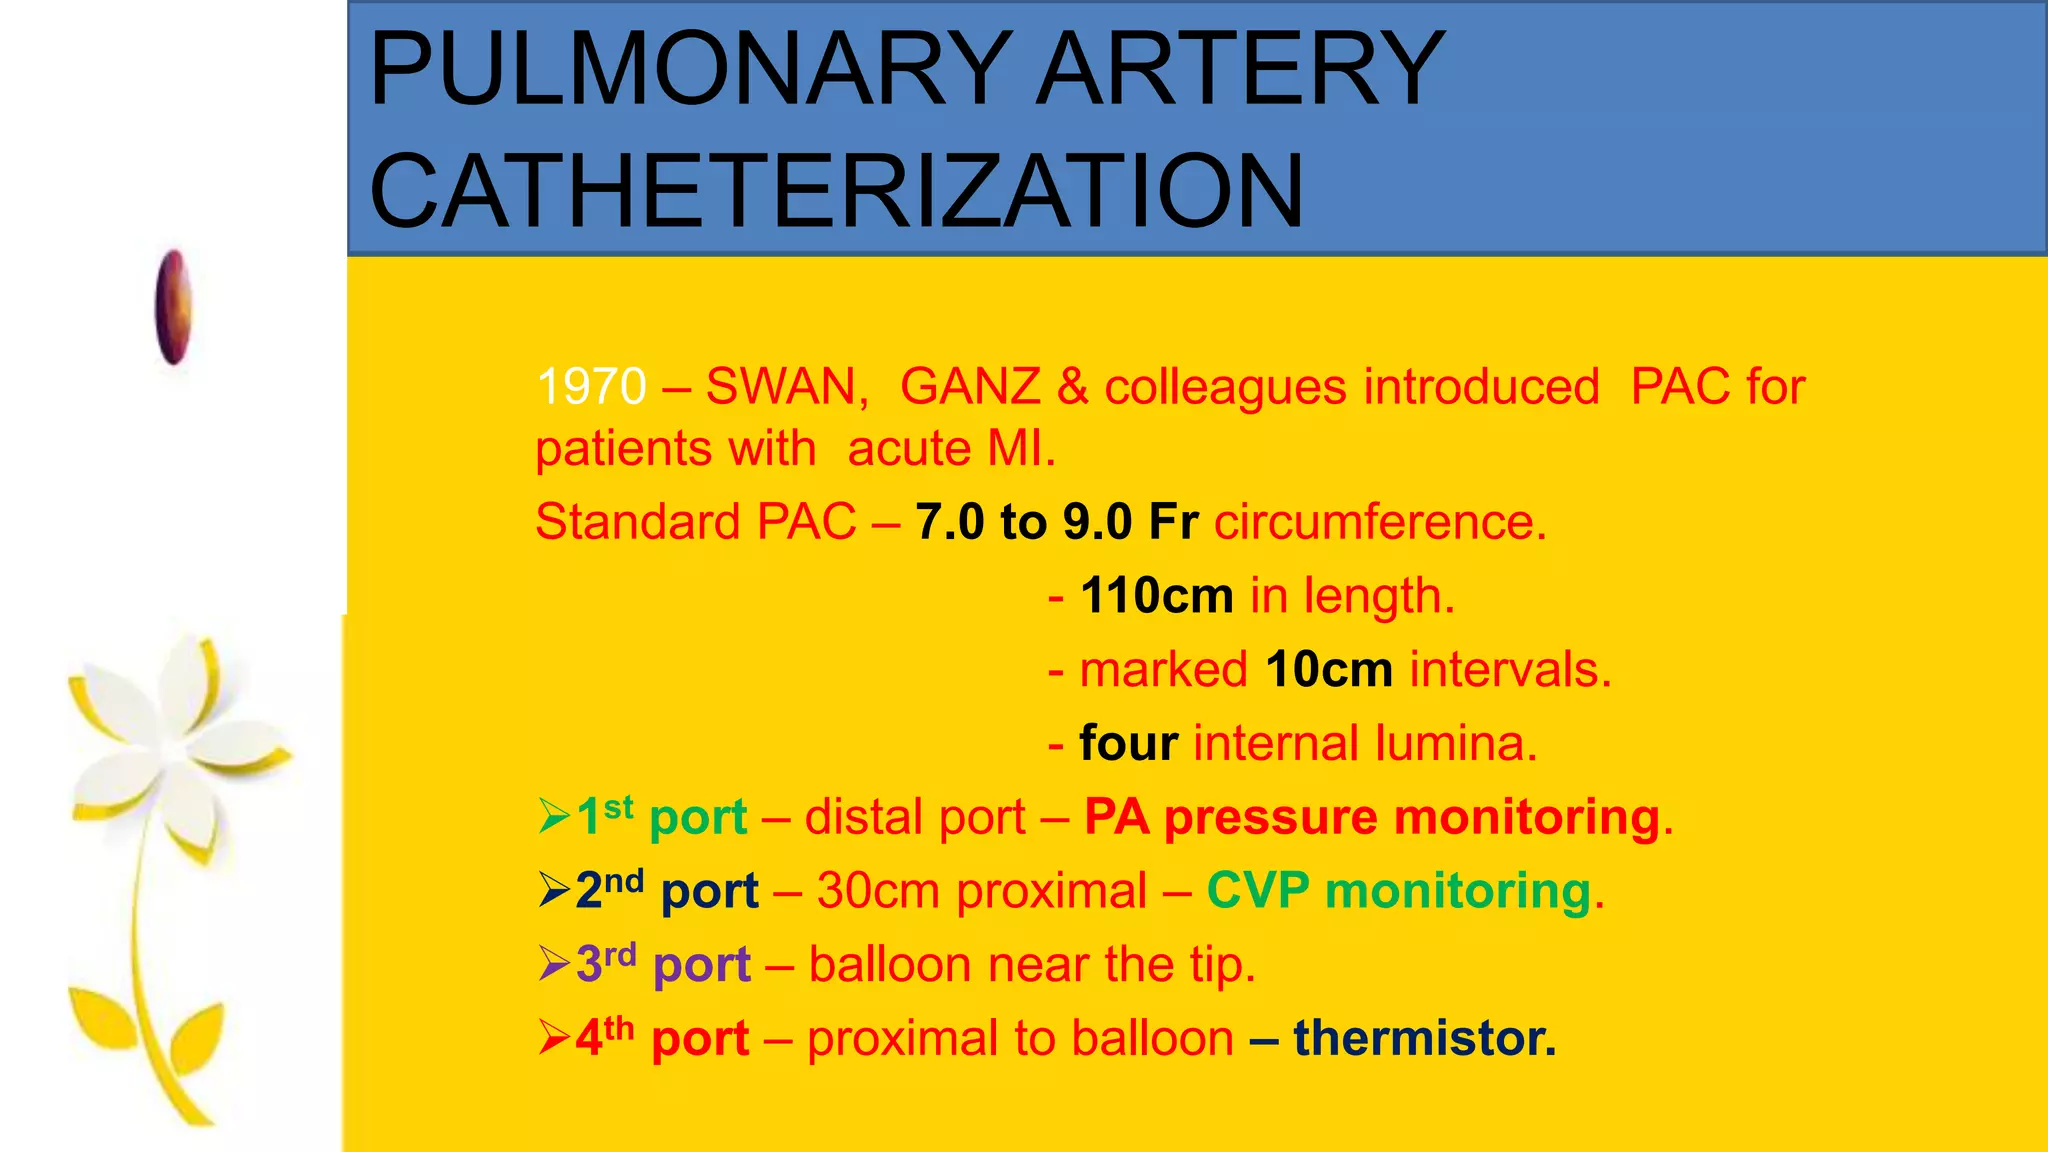
PULMONARY ARTERY
CATHETERIZATION
1970 –SWAN, GANZ & colleagues introduced PAC for
patients with acute MI.
Standard PAC – 7.0 to 9.0 Fr circumference.
- 110cm in length.
- marked 10cm intervals.
- four internal lumina.
1st port – distal port – PA pressure monitoring.
2nd port – 30cm proximal – CVP monitoring.
3rd port – balloon near the tip.
4th port – proximal to balloon – thermistor.
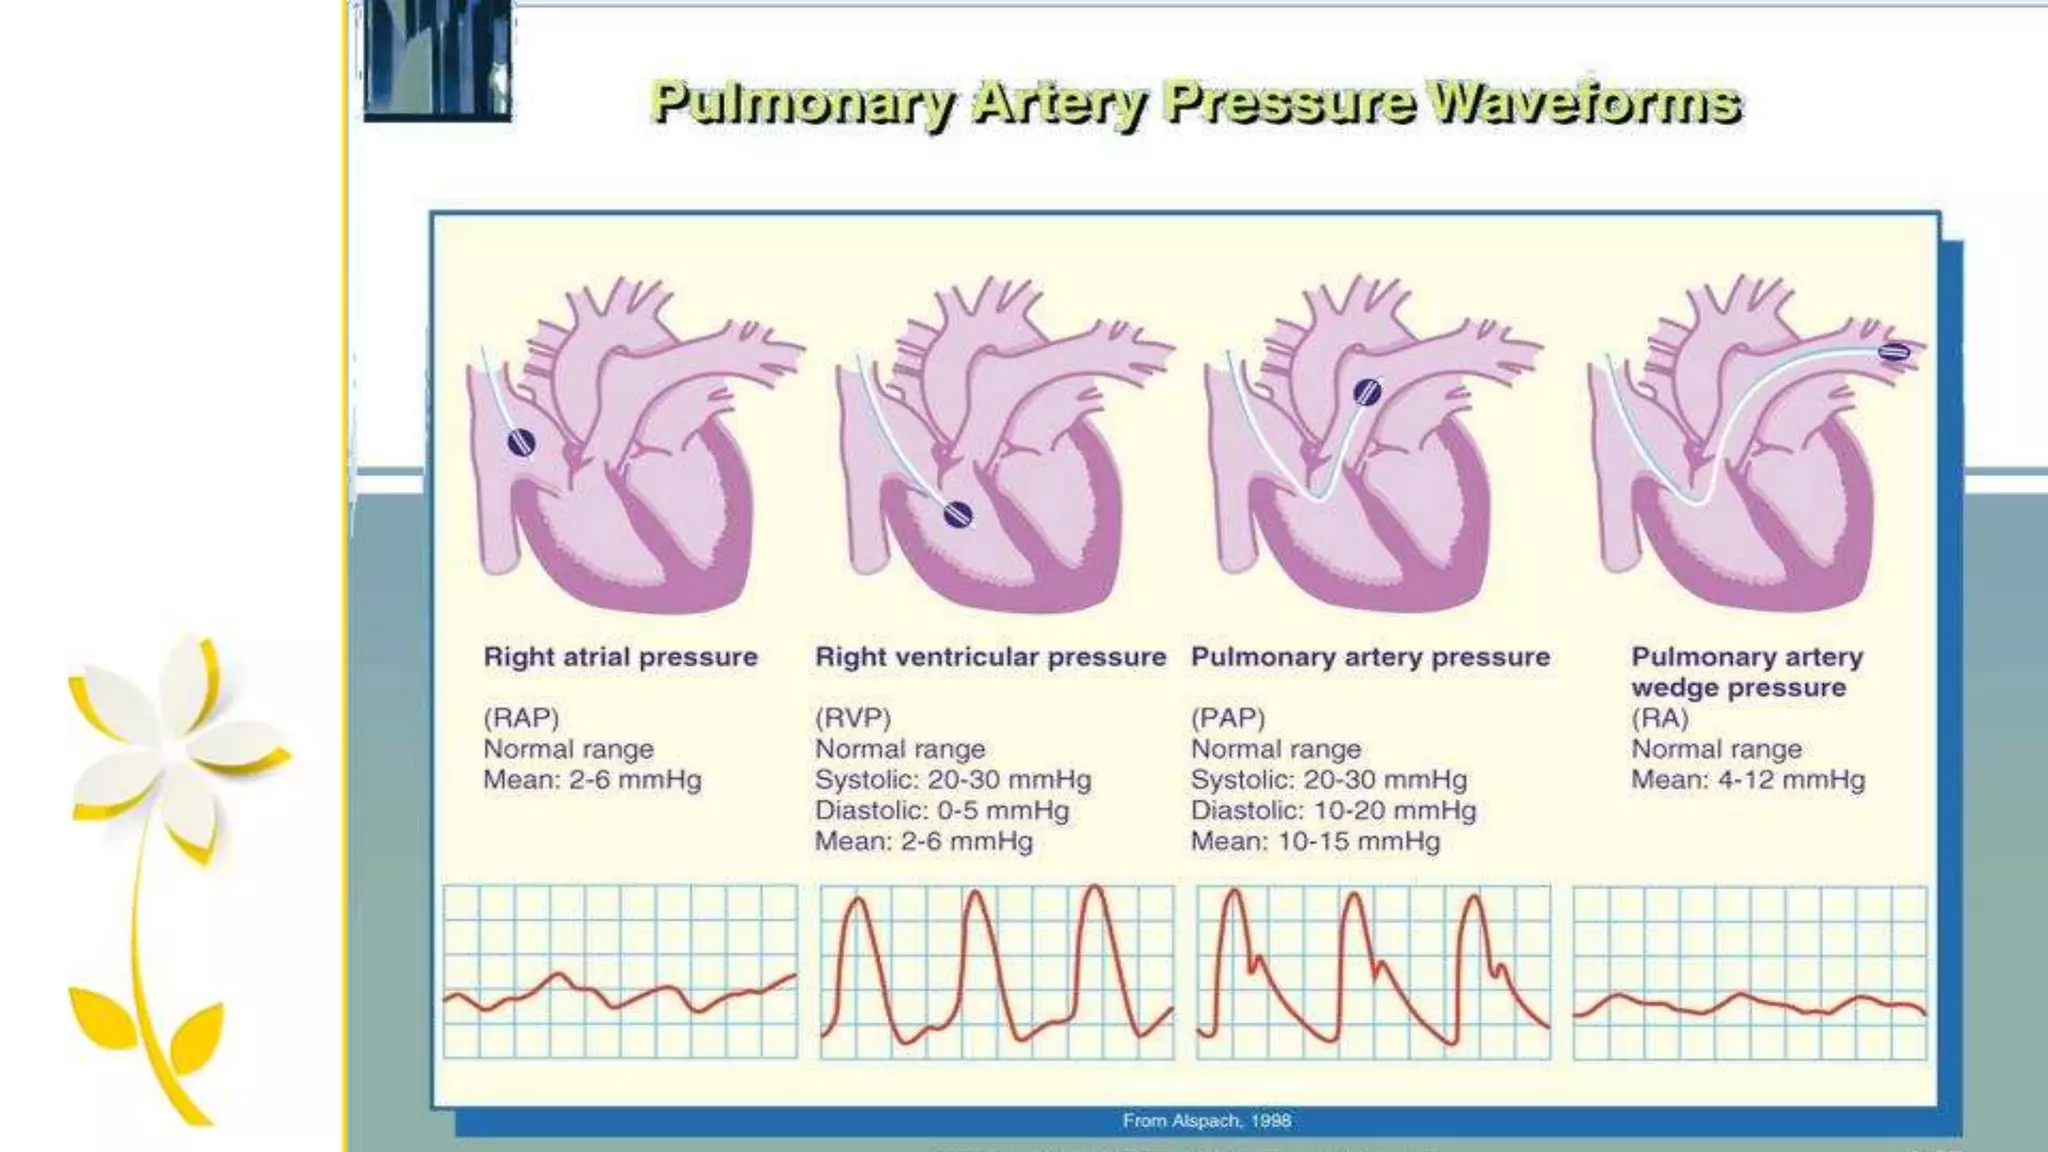
PA CATHETERIZATION :waveforms
Right atrial pressure
Rt. Ventricular pressure
PA pressure
PA wedge pressure
Resembles CVP waveforms,
Displays a, c & v waves.
Shows higher systolic pressure
than RA, end-diastolic pressures
are equal in these 2 chambers
Shows distolic step-up compar
ed with ventricular pressure
Shows similar morphology to
right atrial pressure but a,c ,v
waves appears late in cardiac
cycle. 15
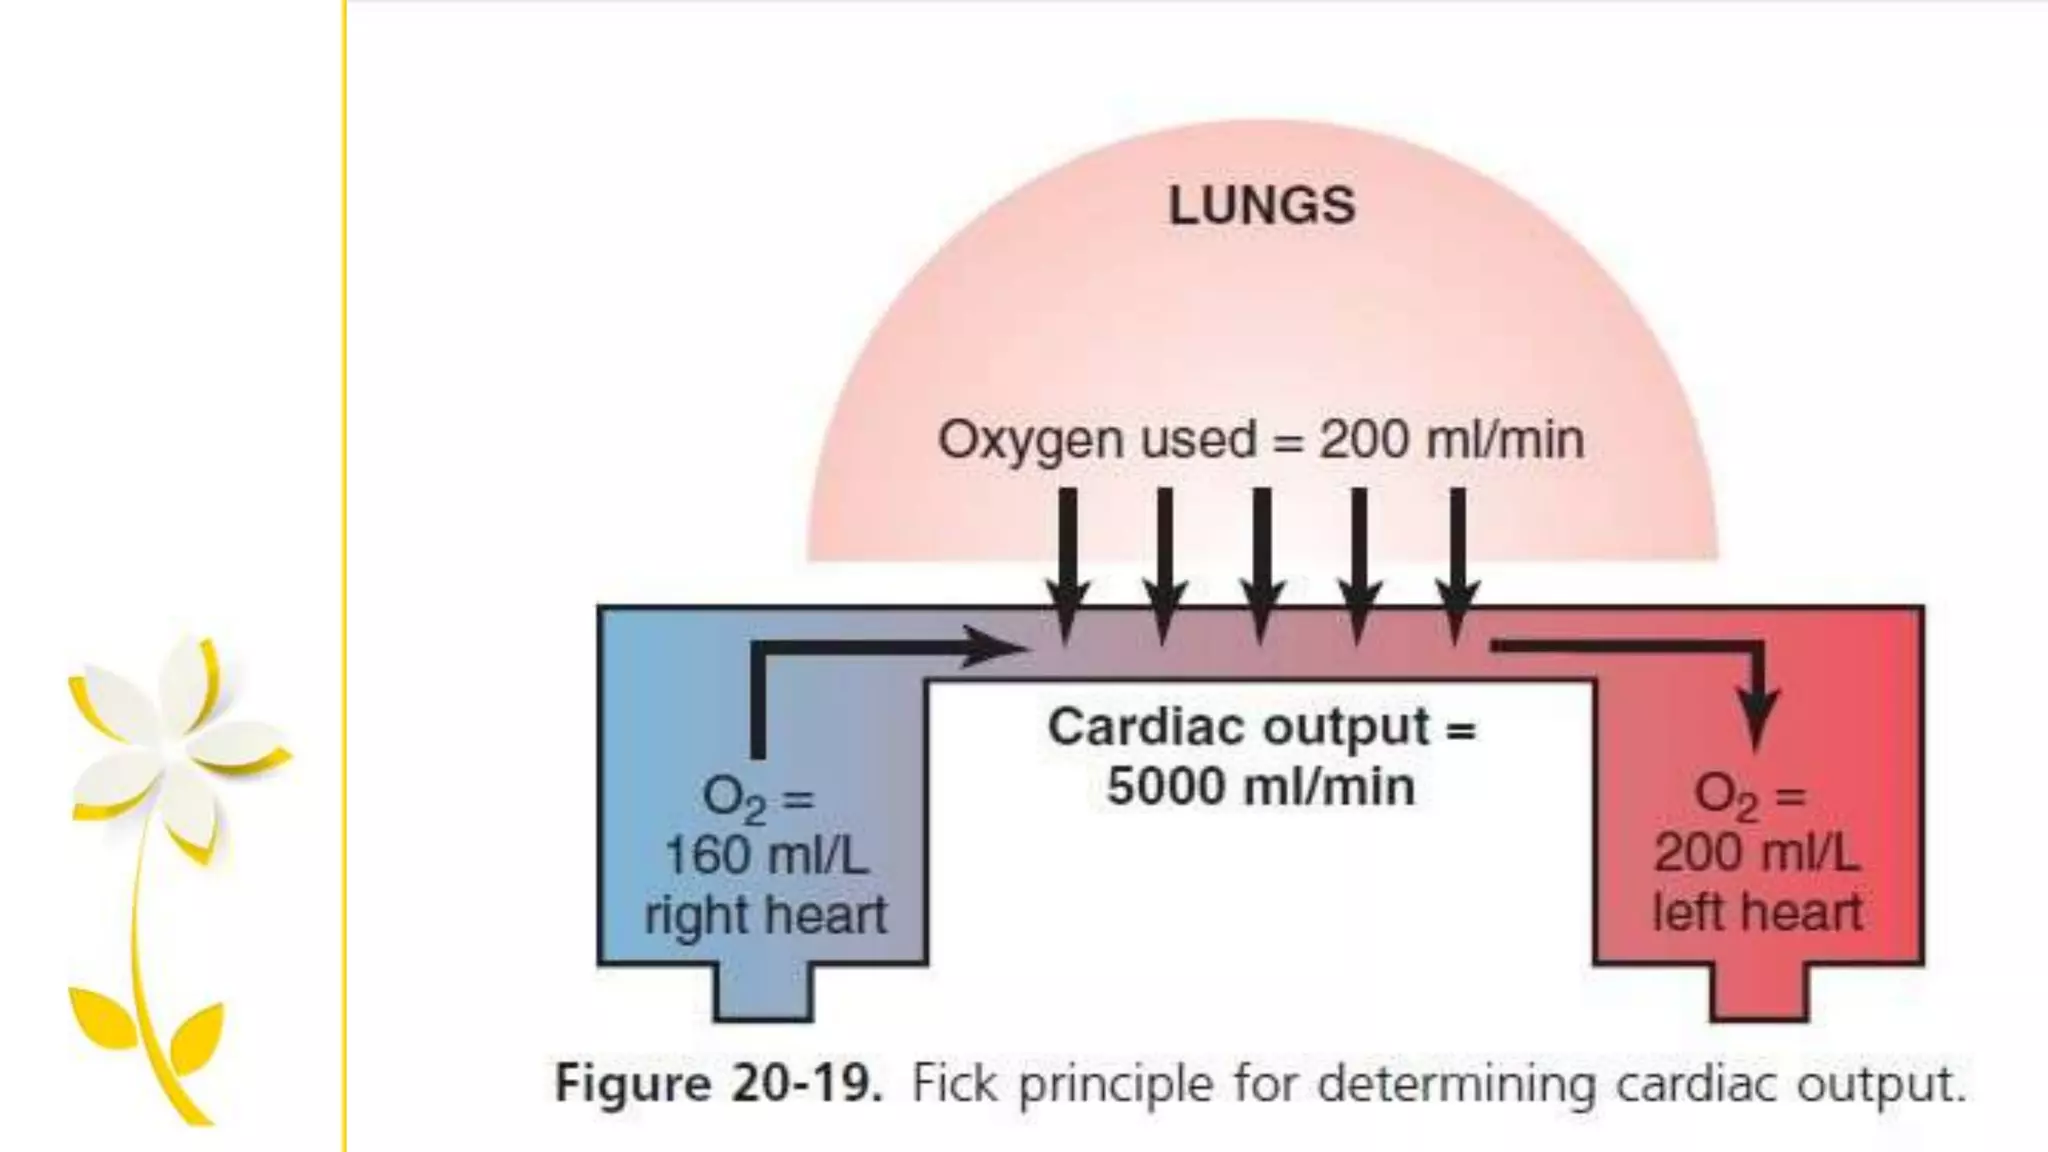
FICK METHOD:
This methodis based on the principle described by ADOLFO FICK in
1870.
PRINCIPLE - the total uptake (or) release of a substance by
an organ is the product of the blood flow through the organ and
the arteriovenous concentration difference of the substance .
20.
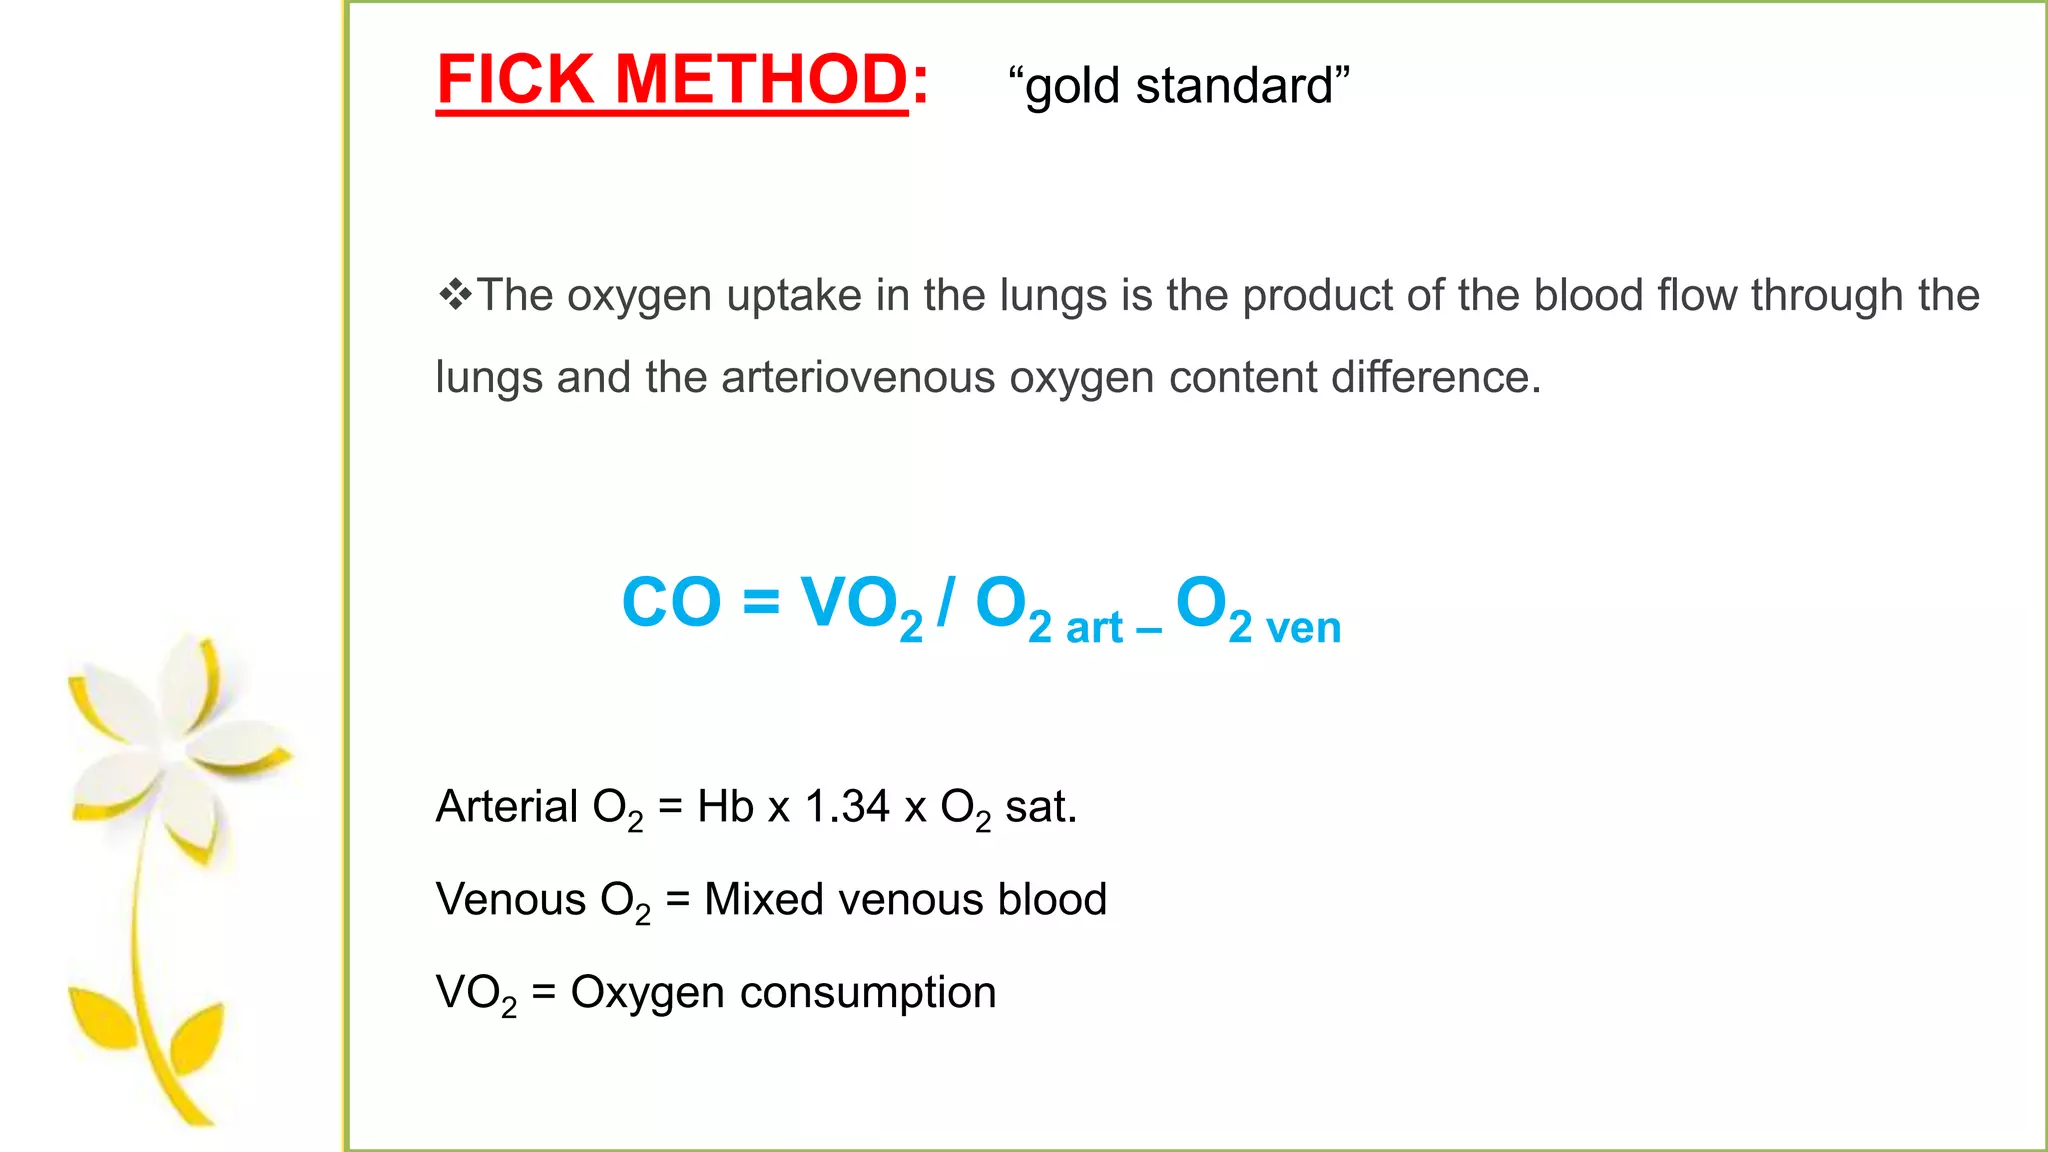
FICK METHOD: “goldstandard”
The oxygen uptake in the lungs is the product of the blood flow through the
lungs and the arteriovenous oxygen content difference.
CO = VO2 / O2 art – O2 ven
Arterial O2 = Hb x 1.34 x O2 sat.
Venous O2 = Mixed venous blood
VO2 = Oxygen consumption
21.
FICK METHOD:
LIMITATIONS :
Fickcardiac outputs are infrequently used because difficulties
in collecting and analyzing exhaled gas conc.
In critically ill patients with lung abnormalities.
22.
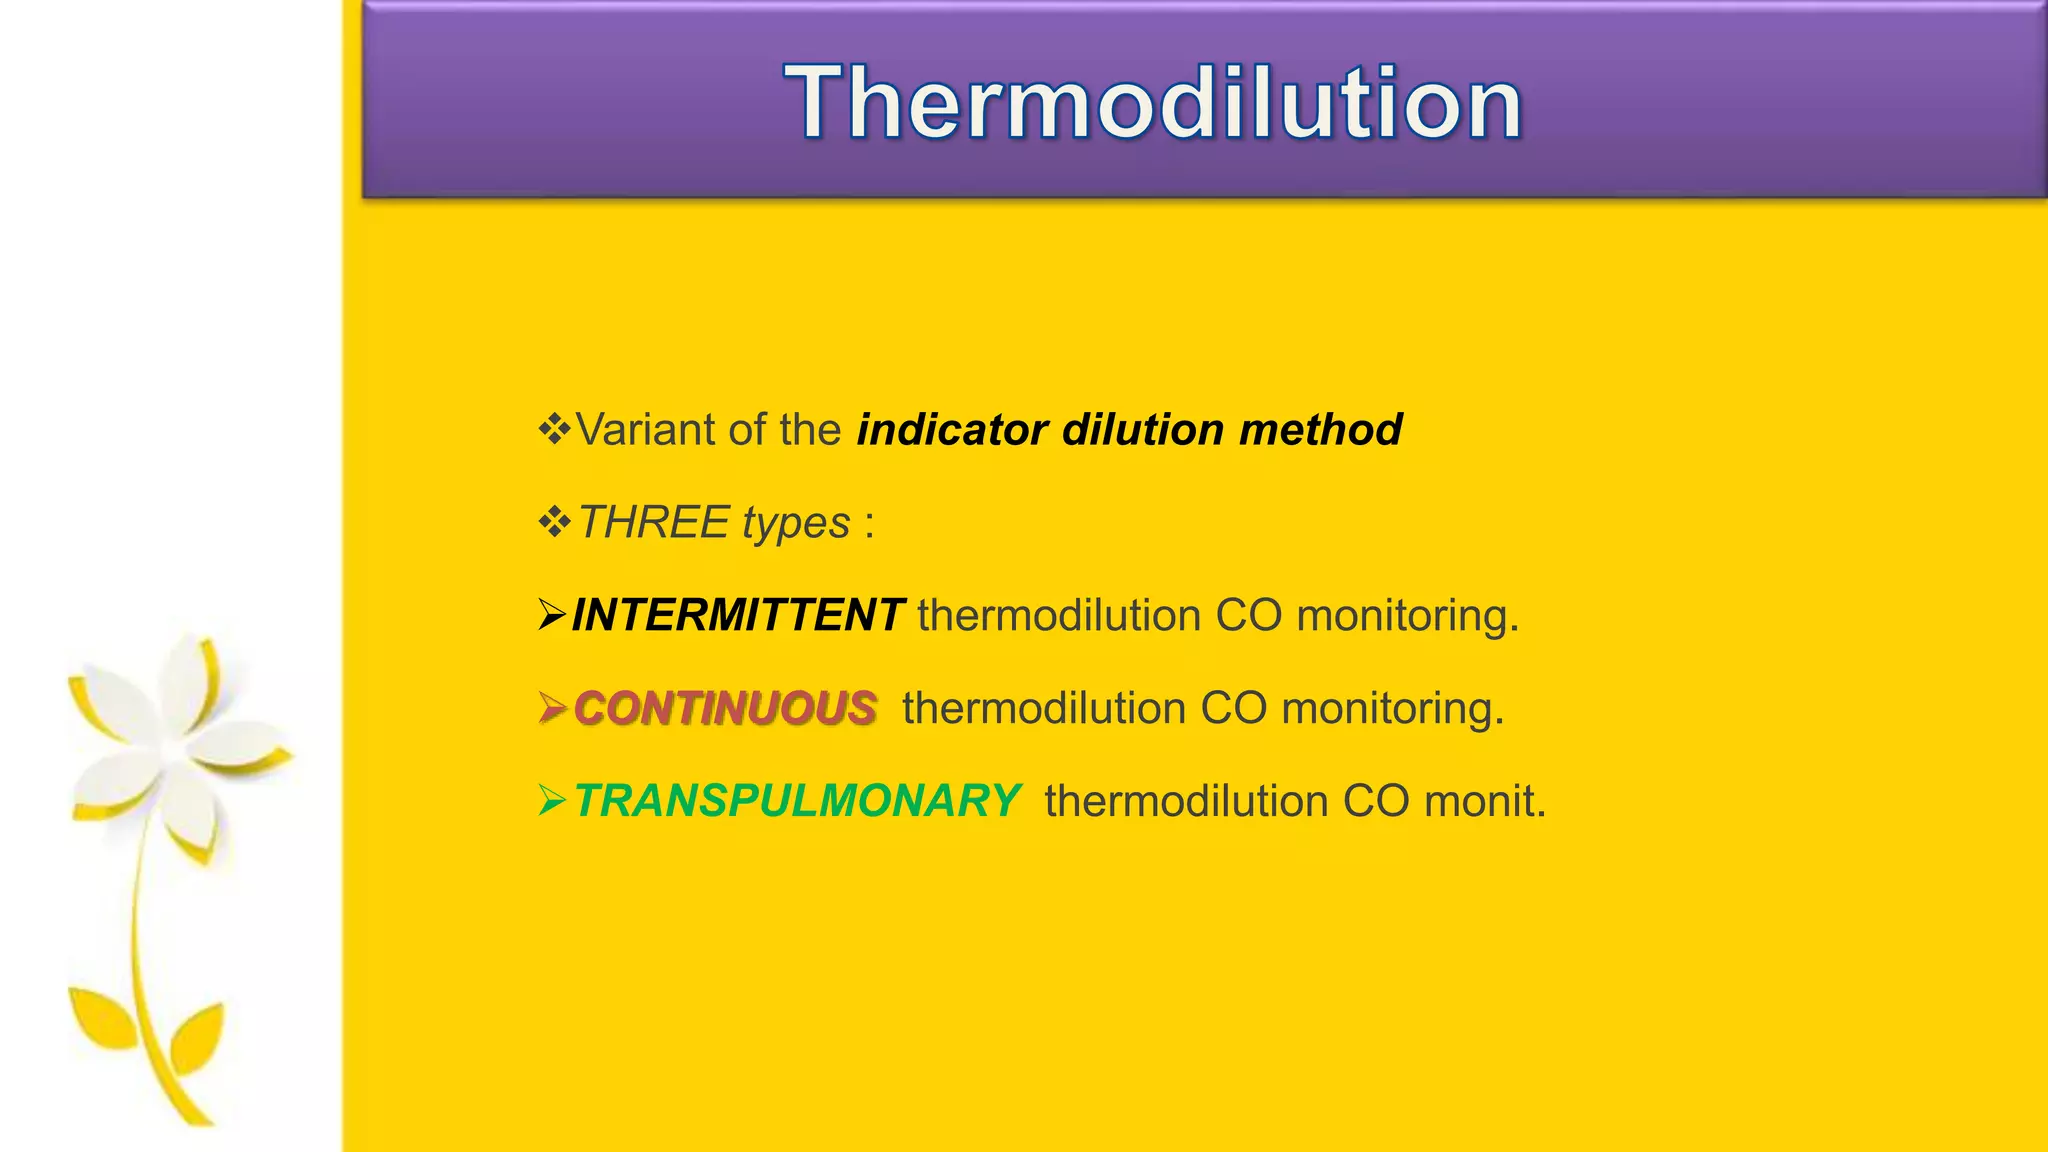
Variant of theindicator dilution method
THREE types :
INTERMITTENT thermodilution CO monitoring.
CONTINUOUS thermodilution CO monitoring.
TRANSPULMONARY thermodilution CO monit.
23.
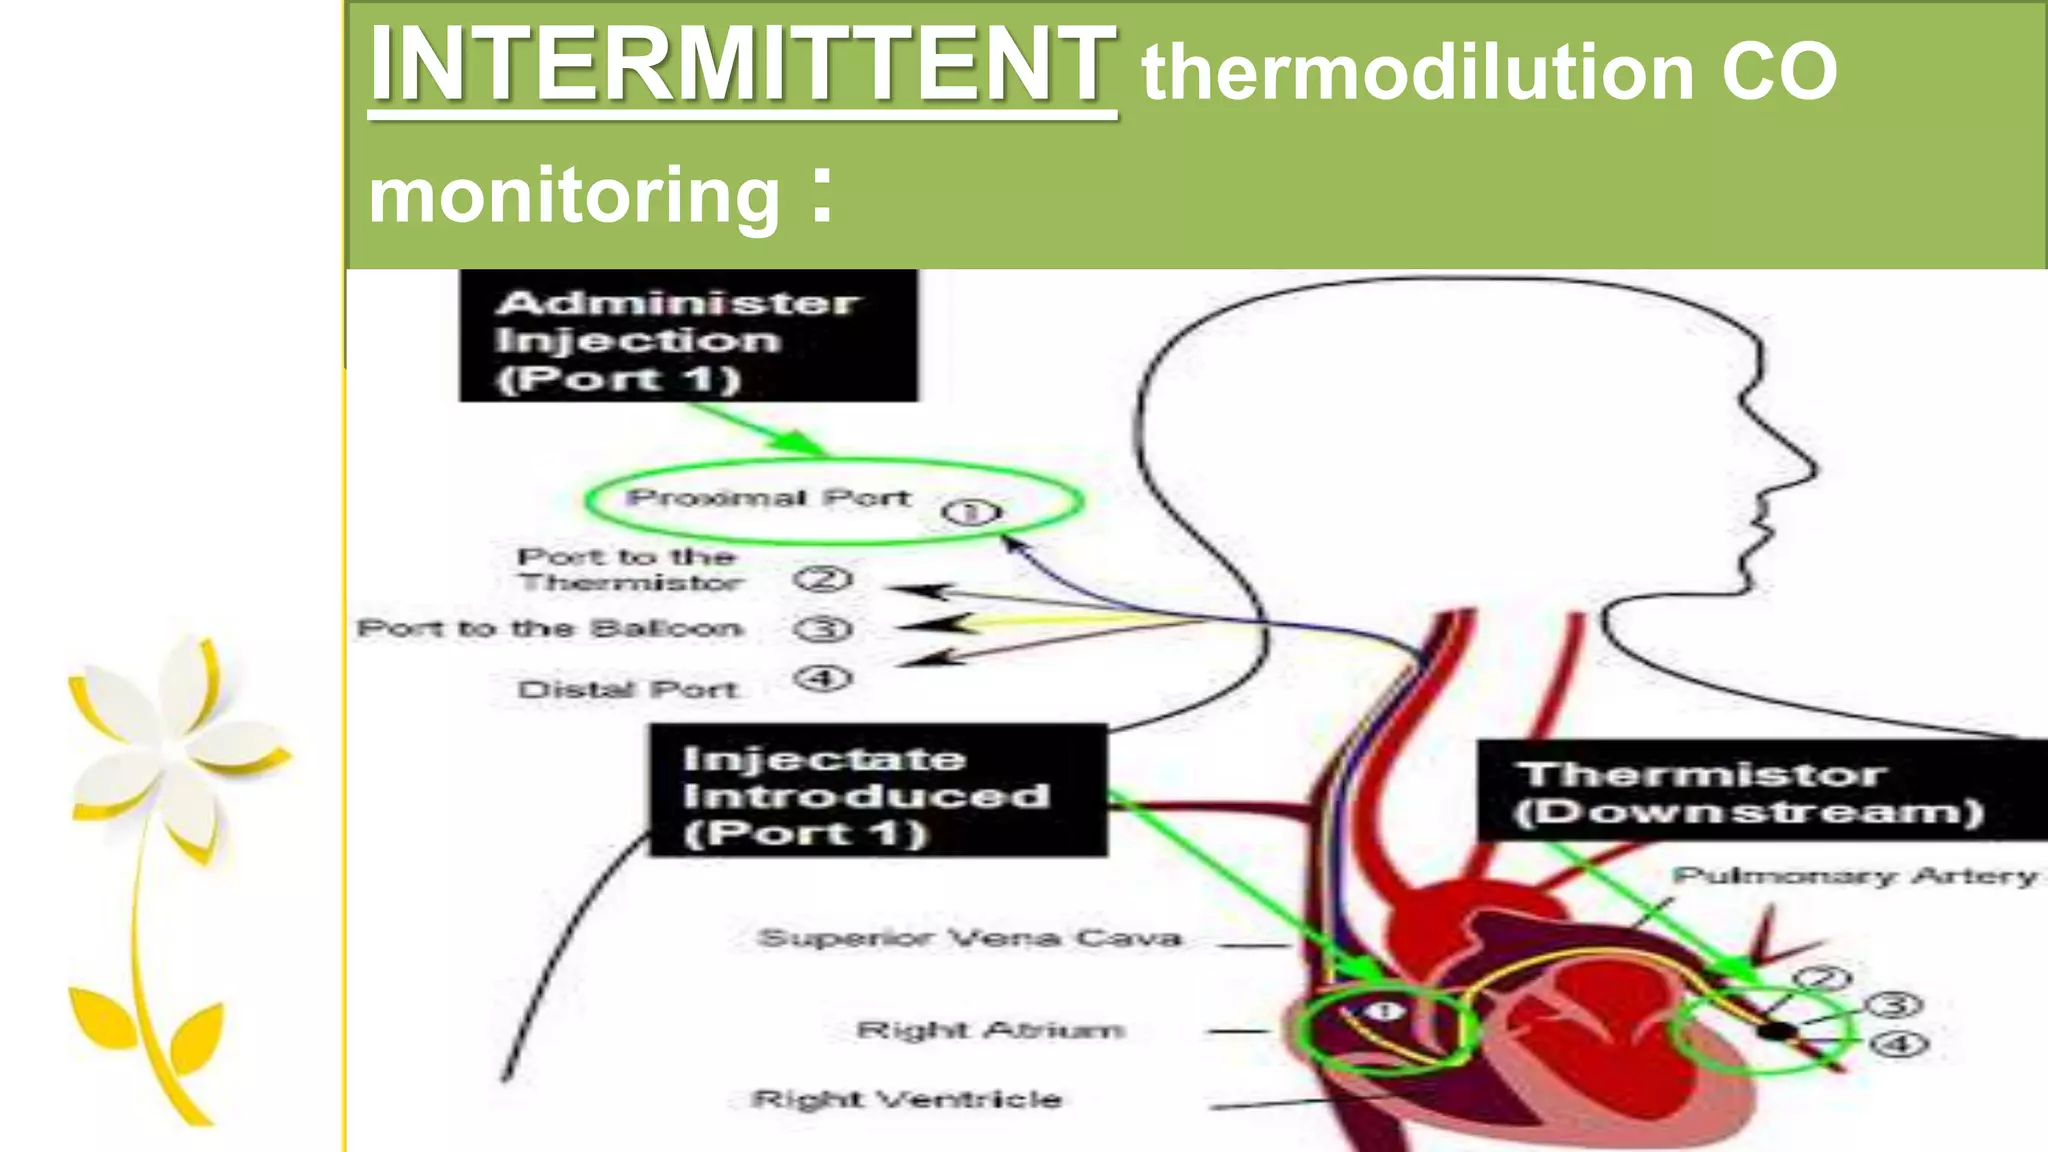
INTERMITTENT thermodilution COmonitoring :
PROCEDURE - A known volume of iced (or) room temp. fluid is injected as
a bolus into the proximal (RIGHT ATRIUM) lumen of PAC & the resulting
change in the pulmonary artery blood temp. is recorded by the thermistor
at the catheter tip.
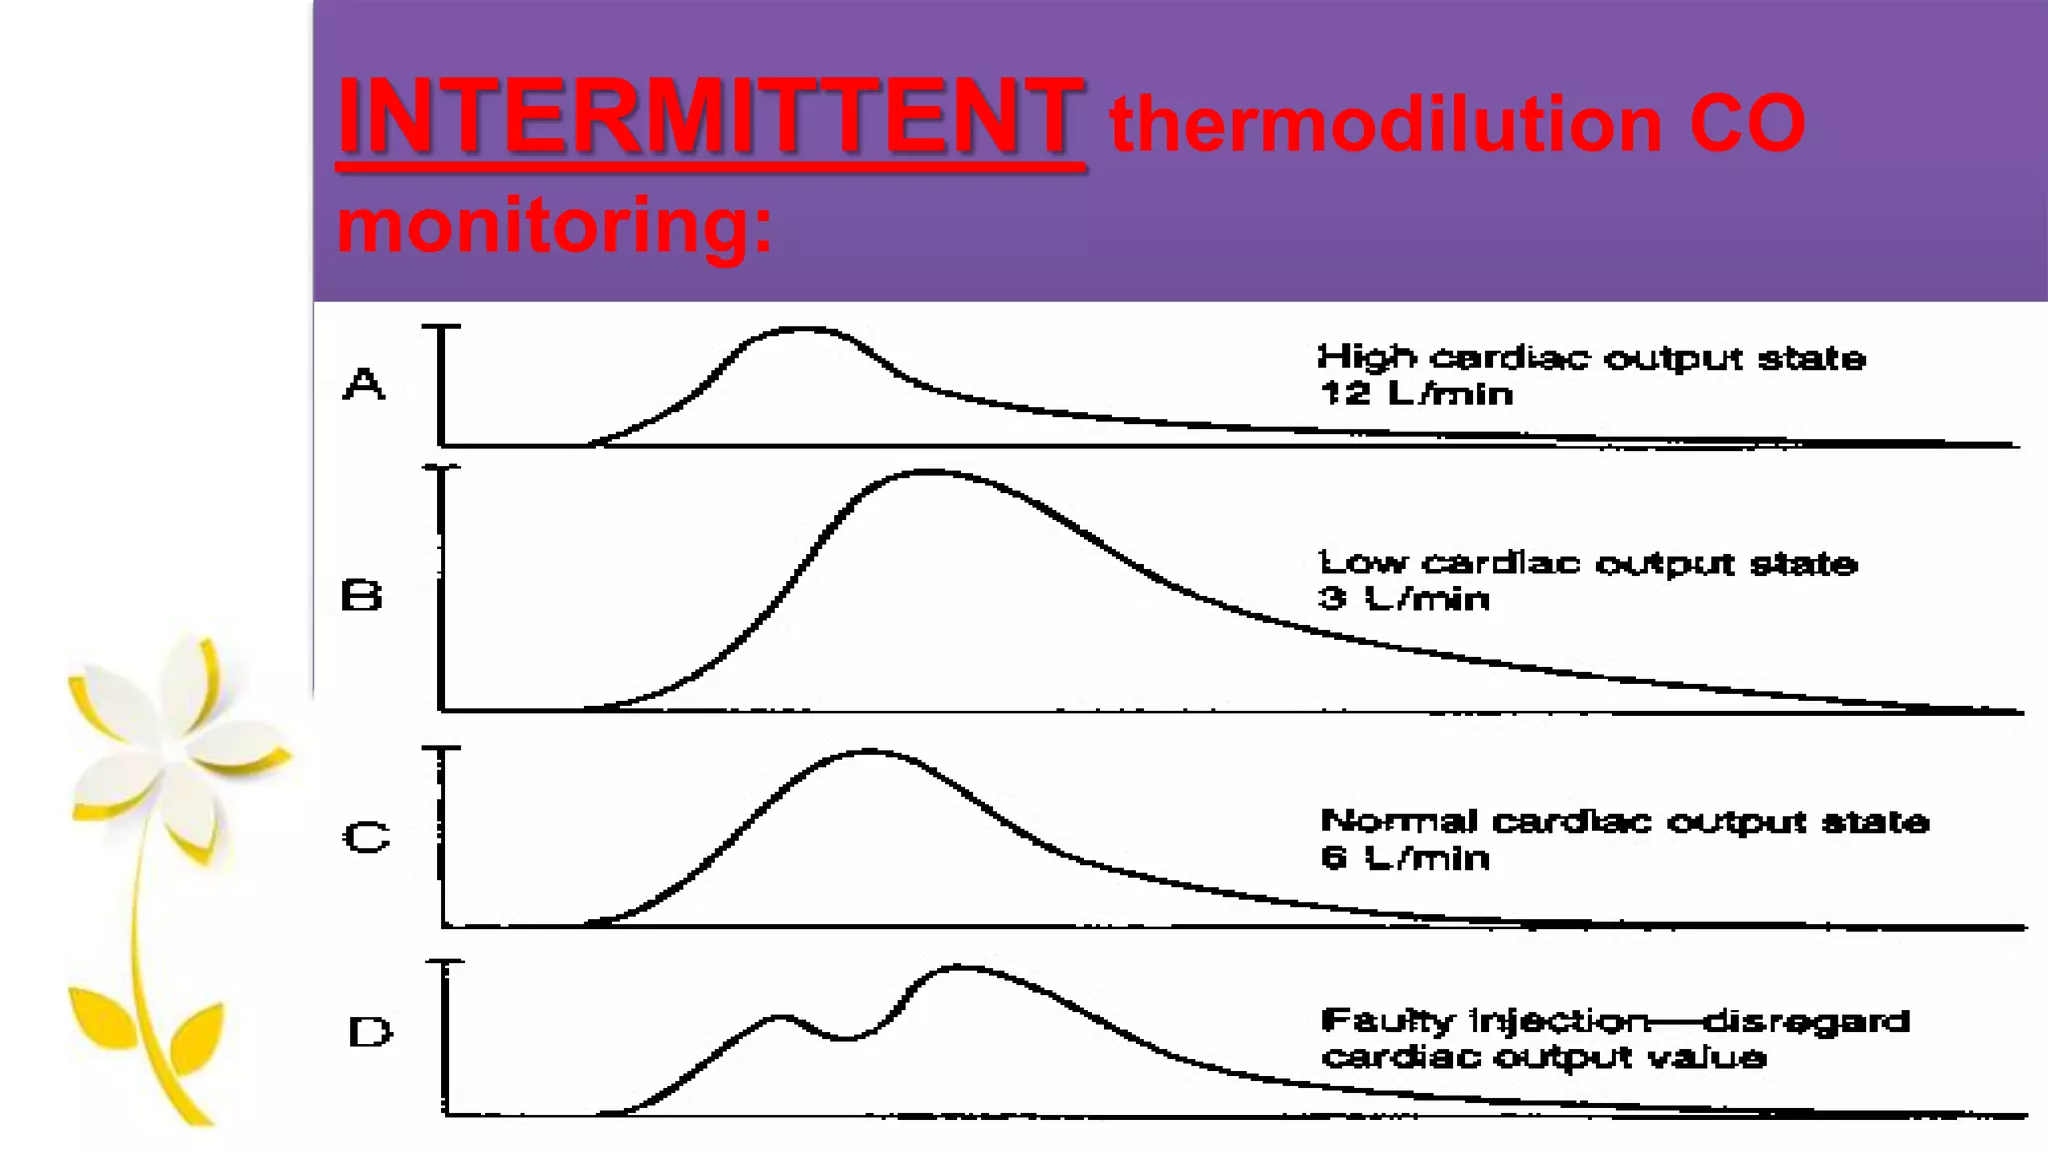
Real time display of the thermodilution curve from each CO monitoring
is important.
Artifacts – unstable blood temp. , recirculation, incomplete indicator
injection – eliminated.
INTERMITTENT thermodilution COmonitoring:
Room temp. injectate is preferred over ice-cold fluid.
Adults – 10ml injectate is used.
Children – 0.15 ml/kg is recommended.
26.
INTERMITTENT thermodilution COmonitoring:
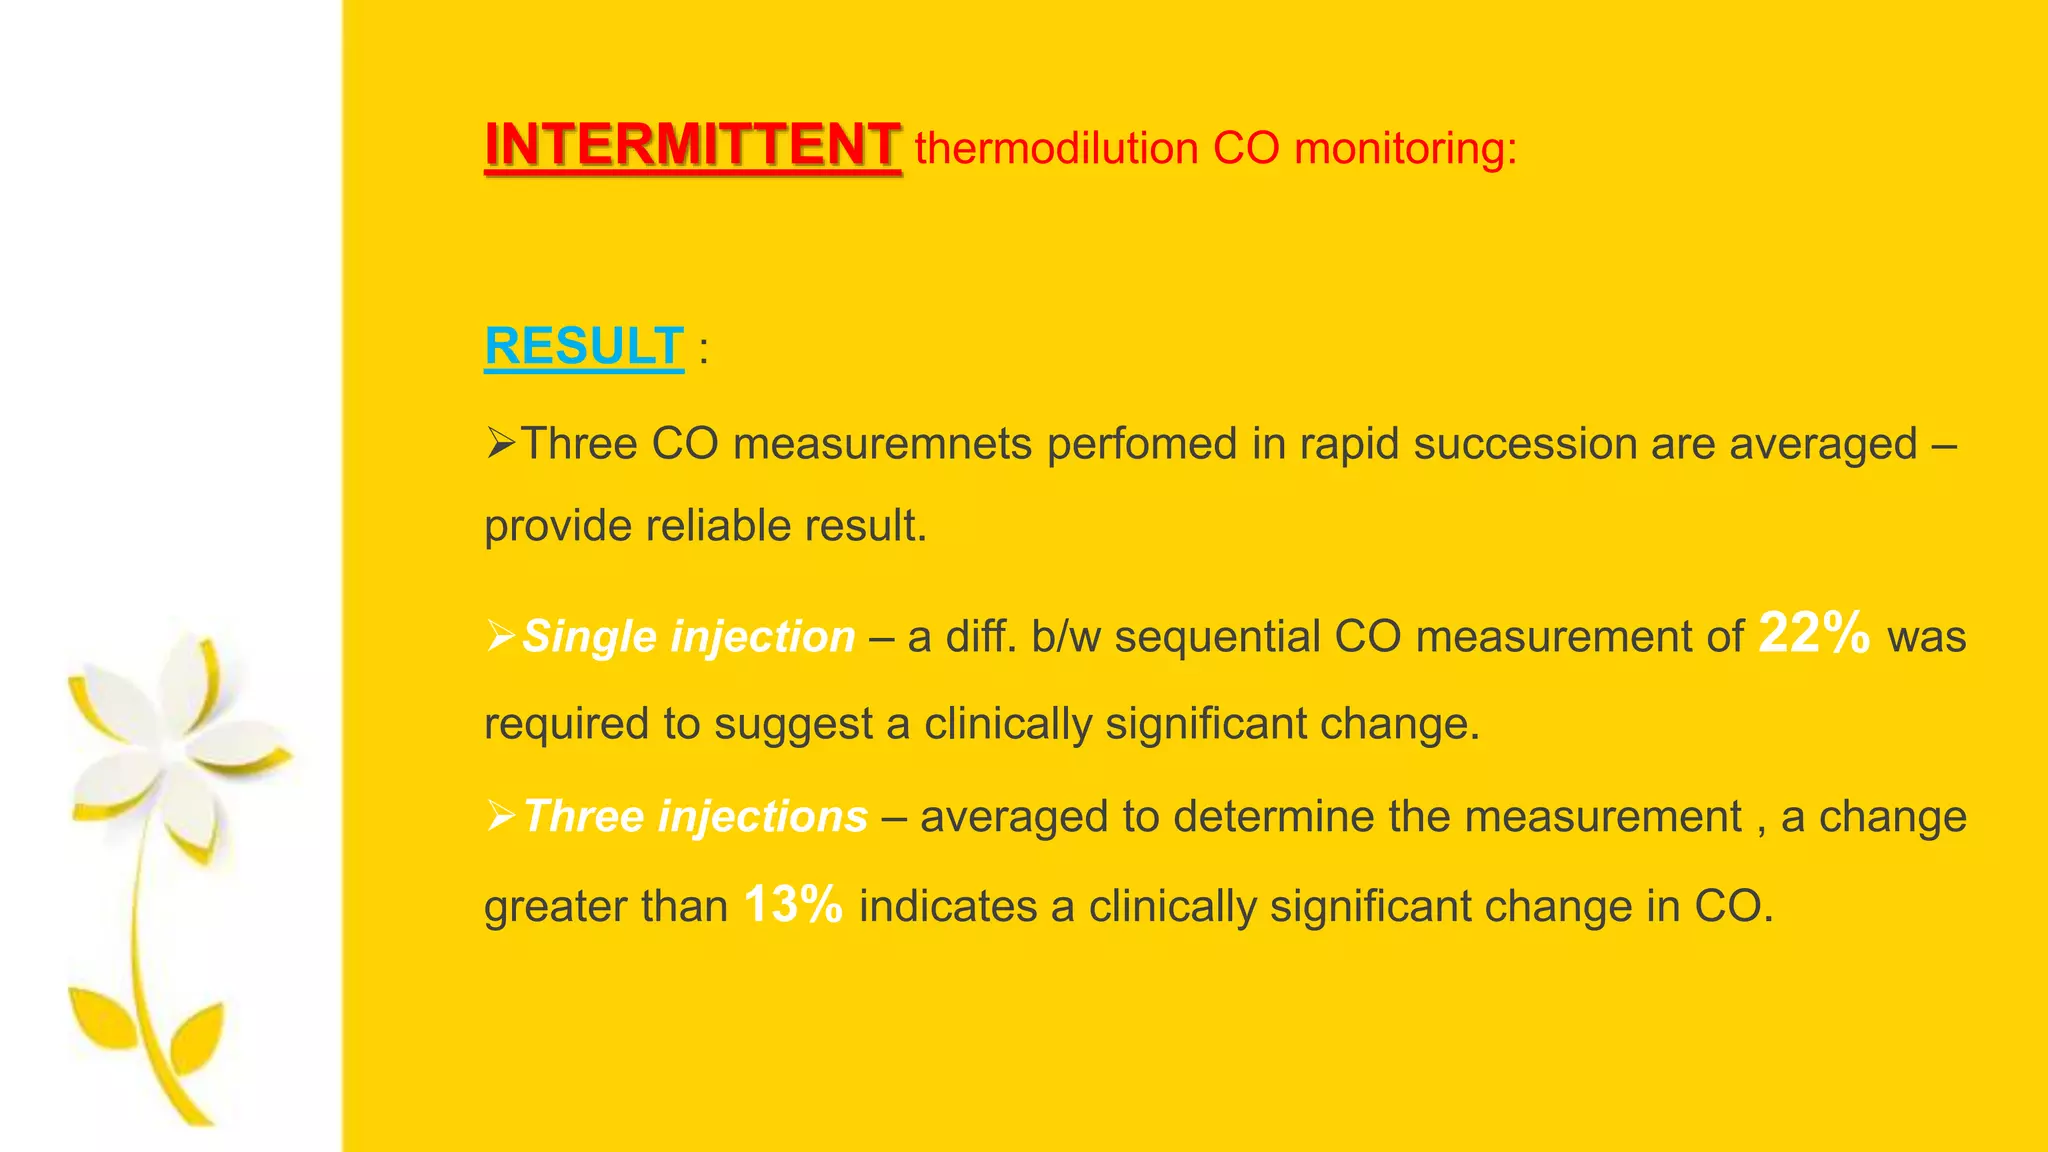
RESULT :
Three CO measuremnets perfomed in rapid succession are averaged –
provide reliable result.
Single injection – a diff. b/w sequential CO measurement of 22% was
required to suggest a clinically significant change.
Three injections – averaged to determine the measurement , a change
greater than 13% indicates a clinically significant change in CO.
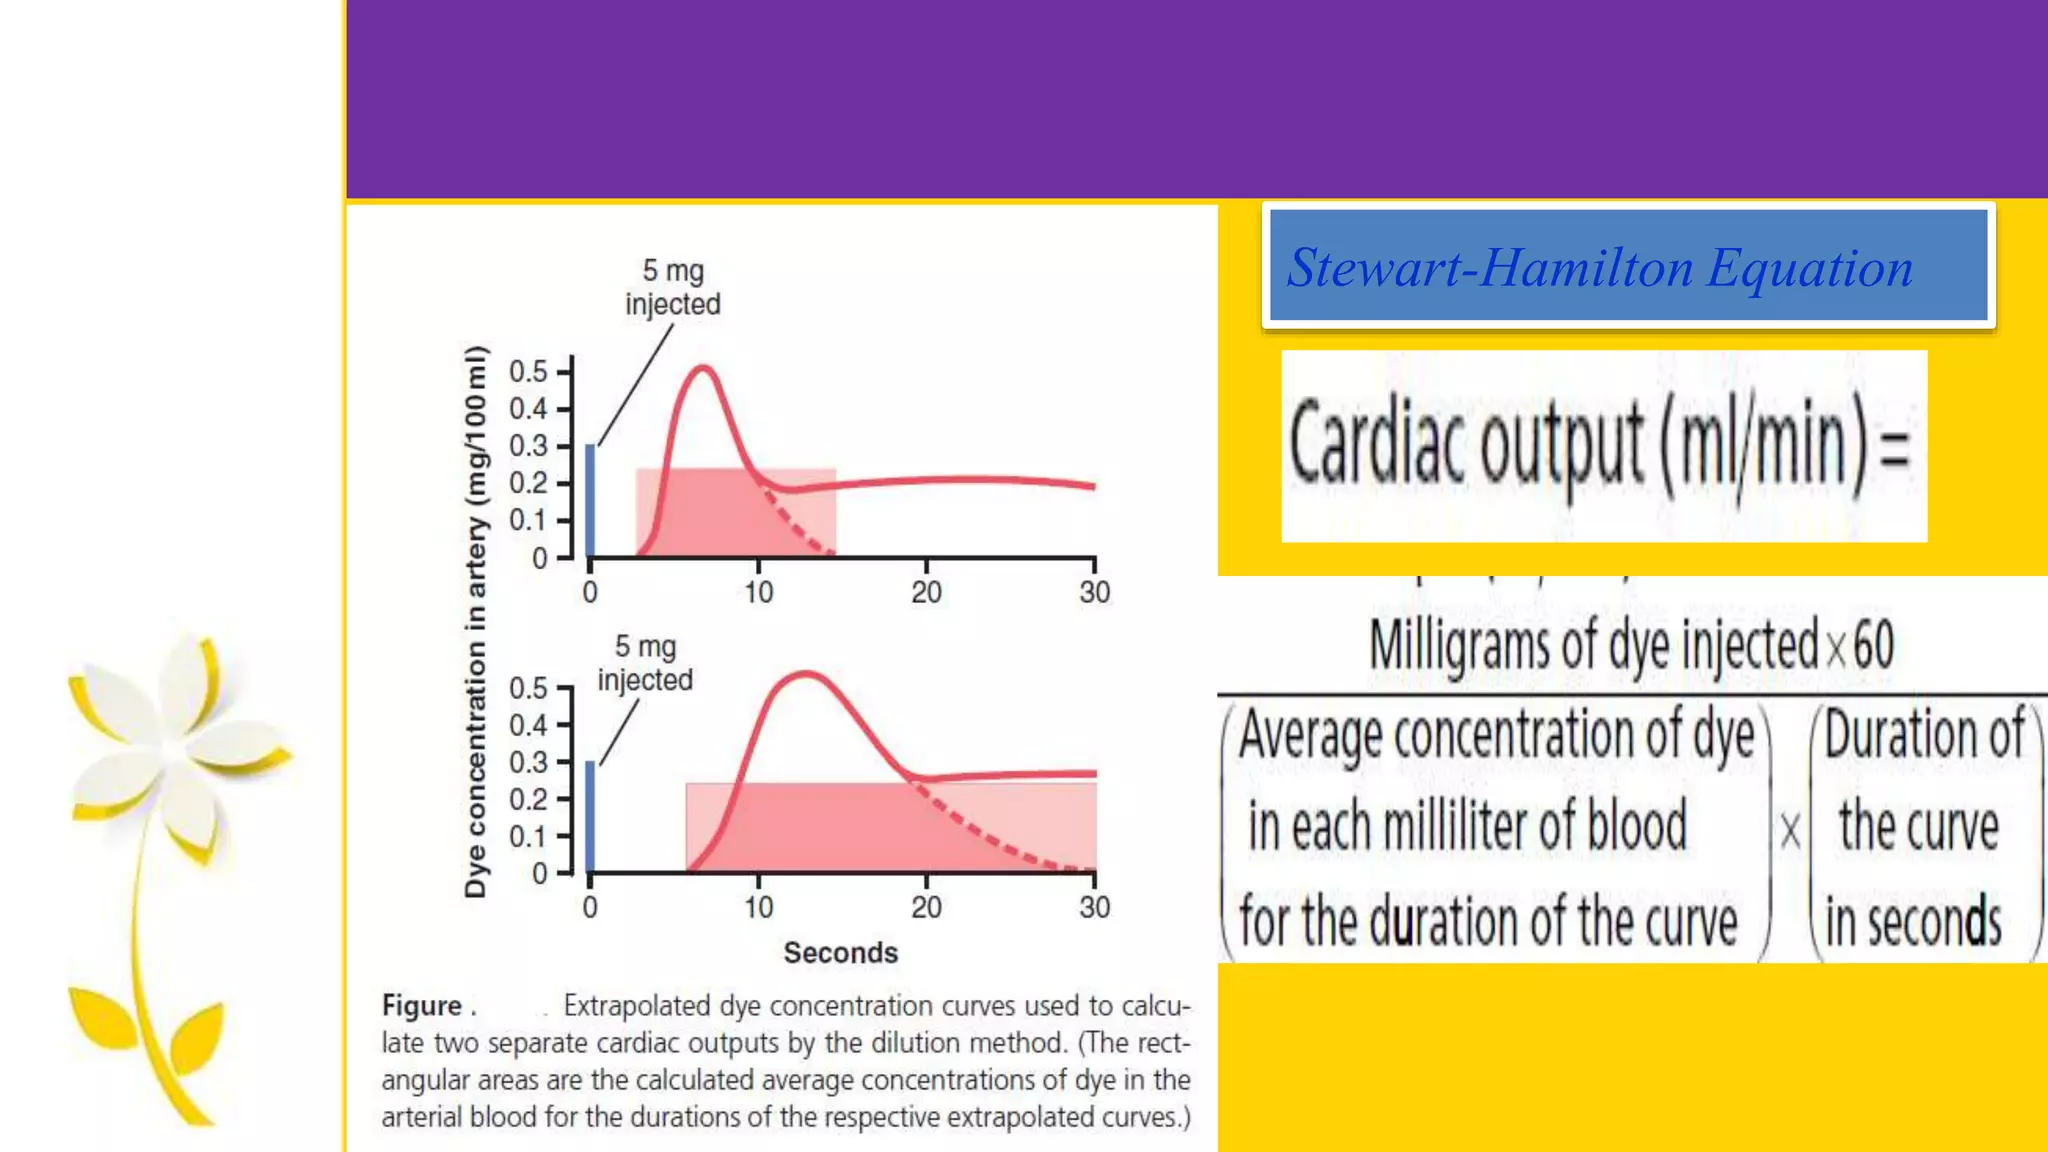
CO= V1( Tb-T1) K1 K2
ξ ΔTb (t) dt
Where,
1. V1=injectate volume in ml
2. Tb = temperature of pulmonary artery blood
3. T1= injectate temperature °C
4. K1 = density factor
5. K2 = computation constant taking in account the catheter dead-space and heat
exchange in transit ; both computation constant
6. Denominator : change in temp and change in time : corresponds to the area
under thermodilution curve
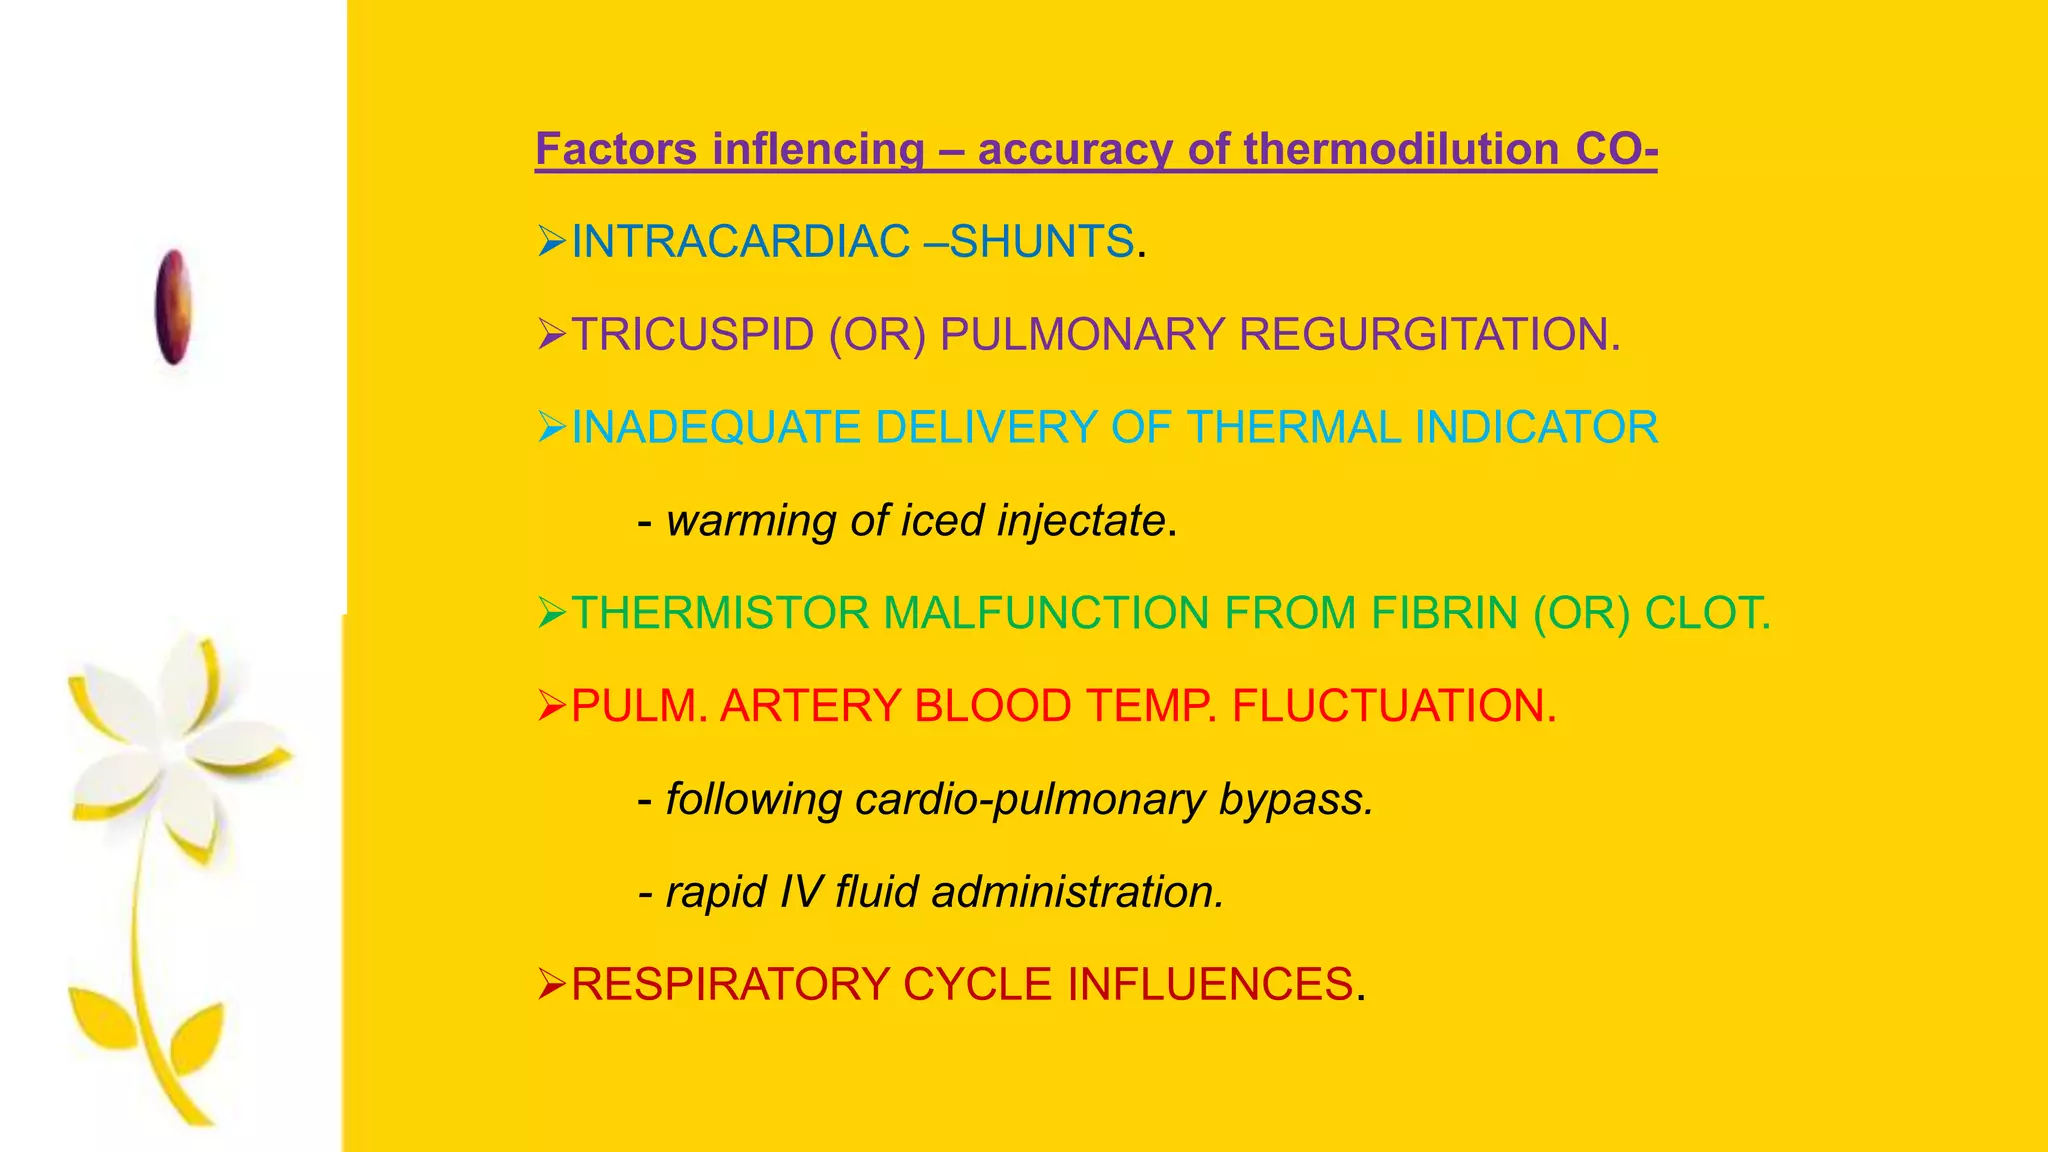
Factors inflencing –accuracy of thermodilution CO-
INTRACARDIAC –SHUNTS.
TRICUSPID (OR) PULMONARY REGURGITATION.
INADEQUATE DELIVERY OF THERMAL INDICATOR
- warming of iced injectate.
THERMISTOR MALFUNCTION FROM FIBRIN (OR) CLOT.
PULM. ARTERY BLOOD TEMP. FLUCTUATION.
- following cardio-pulmonary bypass.
- rapid IV fluid administration.
RESPIRATORY CYCLE INFLUENCES.
32.
CONTINUOUS THERMODILUTION
CARDIAC OUTPUTMONITORING
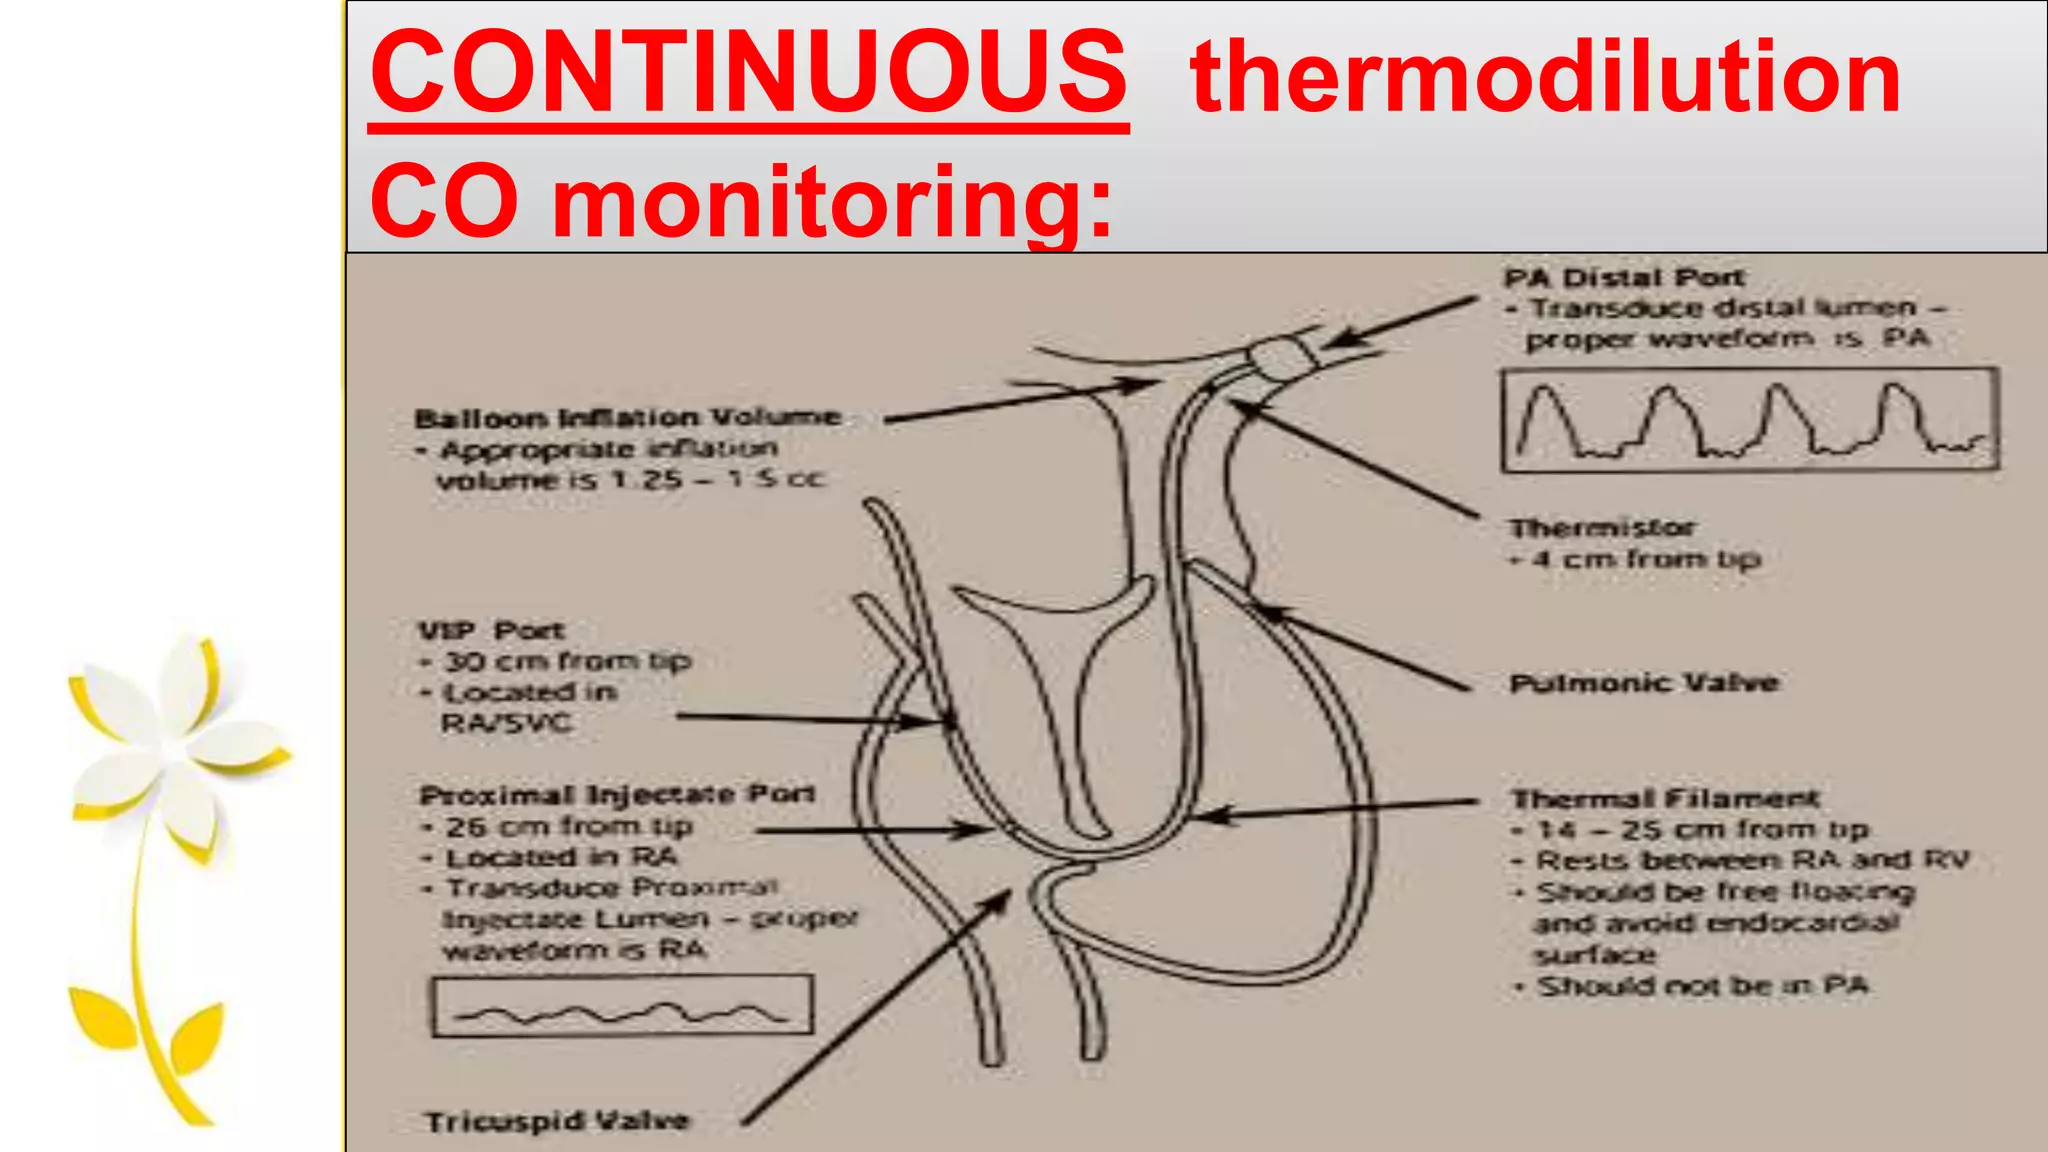
CONTINUOUS thermodilution CO monitoring:
Continuous CO monitoring done using a warm thermal indicator on PAC.
Procedure –Small quantities of heat are released from a 10-cm
thermal filament incorporated into the right ventricular portion of a PAC,
app. 15 – 25 cm from the catheter tip & the resulting thermal signal is
measured by the thermistor at the tip catheter in pulmonary artery.
The heating filament is cycled on & off in a pseudorandom biniary
sequence.
The displayed valuefor CO is updated every 30 to 60 sec & represents
the avg. value of CO measured over the previous 3 to 6 mins.
Siegel & associates showed that CCO markedly slower than changes
detected by ULTRASONIC, BLOOD PRESSURE, MIXED VENOUS O2
SATURATION.
35.
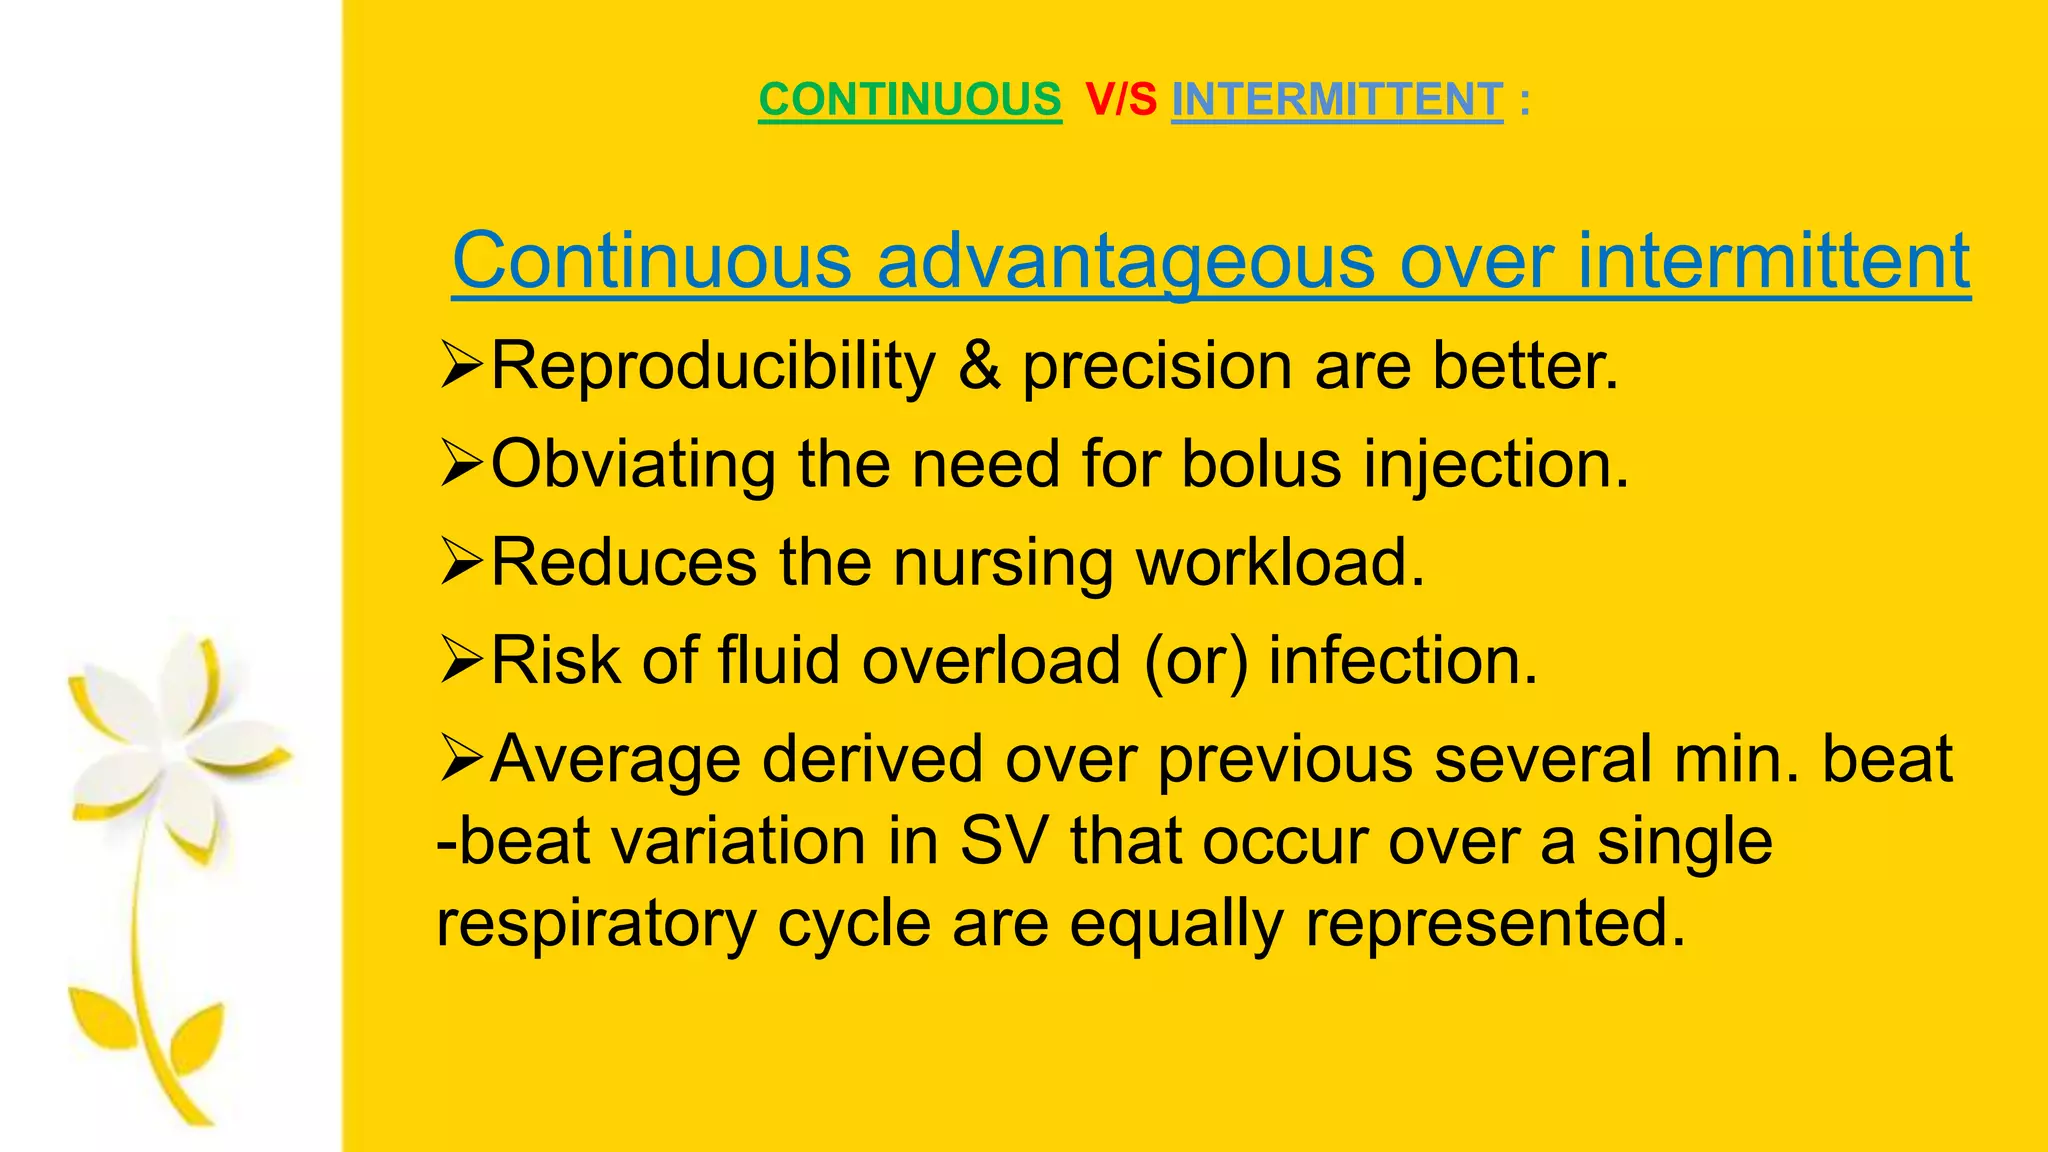
CONTINUOUS V/S INTERMITTENT:
Continuous advantageous over intermittent
Reproducibility & precision are better.
Obviating the need for bolus injection.
Reduces the nursing workload.
Risk of fluid overload (or) infection.
Average derived over previous several min. beat
-beat variation in SV that occur over a single
respiratory cycle are equally represented.
36.
TRANSPULMONARY THERMODILUTION
CARDIAC OUTPUTMONITORING
Procedure - ice-cold saline is injected into the central
venous line while the change in temp. is measured in a large
peripheral artery( femoral, axillary, brachial) via. special
catheter equipped with a thermistor.
Measurements lasts over several cardiac cycles Resp.
effects on stroke volume are averaged & eliminated.
38.
TRANSPULMONARY thermodilution COmonitoring:
OTHER INDICES MEASURED :
Extravascular lung water (pulmonary odema)
Global end-diastolic volume
Intra thoracic blood volume
Cardiac function index.
39.
Lithium DILUTION CARDIACoutput
monitoring
Based on INDICATOR DILUTION PRINCIPLE.
Procedure :Following an intravenous bolus injection of a small
dose of lithium chloride, an ion-selective electrode attached to a
peripheral catheter measures the lithium dilution curve.
From which CO derived.
Lithium can be injected - Peripheral (or) central.
cannot be used – pts. Taking LITHIUM and
NEUROMUSCULAR BLOCKERS.
40.
ESOPHAGEAL DOPPLER
CARDIAC outputmonitoring
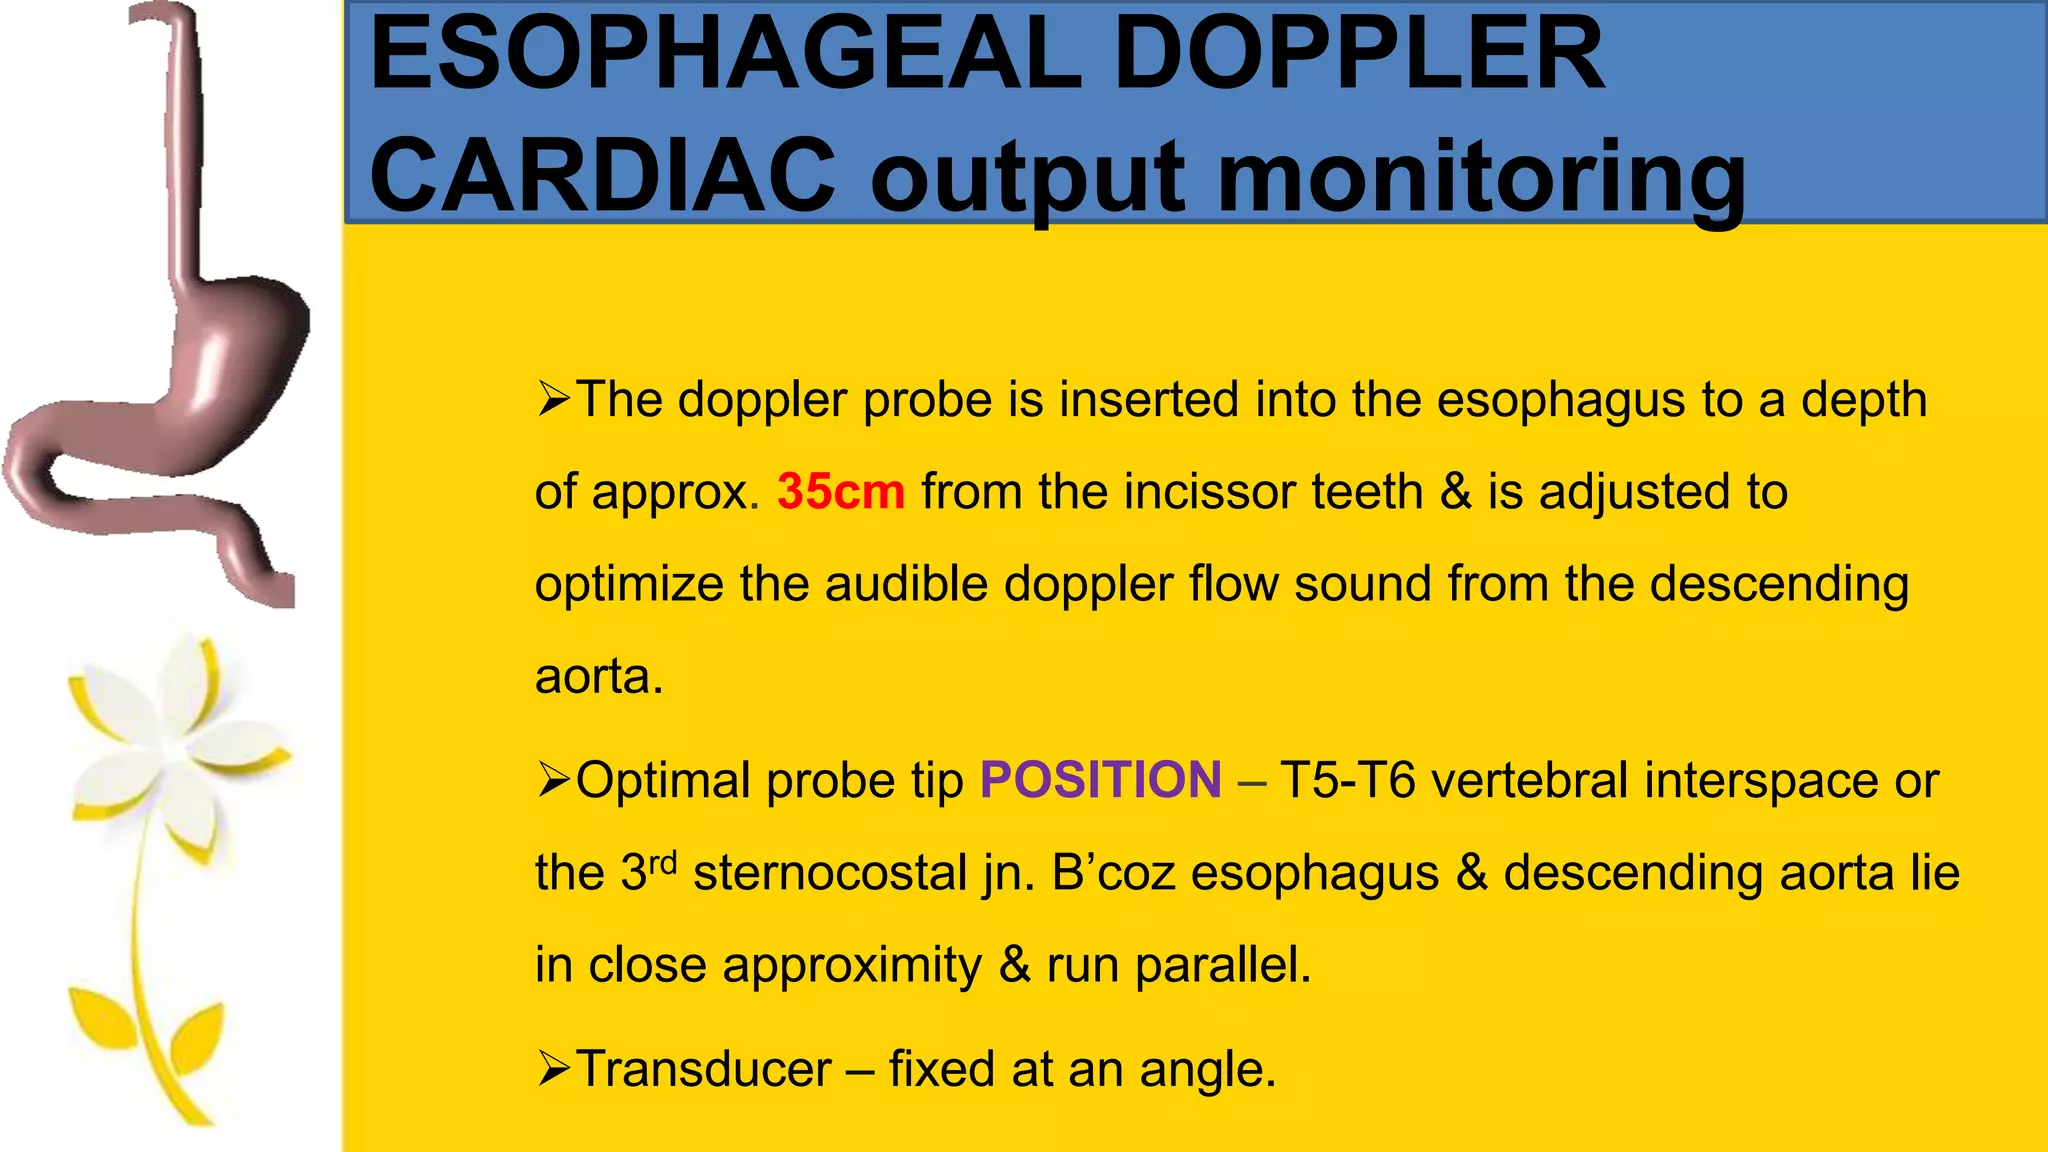
The doppler probe is inserted into the esophagus to a depth
of approx. 35cm from the incissor teeth & is adjusted to
optimize the audible doppler flow sound from the descending
aorta.
Optimal probe tip POSITION – T5-T6 vertebral interspace or
the 3rd sternocostal jn. B’coz esophagus & descending aorta lie
in close approximity & run parallel.
Transducer – fixed at an angle.
41.
ESOPHAGEAL DOPPLER cardiacoutput monitoring:
Measures only a fraction of total CO, so correction constant
of 1.4 is used.
Correction constant is almost universal.
Constant – not used pregnancy, aortic cross clamping,
cardio-pulmonary bypass.
ESOPHAGEAL DOPPLER cardiac
outputmonitoring:
Several studies shown that – volume resuscitation guided by
maximizing esophageal doppler measured SV in moderate risk
surgical pts. Reduces perioperative morbidity & shortens
hospital stay.
B’coz most imp. Benefit – mainly focussing on optimizing on
stroke volume rather than total CO.
47.
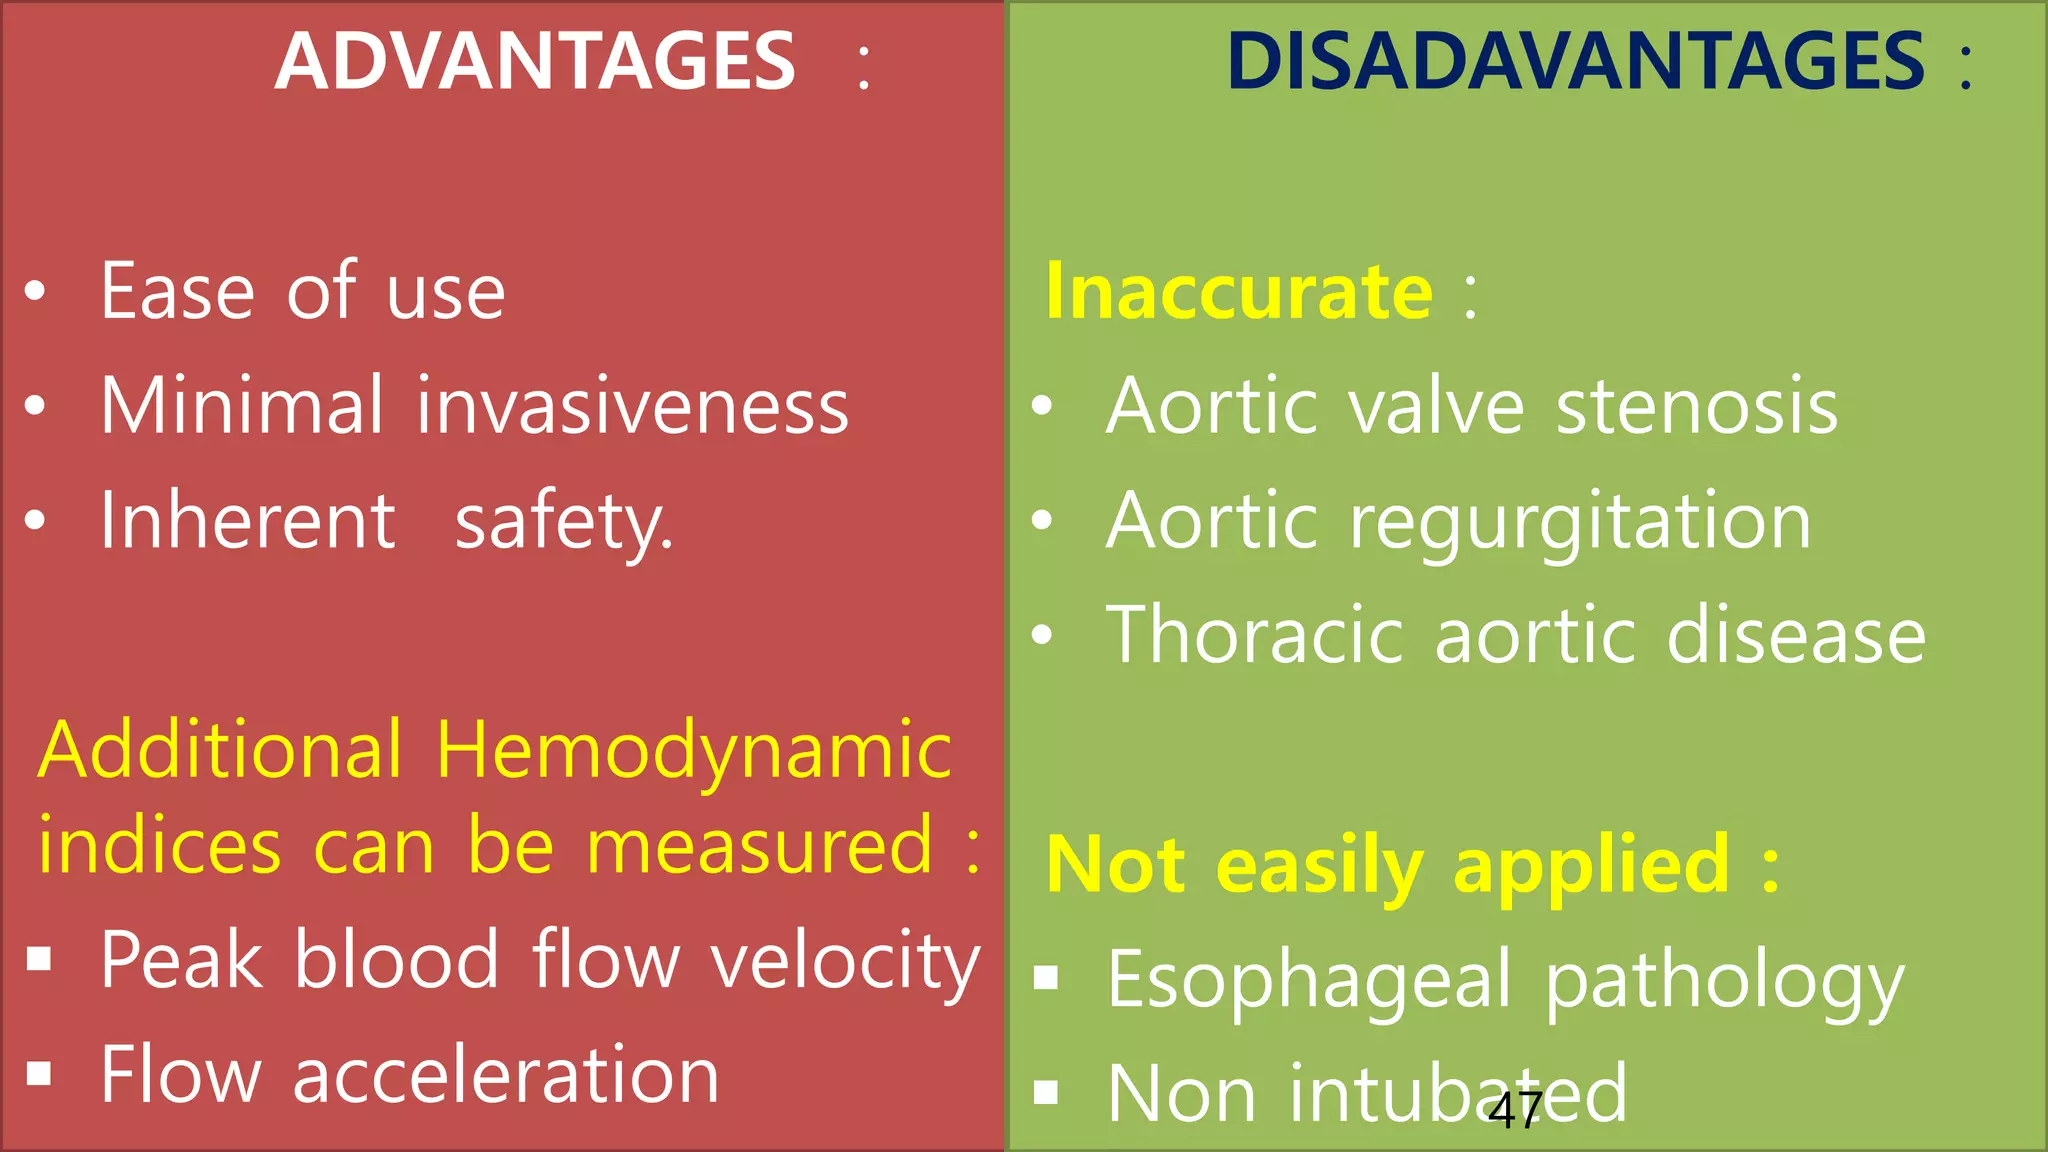
ADVANTAGES :
• Easeof use
• Minimal invasiveness
• Inherent safety.
Additional Hemodynamic
indices can be measured :
Peak blood flow velocity
Flow acceleration
DISADAVANTAGES :
Inaccurate :
• Aortic valve stenosis
• Aortic regurgitation
• Thoracic aortic disease
Not easily applied :
Esophageal pathology
Non intubated47
48.
BIOIMPEDANCE CARDIAC output
monitoring
:
Firstdescribed – kubicek & associates.
Based on – changes in electrical impedance of the thoracic
cavity occuring with ejection of blood during cardiac systole.
49.
Procedure : disposableelectrodes are applied along the sides of the
neck & lateral aspect of lower thorax & a continuous small electrical
current is applied along the chest.
Bioimpedance CO is computed for each cardiac cycle & continuously
displayed as an average value over several heart beats.
Pt. height, weight & gender are used to calculate the volume of
thoracic cavity.
Its reliability deteriorates in – crtically ill pts. With sepsis, pulmonary
edema, AR, cardiac pacing.
50.
Partial CO2 rebreathingCARDIAC
output monitoring
This technique is based on a restatement of the fick equation
for CO2 elimination rather than O2 uptake
CO = VCO2 / Cvco2 Caco2
Vco2 – rate of carbon dioxide elimination
Cvco2 – CO2 content of mixed venous blood
Caco2 – CO2 content of arterial blood.
51.
This method usesthe change in CO2 production & end-tidal
CO2 conc. In response to a brief, sudden change in minute
ventillation.
performed in tracheally intubated patient.
Technique – every 3 min a computer controlled pneumatic
valve intermittently increases deadspace for 50-sec period
there by causing partial rebreathing of the exhaled gases.
52.
LIMITATIONS :
Tracheal intubationrequired.
Precise measurement of exhaled gases to be done.
Contraindicated in ICP increased patients.
Changing patterns of ventillation may have unpredictable influ
ence on meausrement.
Measures pulmonary capillary blood flow as an indicator of to
tal CO & thus requires correction for pulmonary shunt.
53.
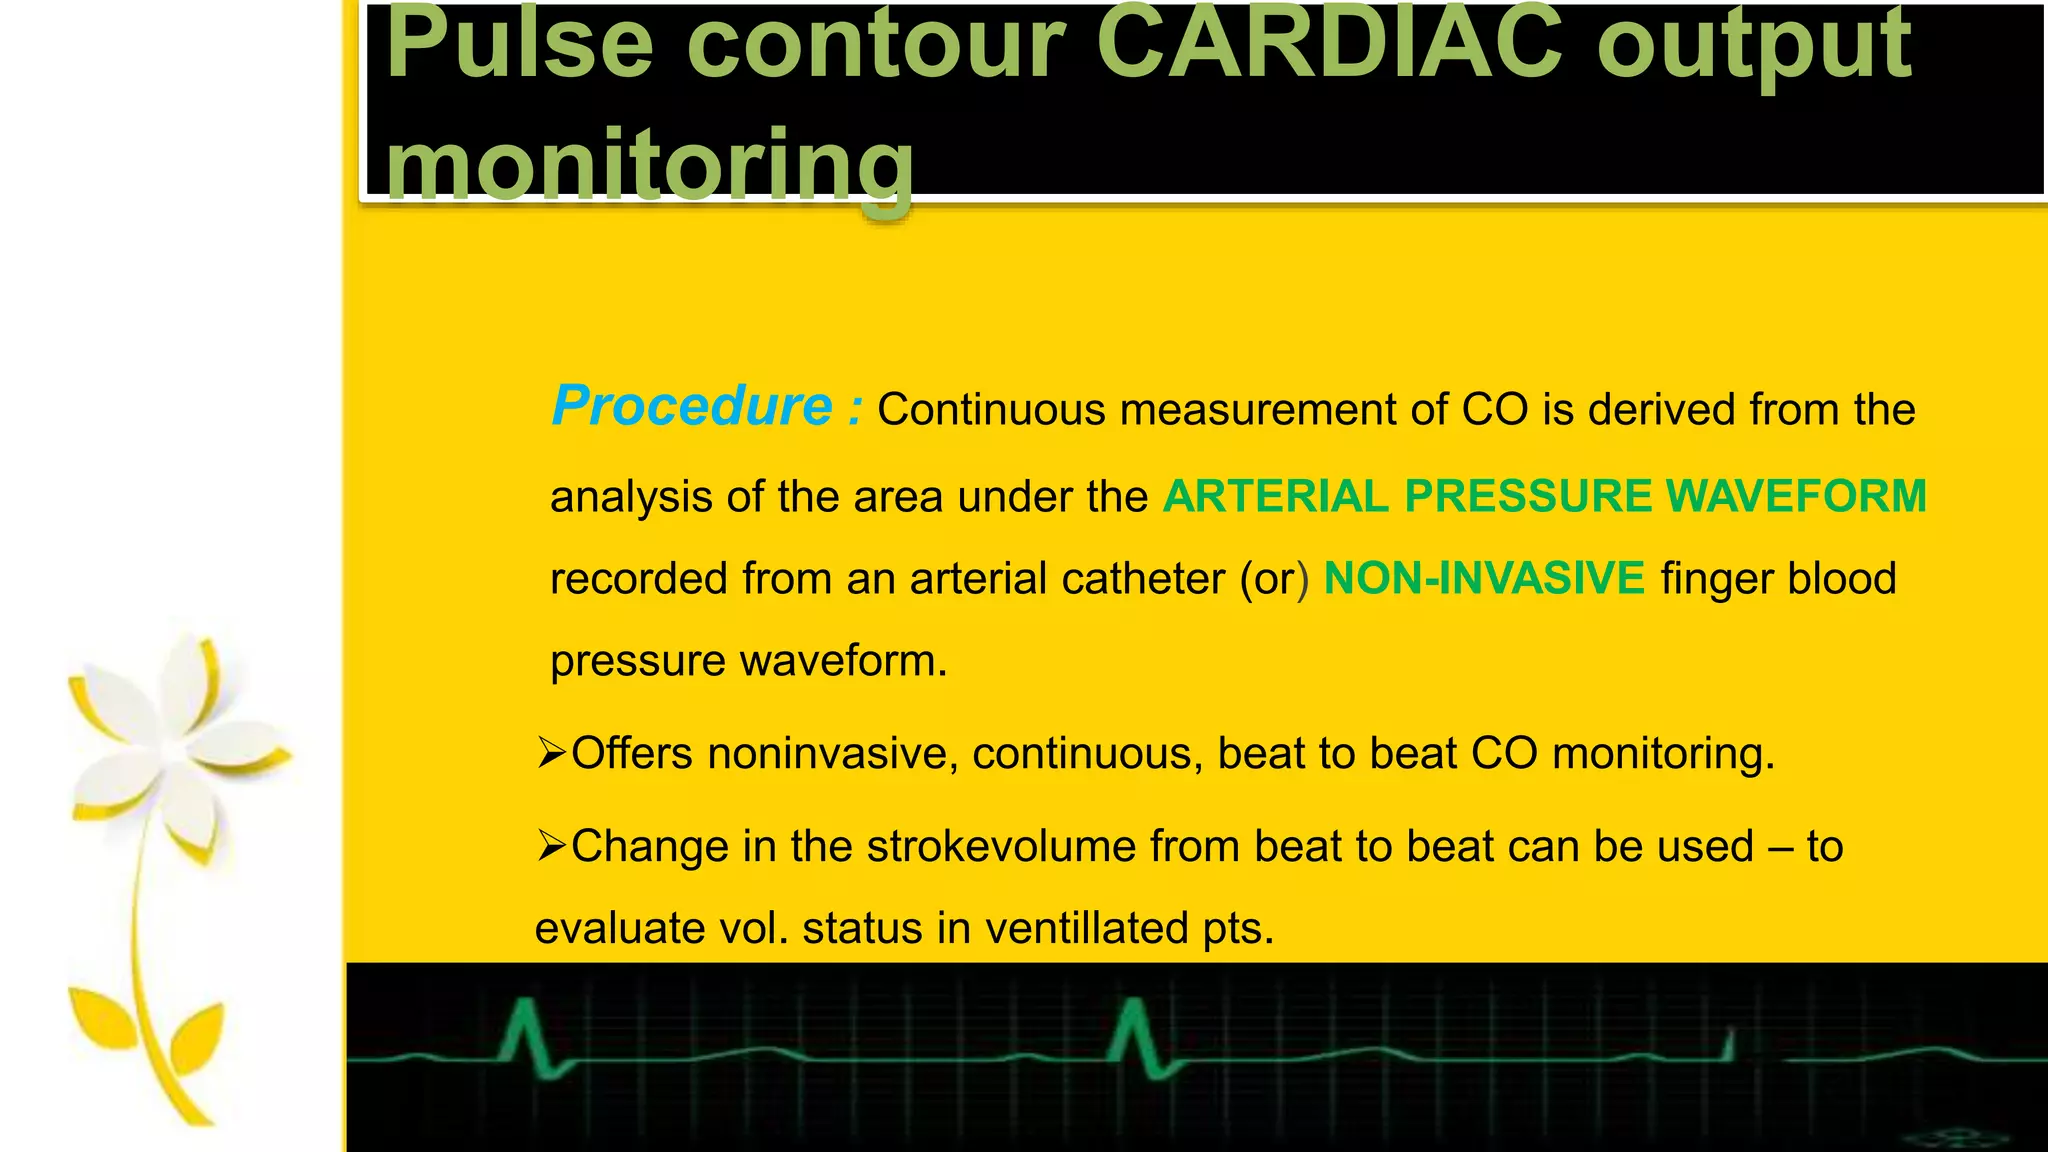
Pulse contour CARDIACoutput
monitoring
Procedure : Continuous measurement of CO is derived from the
analysis of the area under the ARTERIAL PRESSURE WAVEFORM
recorded from an arterial catheter (or) NON-INVASIVE finger blood
pressure waveform.
Offers noninvasive, continuous, beat to beat CO monitoring.
Change in the strokevolume from beat to beat can be used – to
evaluate vol. status in ventillated pts.
54.
LIMITATIONS :
A baseline known CO is required to account for individual
diff. In vascular resistance, impedence & wave reflectance.
Recalibration – every 8 to 12hrs – changes in vascular
characteristic.
Arterial pressure waveform with discernible dicrotic notch
required – not exist in severe tachycardia ,dysrhythmia (or) low
-output states.
Mechanically ventilated – beat to beat SV.
55.
Gastric tonometry
AIM –monitoring gastric circulation as an early
indication of splanchnic hypoperfusion.
Procedure : a balloon-tipped tube is inserted into the stomach &
the saline (or) air in the balloon is allowed to equilibrate with the CO2
gastric lumen.
Intermittently the air (or) saline is aspirated & CO2 measured.
56.
Gastric hypoperfussion –CO2 clearence from gastric mucosa
decreases, where as the CO2 production increases from
Bicorbonate titration of acid released from anaerobic metabolism.
The CO2 from the mucosa diffuses freely to the gastric lumen &
is detected by the tonometry device.
Usefull in critically ill (or) perioperative patients