Downloaded 18 times


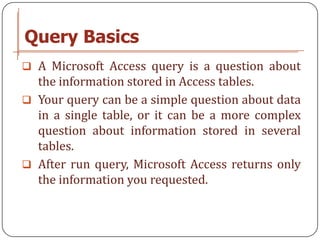
![Calculated Fields
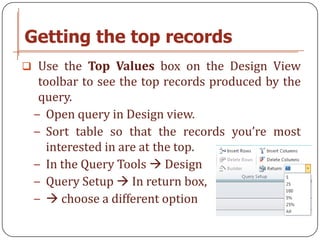
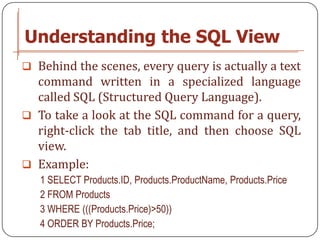
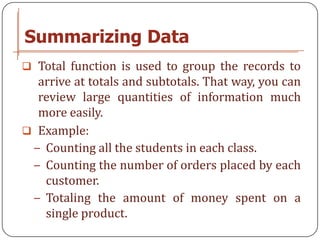
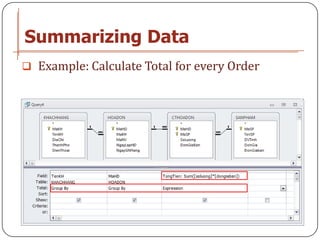
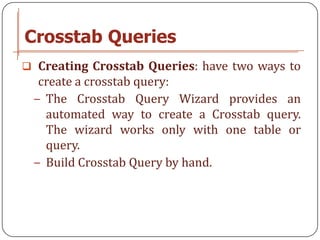
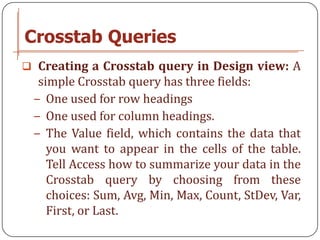
To create a calculated field, you need to supply
two details:
Field Name : Expression
Example: define the PriceWithTax calculated
field:
PriceWithTax: [Price] * 1.10
Field Expressio
Name n](https://image.slidesharecdn.com/003-query-121113191055-phpapp02/85/003-query-15-320.jpg)
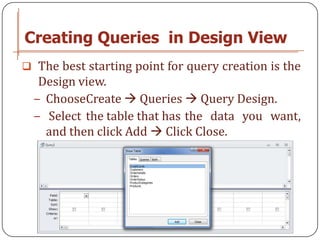
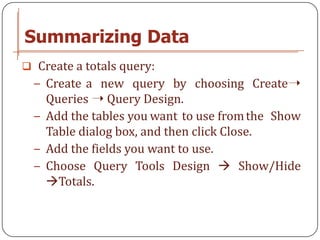
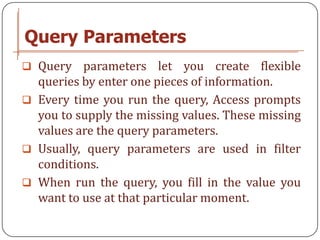
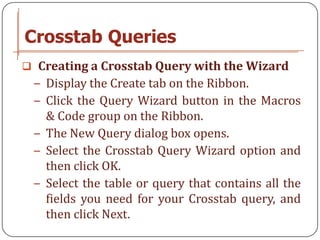
![Expressions with Text
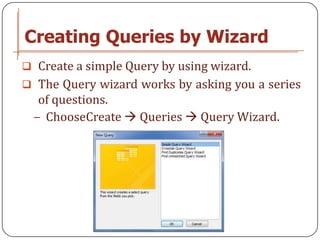
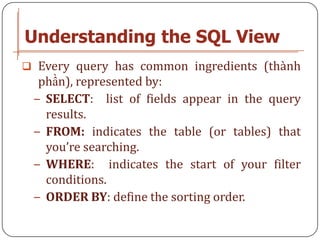
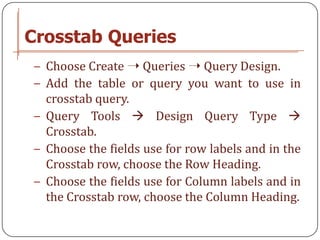
To join text, use the ampersand (&) operator.
For example:
− Create a FullName field from the FirstName
and LastName fields:
FullName: [FirstName] & “ “ & [LastName]
− To “The price is” to appear before each price
value, use this calculated field:
Price: "The price is: " & [Price]](https://image.slidesharecdn.com/003-query-121113191055-phpapp02/85/003-query-17-320.jpg)
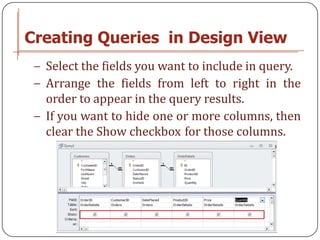
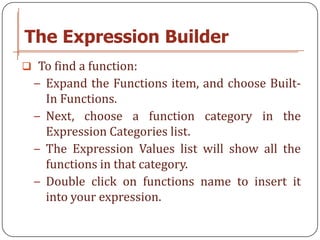
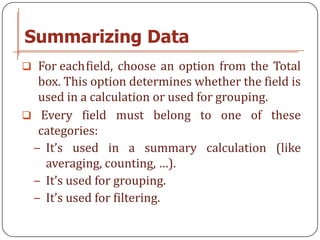
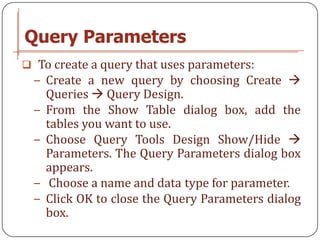
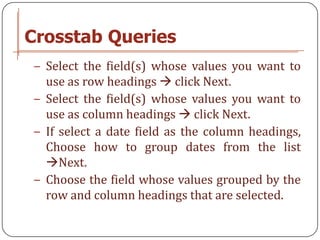
![Using a Function
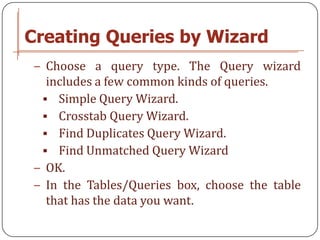
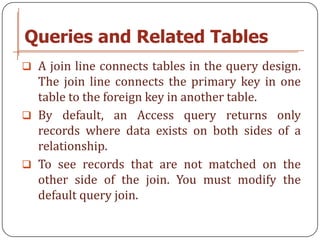
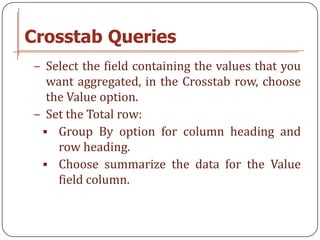
To use a function:
− Enter the function name, followed by
parentheses.
− Inside the parentheses, put all the information
the function needs in order to perform its
calculations.
Example:
SalePrice: Round([Price] * 0.95, 2)](https://image.slidesharecdn.com/003-query-121113191055-phpapp02/85/003-query-19-320.jpg)
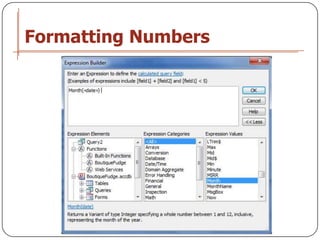
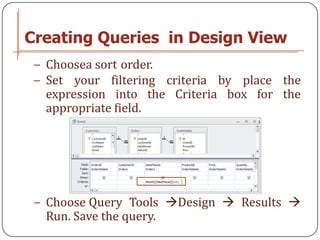
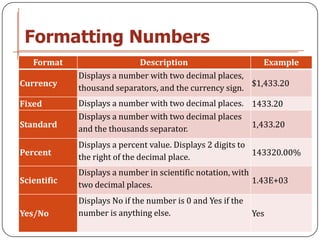
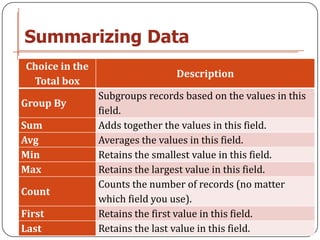
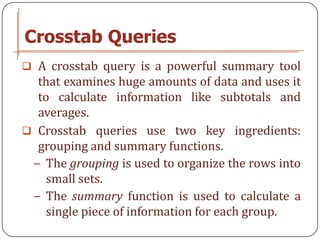
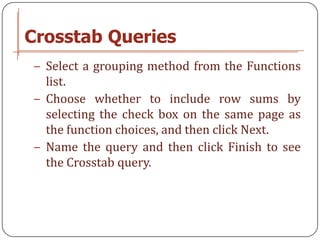
![Formatting Numbers
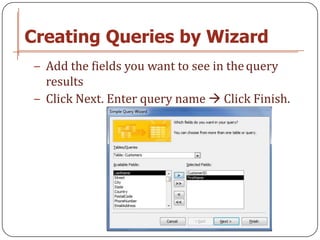
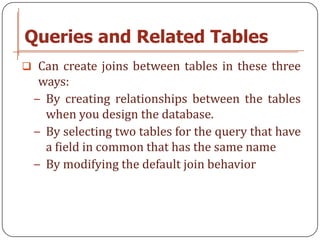
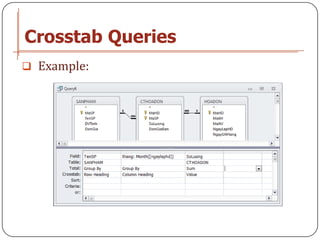
Format(): mathematical function that
transforms numbers into text.
Example:
SalePrice: [Price] * 0.95
− Use the Format() function to apply a currency
format:
SalePrice: Format([Price] / 0.95, "Currency")](https://image.slidesharecdn.com/003-query-121113191055-phpapp02/85/003-query-23-320.jpg)


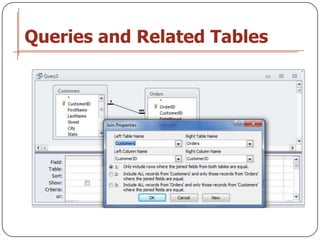
Queries allow users to extract specific information from one or more database tables. There are different ways to create queries, including using design view, a wizard, or SQL view. Queries can include calculations, formatting, parameters, and summaries to provide flexible reporting of essential data.