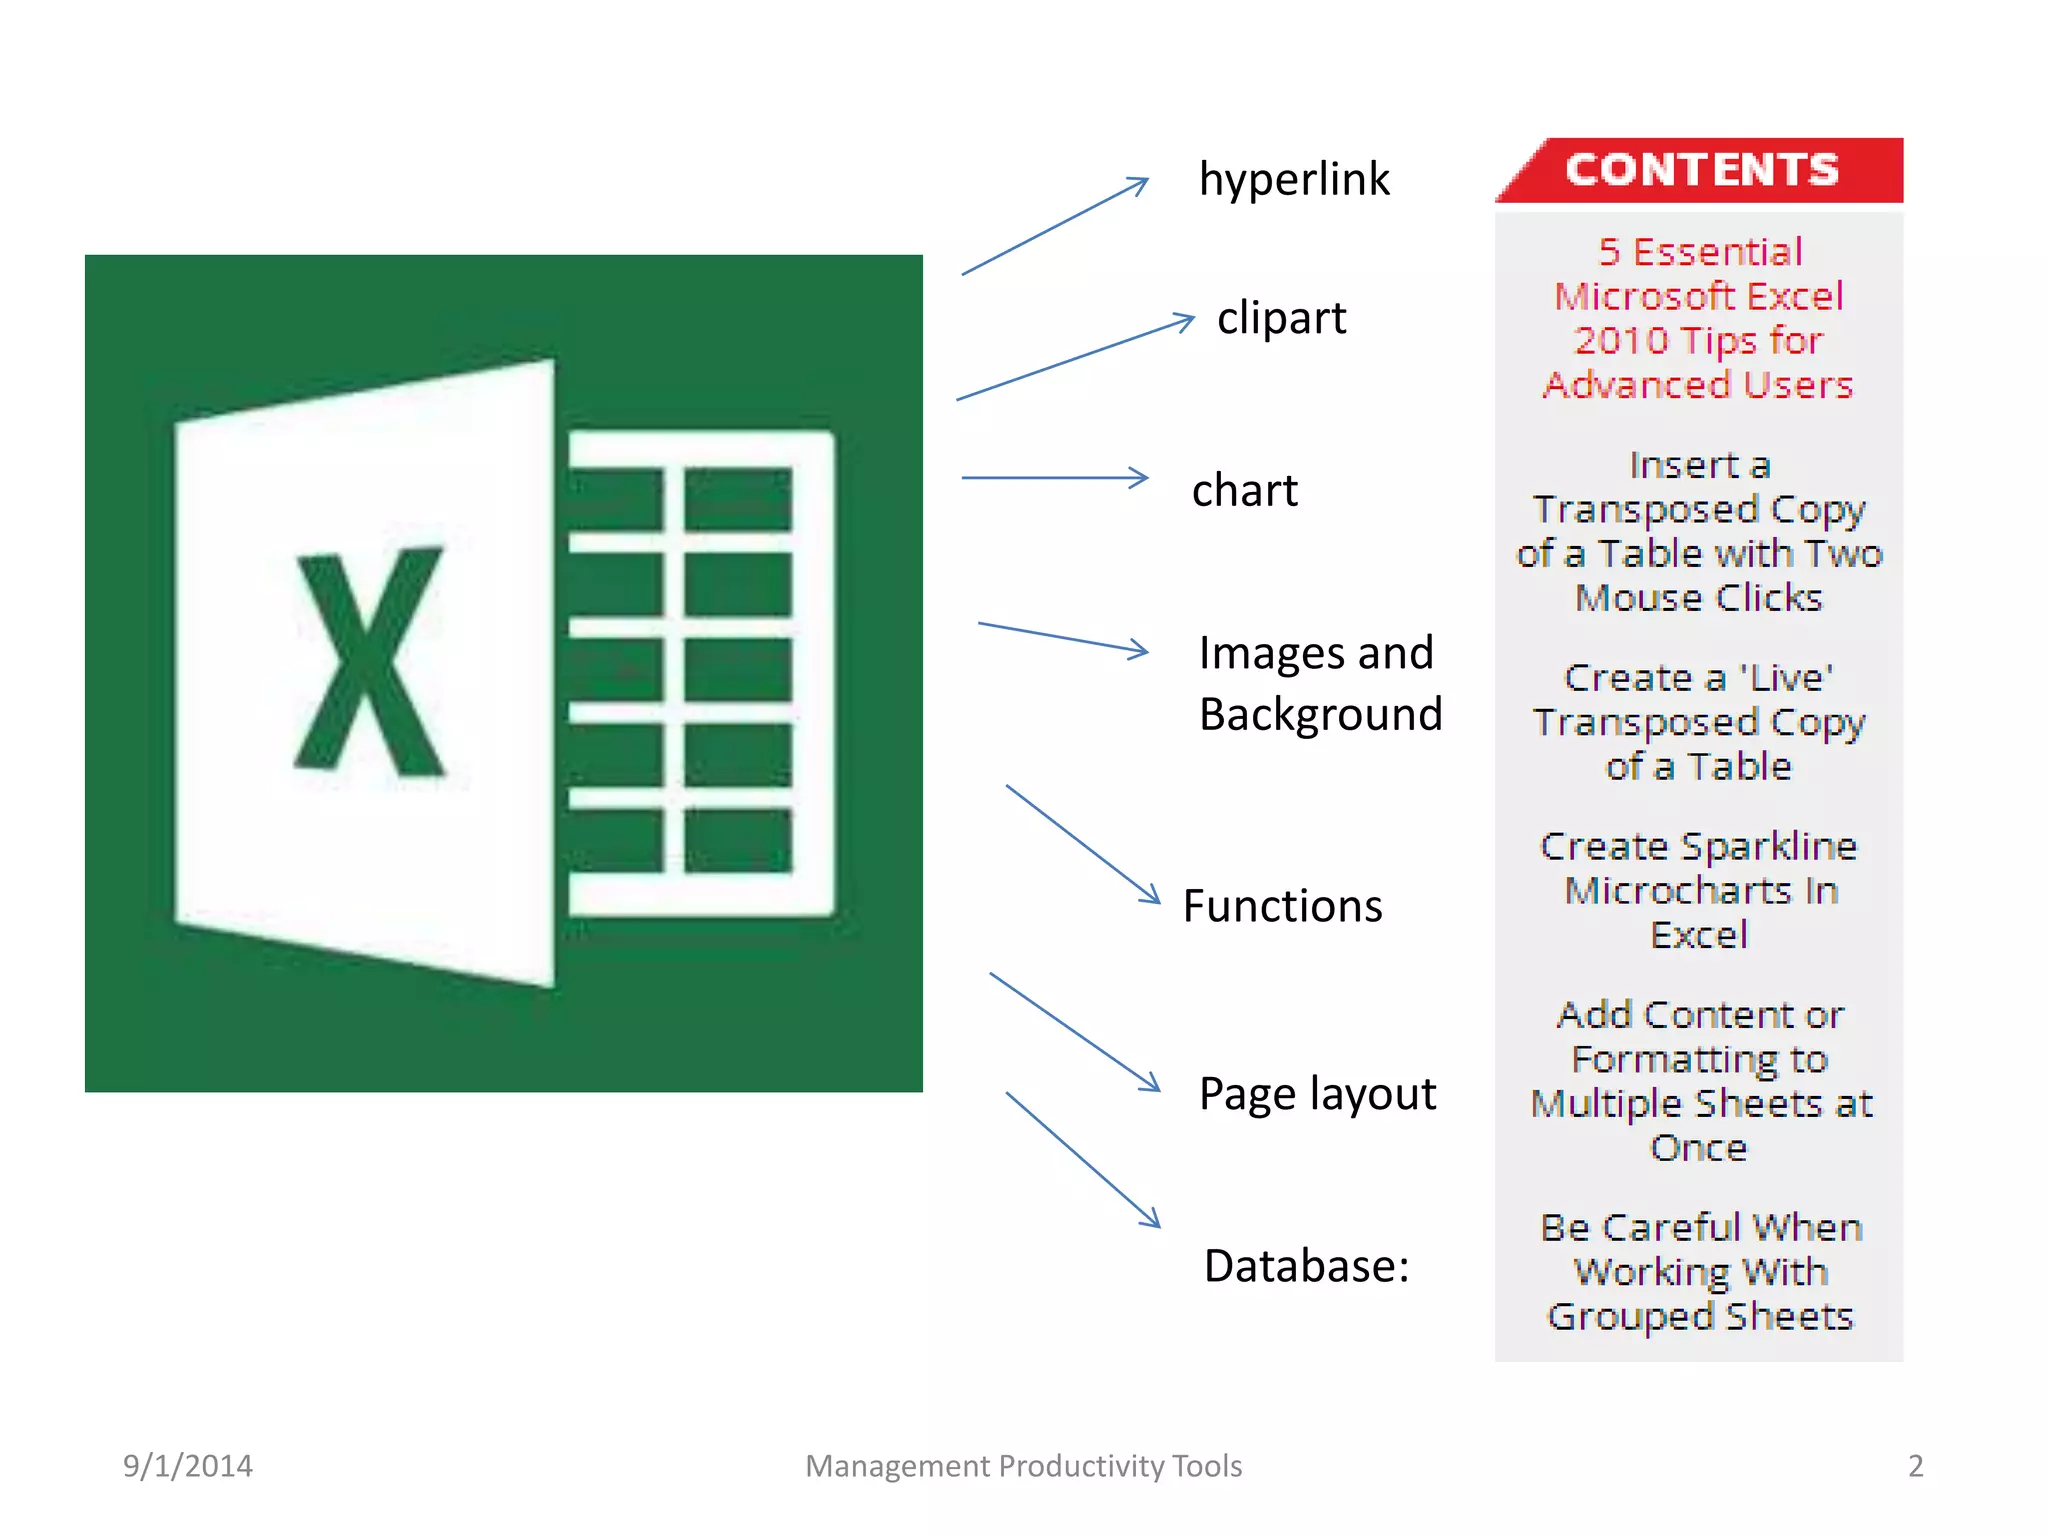
This document provides an overview of productivity tools in Microsoft Excel 2010 and Microsoft Word 2010. It discusses various functions in Excel like AVERAGE, CONCATENATE, SUM, and IF, as well as features of Word 2010 like the universal ribbon interface, Backstage view, paste preview, online Office Web Apps, increased number of themes, and new screenshot and photo editing tools. The document is intended to help users learn to utilize formulas and functions in Excel and features in Word 2010.

![AVERAGE
• AVERAGE function returns the average.
The syntax for the Microsoft Excel AVERAGE
function is
where number1, number2, ... number_n are numeric values -
they can be numbers
AVERAGE function is:
AVERAGE( number1, [number2], ... [number_n] )
9/1/2014 Management Productivity Tools 4](https://image.slidesharecdn.com/managementproductivitytools1-140901001257-phpapp01/75/Management-productivity-tools1-4-2048.jpg)
![SUM
• SUM function adds all numbers in a range of
cells and returns the result.
SUM function is:
SUM( number1, [number2, ... number_n] )
=SUM(C4:C12)
9/1/2014 Management Productivity Tools 6](https://image.slidesharecdn.com/managementproductivitytools1-140901001257-phpapp01/75/Management-productivity-tools1-6-2048.jpg)
![SUMIF
• SUMIF function adds all numbers in a range of
cells, based on a given criteria.
SUMIF function is:
SUMIF( range, criteria, [sum_range] )
Where,
range is the range of cells that you want to apply
the criteria against.
criteria is used to determine which cells to add.
sum_range is optional
9/1/2014 Management Productivity Tools 7](https://image.slidesharecdn.com/managementproductivitytools1-140901001257-phpapp01/75/Management-productivity-tools1-7-2048.jpg)
![IF
• IF function returns one value if a specified condition
evaluates to TRUE, or another value if it evaluates to
FALSE.
IF function is:
IF( condition, [value_if_true], [value_if_false] )
value_if_true is optional. It is the value that is returned
if condition evaluates to TRUE.
value_if_false is optional. It is the value that is return
if condition evaluates to FALSE.
9/1/2014 Management Productivity Tools 8](https://image.slidesharecdn.com/managementproductivitytools1-140901001257-phpapp01/75/Management-productivity-tools1-8-2048.jpg)
![RANK
• Returns the rank of a number in a list of numbers. The
rank of a number is its size relative to other values in a
list.
• Number Required. The number whose rank you want
to find.
• Ref Required. An array of, or a reference to, a list of
numbers. Nonnumeric values in ref are ignored.
• Order Optional. A number specifying how to rank
number.
RANK(number,ref,[order])
9/1/2014 Management Productivity Tools 9](https://image.slidesharecdn.com/managementproductivitytools1-140901001257-phpapp01/75/Management-productivity-tools1-9-2048.jpg)
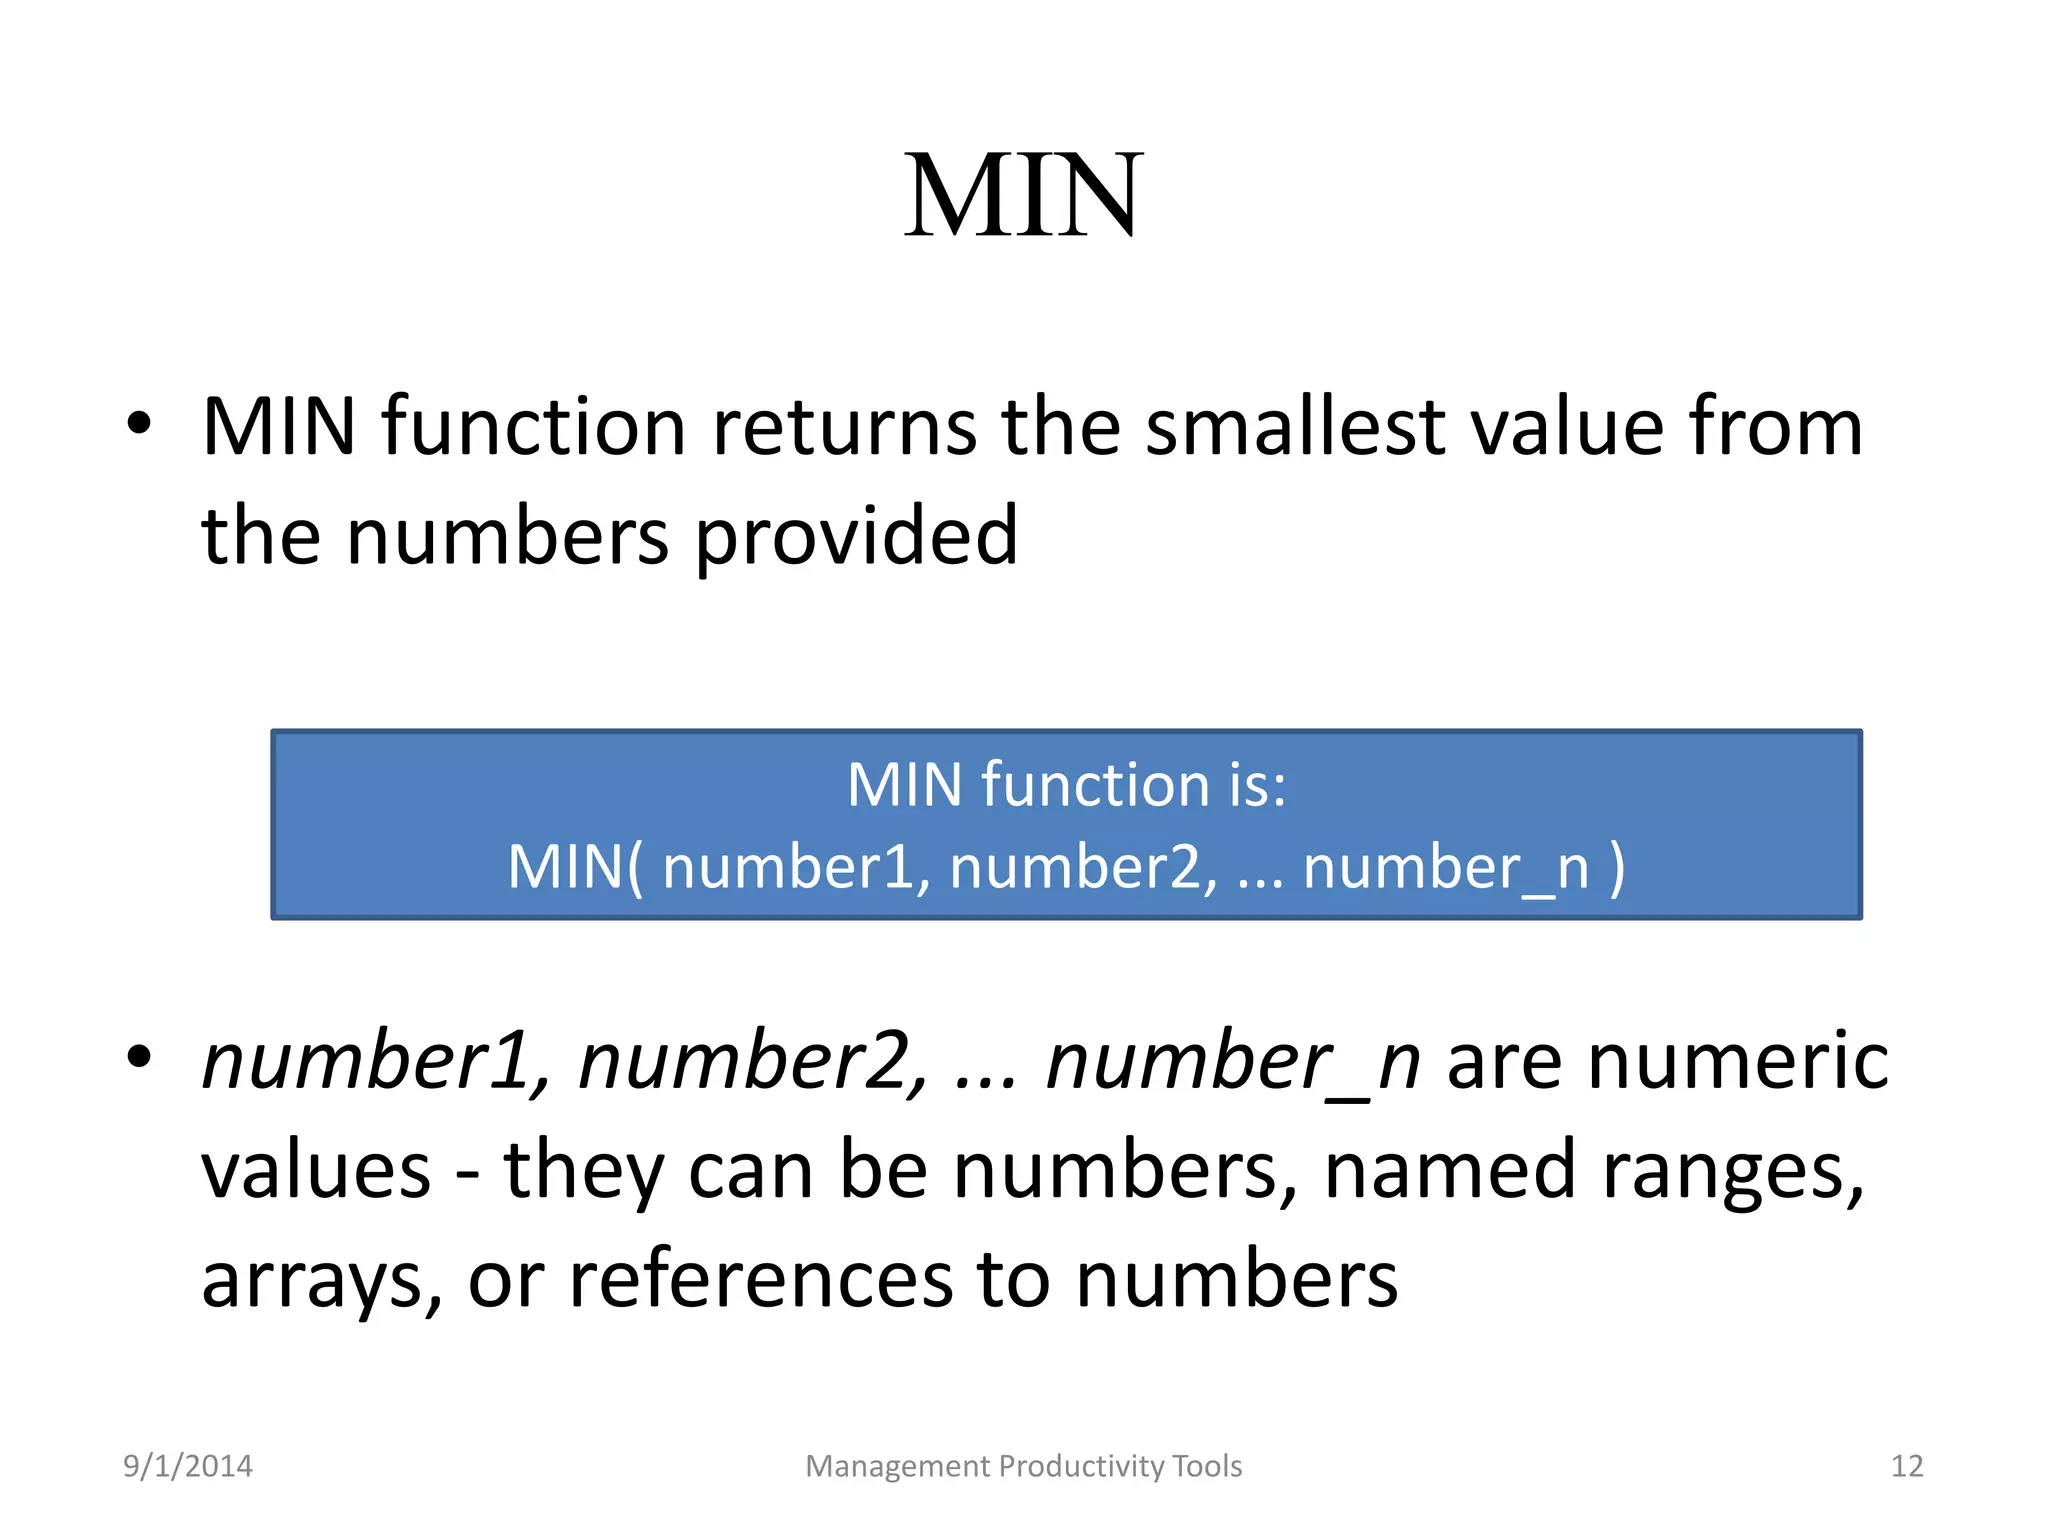
![MAX
• MAX function returns the largest value from
the numbers provided.
MAX function is:
MAX( number1, [number2, ... number_n] )
• number1, number2, ... number_n are numeric
values - they can be numbers, named ranges,
arrays, or references to numbers.
9/1/2014 Management Productivity Tools 11](https://image.slidesharecdn.com/managementproductivitytools1-140901001257-phpapp01/75/Management-productivity-tools1-11-2048.jpg)
![NETWORK DAYS
• NETWORKDAYS function returns the number
of "work days" between 2 dates, excluding
weekends and holidays.
NETWORKDAYS function is:
NETWORKDAYS( start_date, end_date, [holidays] )
9/1/2014 Management Productivity Tools 16](https://image.slidesharecdn.com/managementproductivitytools1-140901001257-phpapp01/75/Management-productivity-tools1-16-2048.jpg)
![LOOKUP
• LOOKUP function returns a value from a range
(one row or one column) or from an array.
LOOKUP function is:
LOOKUP( value, lookup_range,
[result_range]
9/1/2014 Management Productivity Tools 17](https://image.slidesharecdn.com/managementproductivitytools1-140901001257-phpapp01/75/Management-productivity-tools1-17-2048.jpg)
![VLOOKUP
• VLOOKUP function performs a vertical lookup
by searching for a value in the left-most
column of table_array and returning the value
in the same row in the index_number
position.
VLOOKUP function is:
VLOOKUP( value, table_array,
index_number, [not_exact_match]
9/1/2014 Management Productivity Tools 18](https://image.slidesharecdn.com/managementproductivitytools1-140901001257-phpapp01/75/Management-productivity-tools1-18-2048.jpg)
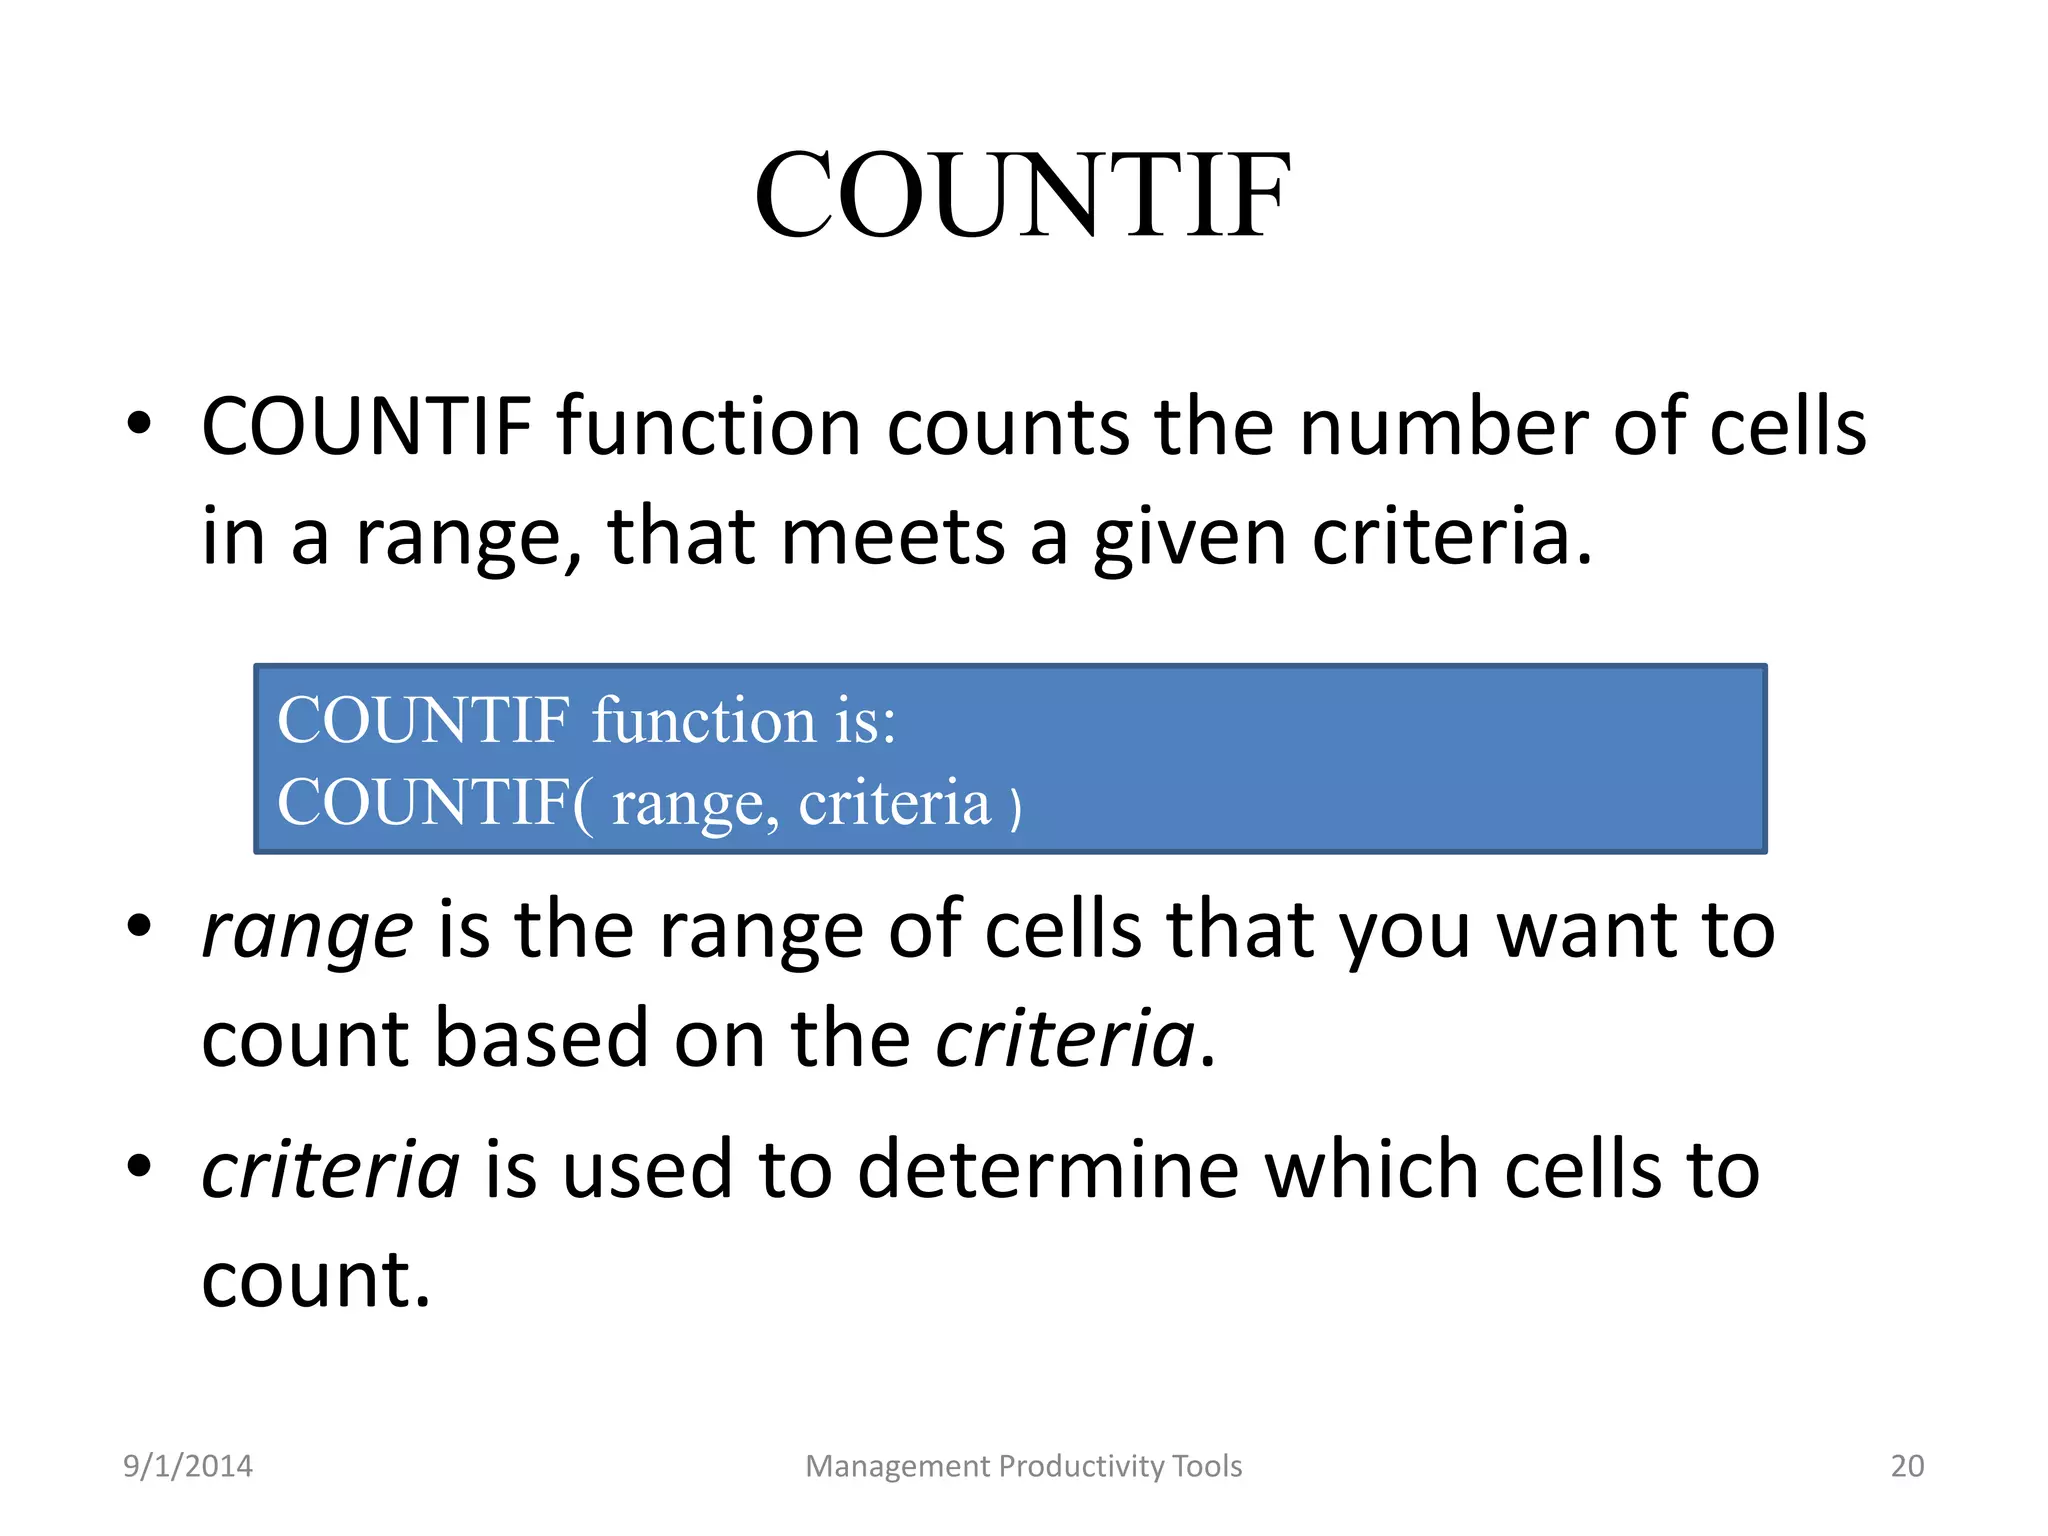
![COUNT
• COUNT function counts the number of cells that
contain numbers as well as the number of
arguments that contain numbers.
COUNT function is:
COUNT( argument1, [argument2,
... argument_n] )
9/1/2014 Management Productivity Tools 19](https://image.slidesharecdn.com/managementproductivitytools1-140901001257-phpapp01/75/Management-productivity-tools1-19-2048.jpg)