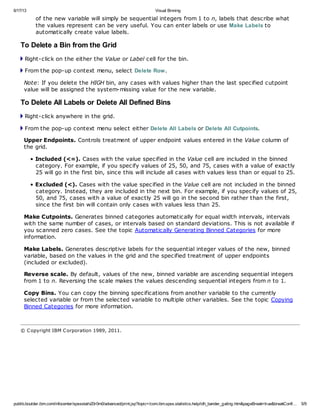
SlideShare a Scribd company logo
6/17/13 Visual Binning
publib.boulder.ibm.com/infocenter/spssstat/v20r0m0/advanced/print.jsp?topic=/com.ibm.spss.statistics.help/idh_bander_gating.htm&pageBreak=true&breakConfi… 1/9
Visual Binning
Contents
1. To Bin Variables
2. Binning Variables
3. Automatically Generating Binned Categories
4. Copying Binned Categories
5. User-Missing Values in Visual Binning
6/17/13 Visual Binning
publib.boulder.ibm.com/infocenter/spssstat/v20r0m0/advanced/print.jsp?topic=/com.ibm.spss.statistics.help/idh_bander_gating.htm&pageBreak=true&breakConfi… 2/9
Visual Binning
Visual Binning is designed to assist you in the process of creating new variables based on
grouping contiguous values of existing variables into a limited number of distinct categories. You
can use Visual Binning to:
• Create categorical variables from continuous scale variables. For example, you could use a
scale income variable to create a new categorical variable that contains income ranges.
• Collapse a large number of ordinal categories into a smaller set of categories. For example, you
could collapse a rating scale of nine down to three categories representing low, medium, and
high.
In the first step, you:
Select the numeric scale and/or ordinal variables for which you want to create new categorical
(binned) variables.
Optionally, you can limit the number of cases to scan. For data files with a large number of
cases, limiting the number of cases scanned can save time, but you should avoid this if possible
because it will affect the distribution of values used in subsequent calculations in Visual Binning.
Note: String variables and nominal numeric variables are not displayed in the source variable list.
Visual Binning requires numeric variables, measured on either a scale or ordinal level, since it
assumes that the data values represent some logical order that can be used to group values in a
meaningful fashion. You can change the defined measurement level of a variable in Variable View
in the Data Editor. See the topic Variable measurement level for more information.
© Copyright IBM Corporation 1989, 2011.
6/17/13 Visual Binning
publib.boulder.ibm.com/infocenter/spssstat/v20r0m0/advanced/print.jsp?topic=/com.ibm.spss.statistics.help/idh_bander_gating.htm&pageBreak=true&breakConfi… 3/9
1. To Bin Variables
From the menus in the Data Editor window choose:
Transform > Visual Binning...
Select the numeric scale and/or ordinal variables for which you want to create new categorical
(binned) variables.
Note: String variables and nominal numeric variables are not displayed in the source variable list.
Visual Binning requires numeric variables, measured on either a scale or ordinal level, since it
assume that the data values represent some logical order that can be used to group values in a
meaningful fashion.
Select a variable in the Scanned Variable List.
Enter a name for the new binned variable. Variable names must be unique and must follow variable
naming rules. See the topic Variable names for more information.
Define the binning criteria for the new variable. See the topic Binning Variables for more
information.
Click OK.
© Copyright IBM Corporation 1989, 2011.
6/17/13 Visual Binning
publib.boulder.ibm.com/infocenter/spssstat/v20r0m0/advanced/print.jsp?topic=/com.ibm.spss.statistics.help/idh_bander_gating.htm&pageBreak=true&breakConfi… 4/9
2. Binning Variables
The Visual Binning main dialog box provides the following information for the scanned variables:
Scanned Variable List. Displays the variables you selected in the initial dialog box. You can sort
the list by measurement level (scale or ordinal) or by variable label or name by clicking on the
column headings.
Cases Scanned. Indicates the number of cases scanned. All scanned cases without user-
missing or system-missing values for the selected variable are used to generate the distribution
of values used in calculations in Visual Binning, including the histogram displayed in the main
dialog box and cutpoints based on percentiles or standard deviation units.
Missing Values. Indicates the number of scanned cases with user-missing or system-missing
values. Missing values are not included in any of the binned categories. See the topic User-
Missing Values in Visual Binning for more information.
Current Variable. The name and variable label (if any) for the currently selected variable that
will be used as the basis for the new, binned variable.
Binned Variable. Name and optional variable label for the new, binned variable.
• Name. You must enter a name for the new variable. Variable names must be unique and must
follow variable naming rules. See the topic Variable names for more information.
• Label. You can enter a descriptive variable label up to 255 characters long. The default
variable label is the variable label (if any) or variable name of the source variable with (Binned)
appended to the end of the label.
Minimum and Maximum. Minimum and maximum values for the currently selected variable,
based on the scanned cases and not including values defined as user-missing.
Nonmissing Values. The histogram displays the distribution of nonmissing values for the
currently selected variable, based on the scanned cases.
• After you define bins for the new variable, vertical lines on the histogram are displayed to
indicate the cutpoints that define bins.
• You can click and drag the cutpoint lines to different locations on the histogram, changing the
bin ranges.
• You can remove bins by dragging cutpoint lines off the histogram.
Note: The histogram (displaying nonmissing values), the minimum, and the maximum are based on
the scanned values. If you do not include all cases in the scan, the true distribution may not be
accurately reflected, particularly if the data file has been sorted by the selected variable. If you
scan zero cases, no information about the distribution of values is available.
Grid. Displays the values that define the upper endpoints of each bin and optional value labels
for each bin.
• Value. The values that define the upper endpoints of each bin. You can enter values or use
Make Cutpoints to automatically create bins based on selected criteria. By default, a cutpoint
with a value of HIGH is automatically included. This bin will contain any nonmissing values
above the other cutpoints. The bin defined by the lowest cutpoint will include all nonmissing
values lower than or equal to that value (or simply lower than that value, depending on how
you define upper endpoints).
• Label. Optional, descriptive labels for the values of the new, binned variable. Since the values
6/17/13 Visual Binning
publib.boulder.ibm.com/infocenter/spssstat/v20r0m0/advanced/print.jsp?topic=/com.ibm.spss.statistics.help/idh_bander_gating.htm&pageBreak=true&breakConfi… 5/9
of the new variable will simply be sequential integers from 1 to n, labels that describe what
the values represent can be very useful. You can enter labels or use Make Labels to
automatically create value labels.
To Delete a Bin from the Grid
Right-click on the either the Value or Label cell for the bin.
From the pop-up context menu, select Delete Row.
Note: If you delete the HIGH bin, any cases with values higher than the last specified cutpoint
value will be assigned the system-missing value for the new variable.
To Delete All Labels or Delete All Defined Bins
Right-click anywhere in the grid.
From the pop-up context menu select either Delete All Labels or Delete All Cutpoints.
Upper Endpoints. Controls treatment of upper endpoint values entered in the Value column of
the grid.
• Included (<=). Cases with the value specified in the Value cell are included in the binned
category. For example, if you specify values of 25, 50, and 75, cases with a value of exactly
25 will go in the first bin, since this will include all cases with values less than or equal to 25.
• Excluded (<). Cases with the value specified in the Value cell are not included in the binned
category. Instead, they are included in the next bin. For example, if you specify values of 25,
50, and 75, cases with a value of exactly 25 will go in the second bin rather than the first,
since the first bin will contain only cases with values less than 25.
Make Cutpoints. Generates binned categories automatically for equal width intervals, intervals
with the same number of cases, or intervals based on standard deviations. This is not available if
you scanned zero cases. See the topic Automatically Generating Binned Categories for more
information.
Make Labels. Generates descriptive labels for the sequential integer values of the new, binned
variable, based on the values in the grid and the specified treatment of upper endpoints
(included or excluded).
Reverse scale. By default, values of the new, binned variable are ascending sequential integers
from 1 to n. Reversing the scale makes the values descending sequential integers from n to 1.
Copy Bins. You can copy the binning specifications from another variable to the currently
selected variable or from the selected variable to multiple other variables. See the topic Copying
Binned Categories for more information.
© Copyright IBM Corporation 1989, 2011.
6/17/13 Visual Binning
publib.boulder.ibm.com/infocenter/spssstat/v20r0m0/advanced/print.jsp?topic=/com.ibm.spss.statistics.help/idh_bander_gating.htm&pageBreak=true&breakConfi… 6/9
3. Automatically Generating Binned Categories
The Make Cutpoints dialog box allows you to auto-generate binned categories based on selected
criteria.
To Use the Make Cutpoints Dialog Box
From the menus in the Data Editor window choose:
Transform > Visual Binning...
Select the numeric scale and/or ordinal variables for which you want to create new categorical
(binned) variables.
Click Continue.
Select (click) a variable in the Scanned Variable List.
Click Make Cutpoints.
Select the criteria for generating cutpoints that will define the binned categories.
Click Apply.
Note: The Make Cutpoints dialog box is not available if you scanned zero cases.
Equal Width Intervals. Generates binned categories of equal width (for example, 1–10, 11–20,
and 21–30) based on any two of the following three criteria:
• First Cutpoint Location. The value that defines the upper end of the lowest binned category
(for example, a value of 10 indicates a range that includes all values up to 10).
• Number of Cutpoints. The number of binned categories is the number of cutpoints plus one.
For example, 9 cutpoints generate 10 binned categories.
• Width. The width of each interval. For example, a value of 10 would bin age in years into 10-
year intervals.
Equal Percentiles Based on Scanned Cases. Generates binned categories with an equal
number of cases in each bin (using the aempirical algorithm for percentiles), based on either
of the following criteria:
• Number of Cutpoints. The number of binned categories is the number of cutpoints plus one.
For example, three cutpoints generate four percentile bins (quartiles), each containing 25% of
the cases.
• Width (%). Width of each interval, expressed as a percentage of the total number of cases.
For example, a value of 33.3 would produce three binned categories (two cutpoints), each
containing 33.3% of the cases.
If the source variable contains a relatively small number of distinct values or a large number of
cases with the same value, you may get fewer bins than requested. If there are multiple
identical values at a cutpoint, they will all go into the same interval; so the actual percentages
may not always be exactly equal.
Cutpoints at Mean and Selected Standard Deviations Based on Scanned Cases. Generates
binned categories based on the values of the mean and standard deviation of the distribution of
the variable.
6/17/13 Visual Binning
publib.boulder.ibm.com/infocenter/spssstat/v20r0m0/advanced/print.jsp?topic=/com.ibm.spss.statistics.help/idh_bander_gating.htm&pageBreak=true&breakConfi… 7/9
• If you don't select any of the standard deviation intervals, two binned categories will be
created, with the mean as the cutpoint dividing the bins.
• You can select any combination of standard deviation intervals based on one, two, and/or
three standard deviations. For example, selecting all three would result in eight binned
categories--six bins in one standard deviation intervals and two bins for cases more than
three standard deviations above and below the mean.
In a normal distribution, 68% of the cases fall within one standard deviation of the mean; 95%,
within two standard deviations; and 99%, within three standard deviations. Creating binned
categories based on standard deviations may result in some defined bins outside of the actual
data range and even outside of the range of possible data values (for example, a negative salary
range).
Note: Calculations of percentiles and standard deviations are based on the scanned cases. If
you limit the number of cases scanned, the resulting bins may not contain the proportion of
cases that you wanted in those bins, particularly if the data file is sorted by the source variable.
For example, if you limit the scan to the first 100 cases of a data file with 1000 cases and the
data file is sorted in ascending order of age of respondent, instead of four percentile age bins
each containing 25% of the cases, you may find that the first three bins each contain only
about 3.3% of the cases, and the last bin contains 90% of the cases.
© Copyright IBM Corporation 1989, 2011.
6/17/13 Visual Binning
publib.boulder.ibm.com/infocenter/spssstat/v20r0m0/advanced/print.jsp?topic=/com.ibm.spss.statistics.help/idh_bander_gating.htm&pageBreak=true&breakConfi… 8/9
4. Copying Binned Categories
When creating binned categories for one or more variables, you can copy the binning
specifications from another variable to the currently selected variable or from the selected
variable to multiple other variables.
To Copy Binning Specifications
From the menus in the Data Editor window choose:
Transform > Visual Binning...
Select the numeric scale and/or ordinal variables for which you want to create new categorical
(binned) variables.
Click Continue.
Define binned categories for at least one variable--but do not click OK or Paste.
Select (click) a variable in the Scanned Variable List for which you have defined binned
categories.
Click To Other Variables.
Select the variables for which you want to create new variables with the same binned categories.
Click Copy.
or
Select (click) a variable in the Scanned Variable List to which you want to copy defined binned
categories.
Click From Another Variable.
Select the variable with the defined binned categories that you want to copy.
Click Copy.
If you have specified value labels for the variable from which you are copying the binning
specifications, those are also copied.
Note: Once you click OK in the Visual Binning main dialog box to create new binned variables (or
close the dialog box in any other way), you cannot use Visual Binning to copy those binned
categories to other variables.
© Copyright IBM Corporation 1989, 2011.
6/17/13 Visual Binning
publib.boulder.ibm.com/infocenter/spssstat/v20r0m0/advanced/print.jsp?topic=/com.ibm.spss.statistics.help/idh_bander_gating.htm&pageBreak=true&breakConfi… 9/9
5. User-Missing Values in Visual Binning
Values defined as user-missing (values identified as codes for missing data) for the source
variable are not included in the binned categories for the new variable. User-missing values for
the source variables are copied as user-missing values for the new variable, and any defined
value labels for missing value codes are also copied.
If a missing value code conflicts with one of the binned category values for the new variable, the
missing value code for the new variable is recoded to a nonconflicting value by adding 100 to the
highest binned category value. For example, if a value of 1 is defined as user-missing for the
source variable and the new variable will have six binned categories, any cases with a value of 1
for the source variable will have a value of 106 for the new variable, and 106 will be defined as
user-missing. If the user-missing value for the source variable had a defined value label, that
label will be retained as the value label for the recoded value of the new variable.
Note: If the source variable has a defined range of user-missing values of the form LO-n, where
n is a positive number, the corresponding user-missing values for the new variable will be
negative numbers.
© Copyright IBM Corporation 1989, 2011.

More Related Content

What's hot

Chapter 3.Working Capital Management.ppt
Chapter 3.Working Capital Management.pptChapter 3.Working Capital Management.ppt
Chapter 3.Working Capital Management.ppt
ZahraMirzayeva
 
Capital market theory
Capital market theoryCapital market theory
Capital market theoryStudent
 
Behavioral finance
Behavioral financeBehavioral finance
Behavioral finance
Ekrem Tufan
 
Cost of Retained Earnings
Cost of Retained EarningsCost of Retained Earnings
Cost of Retained Earnings
Megha Anilkumar
 
Capital budgeting
Capital budgetingCapital budgeting
Capital budgeting
N A M COLLEGE KALLIKKANDY
 
Investment management intro
Investment management   introInvestment management   intro
Investment management intro
Ahmed Zaidi, CMA
 
ACTIVE AND PASSIVE STRATIGIES OF INVESTMENT
ACTIVE AND PASSIVE STRATIGIES OF INVESTMENTACTIVE AND PASSIVE STRATIGIES OF INVESTMENT
ACTIVE AND PASSIVE STRATIGIES OF INVESTMENT
Sami Swati
 
BEHAVIOURAL PORTFOLIO THEORY.pptx
BEHAVIOURAL PORTFOLIO THEORY.pptxBEHAVIOURAL PORTFOLIO THEORY.pptx
BEHAVIOURAL PORTFOLIO THEORY.pptx
bhatt7
 
Underwriting
UnderwritingUnderwriting
Underwriting
Pranav Sharma
 
Security Market Line
Security Market LineSecurity Market Line
Security Market Line
efinancemanagement.com
 
Retained earnings
Retained earningsRetained earnings
Retained earnings
Czarina Patalod
 
Mutual fund and its types
Mutual fund and its typesMutual fund and its types
Mutual fund and its types
Gurmeet Virk
 
Types of investment
Types of investmentTypes of investment
behavioral finance:theories, issues and challenges
behavioral finance:theories, issues and challenges behavioral finance:theories, issues and challenges
behavioral finance:theories, issues and challenges
Kamaljit Singh
 
Barriers to Entry and Exit
Barriers to Entry and ExitBarriers to Entry and Exit
Barriers to Entry and Exit
tutor2u
 
Fundamental analysis ppt
Fundamental analysis pptFundamental analysis ppt
Fundamental analysis pptDharmik
 
DIVIDEND PAYOUT RATIO
DIVIDEND PAYOUT RATIODIVIDEND PAYOUT RATIO
DIVIDEND PAYOUT RATIO
Shakti Yadav
 
Valuation methods used in mergers & acquisitions
Valuation methods used in mergers & acquisitionsValuation methods used in mergers & acquisitions
Valuation methods used in mergers & acquisitionsRS P
 

What's hot (20)

Chapter 3.Working Capital Management.ppt
Chapter 3.Working Capital Management.pptChapter 3.Working Capital Management.ppt
Chapter 3.Working Capital Management.ppt
 
Capital market theory
Capital market theoryCapital market theory
Capital market theory
 
Behavioral finance
Behavioral financeBehavioral finance
Behavioral finance
 
Cost of Retained Earnings
Cost of Retained EarningsCost of Retained Earnings
Cost of Retained Earnings
 
Capital budgeting
Capital budgetingCapital budgeting
Capital budgeting
 
Treynor ratio
Treynor ratioTreynor ratio
Treynor ratio
 
Investment management intro
Investment management   introInvestment management   intro
Investment management intro
 
ACTIVE AND PASSIVE STRATIGIES OF INVESTMENT
ACTIVE AND PASSIVE STRATIGIES OF INVESTMENTACTIVE AND PASSIVE STRATIGIES OF INVESTMENT
ACTIVE AND PASSIVE STRATIGIES OF INVESTMENT
 
BEHAVIOURAL PORTFOLIO THEORY.pptx
BEHAVIOURAL PORTFOLIO THEORY.pptxBEHAVIOURAL PORTFOLIO THEORY.pptx
BEHAVIOURAL PORTFOLIO THEORY.pptx
 
Underwriting
UnderwritingUnderwriting
Underwriting
 
Security Market Line
Security Market LineSecurity Market Line
Security Market Line
 
Retained earnings
Retained earningsRetained earnings
Retained earnings
 
Mutual fund and its types
Mutual fund and its typesMutual fund and its types
Mutual fund and its types
 
Classification of shares
Classification of sharesClassification of shares
Classification of shares
 
Types of investment
Types of investmentTypes of investment
Types of investment
 
behavioral finance:theories, issues and challenges
behavioral finance:theories, issues and challenges behavioral finance:theories, issues and challenges
behavioral finance:theories, issues and challenges
 
Barriers to Entry and Exit
Barriers to Entry and ExitBarriers to Entry and Exit
Barriers to Entry and Exit
 
Fundamental analysis ppt
Fundamental analysis pptFundamental analysis ppt
Fundamental analysis ppt
 
DIVIDEND PAYOUT RATIO
DIVIDEND PAYOUT RATIODIVIDEND PAYOUT RATIO
DIVIDEND PAYOUT RATIO
 
Valuation methods used in mergers & acquisitions
Valuation methods used in mergers & acquisitionsValuation methods used in mergers & acquisitions
Valuation methods used in mergers & acquisitions
 

Viewers also liked

Spss
SpssSpss
Spsscipno
 
Spss lesson #4.3 quan ly file so lieu (phan 3 8 manipulating_data)
Spss lesson #4.3 quan ly file so lieu (phan 3 8 manipulating_data)Spss lesson #4.3 quan ly file so lieu (phan 3 8 manipulating_data)
Spss lesson #4.3 quan ly file so lieu (phan 3 8 manipulating_data)
Si Thinh Hoang
 
Using Spss Transforming Variable - Compute
Using Spss Transforming Variable - ComputeUsing Spss Transforming Variable - Compute
Using Spss Transforming Variable - ComputeDr Ali Yusob Md Zain
 
Producción del Biocarbón
Producción del BiocarbónProducción del Biocarbón
Producción del Biocarbón
Concurso Innova Bolivia
 
Wimax Pakistan Case Study
Wimax Pakistan Case StudyWimax Pakistan Case Study
Wimax Pakistan Case Study
Muljati Muli
 
Wireless home networks (11)
Wireless home networks (11)Wireless home networks (11)
Wireless home networks (11)ayshariasat
 
Dogs & kids
Dogs & kidsDogs & kids
Dogs & kids
wakey456
 
How to make team collaboration suck less!
How to make team collaboration suck less!How to make team collaboration suck less!
How to make team collaboration suck less!
Brian LaMee
 
This is Bixti
This is BixtiThis is Bixti
This is Bixti
Alexis Caporale
 
B'dAfrique newco biocarbon 1
B'dAfrique  newco biocarbon 1B'dAfrique  newco biocarbon 1
B'dAfrique newco biocarbon 1
Ian Christopher Coates
 
Fear of Cancer? Fear the "Hot Dog" Not the Billroth II
Fear of Cancer? Fear the "Hot Dog" Not the Billroth IIFear of Cancer? Fear the "Hot Dog" Not the Billroth II
Fear of Cancer? Fear the "Hot Dog" Not the Billroth II
Dr. Robert Rutledge
 
Zagor - 002 - rijecni duh part 2
Zagor - 002 - rijecni duh part 2Zagor - 002 - rijecni duh part 2
Zagor - 002 - rijecni duh part 2Blagojce Treneski
 
Bizi bizi 14-17
Bizi bizi 14-17Bizi bizi 14-17
Bizi bizi 14-17
Karkara Aldizkaria
 
Carmen - Bizet
Carmen - BizetCarmen - Bizet
Carmen - Bizetstela s
 
Blacharz samochodowy
Blacharz samochodowyBlacharz samochodowy
Space Policy - Vis Viva - 10th bi-weekly meeting - August 7, 2013
Space Policy - Vis Viva - 10th bi-weekly meeting - August 7, 2013Space Policy - Vis Viva - 10th bi-weekly meeting - August 7, 2013
Space Policy - Vis Viva - 10th bi-weekly meeting - August 7, 2013
Society Vis Viva
 

Viewers also liked (20)

Spss
SpssSpss
Spss
 
Spss lesson #4.3 quan ly file so lieu (phan 3 8 manipulating_data)
Spss lesson #4.3 quan ly file so lieu (phan 3 8 manipulating_data)Spss lesson #4.3 quan ly file so lieu (phan 3 8 manipulating_data)
Spss lesson #4.3 quan ly file so lieu (phan 3 8 manipulating_data)
 
Using Spss Transforming Variable - Compute
Using Spss Transforming Variable - ComputeUsing Spss Transforming Variable - Compute
Using Spss Transforming Variable - Compute
 
HTML5 Web Security
HTML5 Web SecurityHTML5 Web Security
HTML5 Web Security
 
Onc more scan
Onc more scanOnc more scan
Onc more scan
 
Producción del Biocarbón
Producción del BiocarbónProducción del Biocarbón
Producción del Biocarbón
 
Wimax Pakistan Case Study
Wimax Pakistan Case StudyWimax Pakistan Case Study
Wimax Pakistan Case Study
 
Wireless home networks (11)
Wireless home networks (11)Wireless home networks (11)
Wireless home networks (11)
 
Dogs & kids
Dogs & kidsDogs & kids
Dogs & kids
 
How to make team collaboration suck less!
How to make team collaboration suck less!How to make team collaboration suck less!
How to make team collaboration suck less!
 
This is Bixti
This is BixtiThis is Bixti
This is Bixti
 
B'dAfrique newco biocarbon 1
B'dAfrique  newco biocarbon 1B'dAfrique  newco biocarbon 1
B'dAfrique newco biocarbon 1
 
Biseri
BiseriBiseri
Biseri
 
Fear of Cancer? Fear the "Hot Dog" Not the Billroth II
Fear of Cancer? Fear the "Hot Dog" Not the Billroth IIFear of Cancer? Fear the "Hot Dog" Not the Billroth II
Fear of Cancer? Fear the "Hot Dog" Not the Billroth II
 
Zagor - 002 - rijecni duh part 2
Zagor - 002 - rijecni duh part 2Zagor - 002 - rijecni duh part 2
Zagor - 002 - rijecni duh part 2
 
Bizi bizi 14-17
Bizi bizi 14-17Bizi bizi 14-17
Bizi bizi 14-17
 
Carmen - Bizet
Carmen - BizetCarmen - Bizet
Carmen - Bizet
 
Blacharz samochodowy
Blacharz samochodowyBlacharz samochodowy
Blacharz samochodowy
 
Fast Pitch Forum (Picnik)
Fast Pitch Forum (Picnik)Fast Pitch Forum (Picnik)
Fast Pitch Forum (Picnik)
 
Space Policy - Vis Viva - 10th bi-weekly meeting - August 7, 2013
Space Policy - Vis Viva - 10th bi-weekly meeting - August 7, 2013Space Policy - Vis Viva - 10th bi-weekly meeting - August 7, 2013
Space Policy - Vis Viva - 10th bi-weekly meeting - August 7, 2013
 

Similar to Visual binning

OBIEE 12c Advanced Analytic Functions
OBIEE 12c Advanced Analytic FunctionsOBIEE 12c Advanced Analytic Functions
OBIEE 12c Advanced Analytic FunctionsMichael Perhats
 
Financial reporting rpd using obiee
Financial reporting rpd using obieeFinancial reporting rpd using obiee
Financial reporting rpd using obieeAmit Sharma
 
Financial reporting rpd using obiee
Financial reporting rpd using obieeFinancial reporting rpd using obiee
Financial reporting rpd using obieeAmit Sharma
 
Financial reporting rpd using obiee
Financial reporting rpd using obieeFinancial reporting rpd using obiee
Financial reporting rpd using obieeAmit Sharma
 
Obiee interview questions and answers faq
Obiee interview questions and answers faqObiee interview questions and answers faq
Obiee interview questions and answers faqmaheshboggula
 
BEX.pptx
BEX.pptxBEX.pptx
BEX.pptx
Phani163371
 
Revit drafting procedure
Revit drafting procedureRevit drafting procedure
Revit drafting procedure
Anima M C
 
Geo prompt dashboard
Geo prompt dashboardGeo prompt dashboard
Geo prompt dashboardAmit Sharma
 
4. chapter iv(transform)
4. chapter iv(transform)4. chapter iv(transform)
4. chapter iv(transform)
Chhom Karath
 
Combo box and List box in VB.Net.ppt
Combo box and List box in VB.Net.pptCombo box and List box in VB.Net.ppt
Combo box and List box in VB.Net.ppt
Ujwala Junghare
 
Birt crosstabtutorialadvanced
Birt crosstabtutorialadvancedBirt crosstabtutorialadvanced
Birt crosstabtutorialadvanced
Supratim Ray
 
Easy Pivot Tutorial June 2020
Easy Pivot Tutorial June 2020Easy Pivot Tutorial June 2020
Easy Pivot Tutorial June 2020
Adhi Wikantyoso
 
A Skills Approach Excel 2016 Chapter 8 Exploring Advanced D.docx
A Skills Approach Excel 2016  Chapter 8 Exploring Advanced D.docxA Skills Approach Excel 2016  Chapter 8 Exploring Advanced D.docx
A Skills Approach Excel 2016 Chapter 8 Exploring Advanced D.docx
daniahendric
 
Let’s Discover What Are Revit Annotations
Let’s Discover What Are Revit AnnotationsLet’s Discover What Are Revit Annotations
Let’s Discover What Are Revit Annotations
NI BT
 
Create a basic performance point dashboard epc
Create a basic performance point dashboard   epcCreate a basic performance point dashboard   epc
Create a basic performance point dashboard epcEPC Group
 
Constraint Based Configuration Model Explained
Constraint Based Configuration Model ExplainedConstraint Based Configuration Model Explained
Constraint Based Configuration Model Explained
Anita Shelburn Smallwood
 
IntoTheNebulaArticle.pdf
IntoTheNebulaArticle.pdfIntoTheNebulaArticle.pdf
IntoTheNebulaArticle.pdf
David Harrison
 
IntoTheNebulaArticle.pdf
IntoTheNebulaArticle.pdfIntoTheNebulaArticle.pdf
IntoTheNebulaArticle.pdf
David Harrison
 
Exam view dynamic recalculation files
Exam view dynamic recalculation filesExam view dynamic recalculation files
Exam view dynamic recalculation files
William McIntosh
 
Functional Coverage Development Tips - Mentor Graphics
Functional Coverage Development Tips - Mentor GraphicsFunctional Coverage Development Tips - Mentor Graphics
Functional Coverage Development Tips - Mentor Graphics
eInfochips (An Arrow Company)
 

Similar to Visual binning (20)

OBIEE 12c Advanced Analytic Functions
OBIEE 12c Advanced Analytic FunctionsOBIEE 12c Advanced Analytic Functions
OBIEE 12c Advanced Analytic Functions
 
Financial reporting rpd using obiee
Financial reporting rpd using obieeFinancial reporting rpd using obiee
Financial reporting rpd using obiee
 
Financial reporting rpd using obiee
Financial reporting rpd using obieeFinancial reporting rpd using obiee
Financial reporting rpd using obiee
 
Financial reporting rpd using obiee
Financial reporting rpd using obieeFinancial reporting rpd using obiee
Financial reporting rpd using obiee
 
Obiee interview questions and answers faq
Obiee interview questions and answers faqObiee interview questions and answers faq
Obiee interview questions and answers faq
 
BEX.pptx
BEX.pptxBEX.pptx
BEX.pptx
 
Revit drafting procedure
Revit drafting procedureRevit drafting procedure
Revit drafting procedure
 
Geo prompt dashboard
Geo prompt dashboardGeo prompt dashboard
Geo prompt dashboard
 
4. chapter iv(transform)
4. chapter iv(transform)4. chapter iv(transform)
4. chapter iv(transform)
 
Combo box and List box in VB.Net.ppt
Combo box and List box in VB.Net.pptCombo box and List box in VB.Net.ppt
Combo box and List box in VB.Net.ppt
 
Birt crosstabtutorialadvanced
Birt crosstabtutorialadvancedBirt crosstabtutorialadvanced
Birt crosstabtutorialadvanced
 
Easy Pivot Tutorial June 2020
Easy Pivot Tutorial June 2020Easy Pivot Tutorial June 2020
Easy Pivot Tutorial June 2020
 
A Skills Approach Excel 2016 Chapter 8 Exploring Advanced D.docx
A Skills Approach Excel 2016  Chapter 8 Exploring Advanced D.docxA Skills Approach Excel 2016  Chapter 8 Exploring Advanced D.docx
A Skills Approach Excel 2016 Chapter 8 Exploring Advanced D.docx
 
Let’s Discover What Are Revit Annotations
Let’s Discover What Are Revit AnnotationsLet’s Discover What Are Revit Annotations
Let’s Discover What Are Revit Annotations
 
Create a basic performance point dashboard epc
Create a basic performance point dashboard   epcCreate a basic performance point dashboard   epc
Create a basic performance point dashboard epc
 
Constraint Based Configuration Model Explained
Constraint Based Configuration Model ExplainedConstraint Based Configuration Model Explained
Constraint Based Configuration Model Explained
 
IntoTheNebulaArticle.pdf
IntoTheNebulaArticle.pdfIntoTheNebulaArticle.pdf
IntoTheNebulaArticle.pdf
 
IntoTheNebulaArticle.pdf
IntoTheNebulaArticle.pdfIntoTheNebulaArticle.pdf
IntoTheNebulaArticle.pdf
 
Exam view dynamic recalculation files
Exam view dynamic recalculation filesExam view dynamic recalculation files
Exam view dynamic recalculation files
 
Functional Coverage Development Tips - Mentor Graphics
Functional Coverage Development Tips - Mentor GraphicsFunctional Coverage Development Tips - Mentor Graphics
Functional Coverage Development Tips - Mentor Graphics
 

More from Saroj Suwal

2.4 antimicrobial agents ( macrolides and floroquinolones)
2.4 antimicrobial agents ( macrolides and floroquinolones)2.4 antimicrobial agents ( macrolides and floroquinolones)
2.4 antimicrobial agents ( macrolides and floroquinolones)
Saroj Suwal
 
2.2 antimicrobial agents beta lactam drugs
2.2 antimicrobial agents beta lactam drugs2.2 antimicrobial agents beta lactam drugs
2.2 antimicrobial agents beta lactam drugs
Saroj Suwal
 
2.1 Chemotherapy and antimicrobial agents
2.1 Chemotherapy and antimicrobial agents2.1 Chemotherapy and antimicrobial agents
2.1 Chemotherapy and antimicrobial agents
Saroj Suwal
 
2. 3 antimicrobial agents supha amminoglycoside tetracycline
2. 3 antimicrobial agents supha amminoglycoside tetracycline2. 3 antimicrobial agents supha amminoglycoside tetracycline
2. 3 antimicrobial agents supha amminoglycoside tetracycline
Saroj Suwal
 
1.introduction to pharmacology
1.introduction to pharmacology1.introduction to pharmacology
1.introduction to pharmacology
Saroj Suwal
 
BSc Nursing Syllabus of Nepal Updated
BSc Nursing Syllabus of Nepal Updated BSc Nursing Syllabus of Nepal Updated
BSc Nursing Syllabus of Nepal Updated
Saroj Suwal
 
6.3 drugs for treating shock
6.3 drugs for treating shock6.3 drugs for treating shock
6.3 drugs for treating shock
Saroj Suwal
 
6.2 drugs in ischemic heart disease
6.2 drugs in ischemic heart disease6.2 drugs in ischemic heart disease
6.2 drugs in ischemic heart disease
Saroj Suwal
 
6.0 drugs used in Cardio Vascular System
6.0 drugs used in Cardio Vascular System6.0 drugs used in Cardio Vascular System
6.0 drugs used in Cardio Vascular System
Saroj Suwal
 
5.2 drugs used on bronchial asthma
5.2 drugs used on bronchial asthma5.2 drugs used on bronchial asthma
5.2 drugs used on bronchial asthma
Saroj Suwal
 
5. drugs acting in respiratory system
5. drugs acting in respiratory system5. drugs acting in respiratory system
5. drugs acting in respiratory system
Saroj Suwal
 
4.3 neuromuscular blocking agents and Myasthenia Gravis drugs
4.3 neuromuscular blocking agents and Myasthenia Gravis drugs4.3 neuromuscular blocking agents and Myasthenia Gravis drugs
4.3 neuromuscular blocking agents and Myasthenia Gravis drugs
Saroj Suwal
 
4.2 drugs in gout and RA
4.2 drugs in gout and RA4.2 drugs in gout and RA
4.2 drugs in gout and RA
Saroj Suwal
 
4.1 drugs in muculoskelatal
4.1 drugs in muculoskelatal4.1 drugs in muculoskelatal
4.1 drugs in muculoskelatal
Saroj Suwal
 
3.4 drugs used in inestinal worm infestations
3.4 drugs used in inestinal worm infestations3.4 drugs used in inestinal worm infestations
3.4 drugs used in inestinal worm infestations
Saroj Suwal
 
3.1antispasmodicdrugs
3.1antispasmodicdrugs3.1antispasmodicdrugs
3.1antispasmodicdrugs
Saroj Suwal
 
3. drugs used in gastrointestinal system
3. drugs used in gastrointestinal system3. drugs used in gastrointestinal system
3. drugs used in gastrointestinal system
Saroj Suwal
 
2.6 antimicrobial agents(anti viral)
2.6 antimicrobial agents(anti viral)2.6 antimicrobial agents(anti viral)
2.6 antimicrobial agents(anti viral)
Saroj Suwal
 
2.5 antimicrobial agents( anti fungal)
2.5 antimicrobial agents( anti fungal)2.5 antimicrobial agents( anti fungal)
2.5 antimicrobial agents( anti fungal)
Saroj Suwal
 
Anatomy mnemonics Guide
Anatomy mnemonics GuideAnatomy mnemonics Guide
Anatomy mnemonics Guide
Saroj Suwal
 

More from Saroj Suwal (20)

2.4 antimicrobial agents ( macrolides and floroquinolones)
2.4 antimicrobial agents ( macrolides and floroquinolones)2.4 antimicrobial agents ( macrolides and floroquinolones)
2.4 antimicrobial agents ( macrolides and floroquinolones)
 
2.2 antimicrobial agents beta lactam drugs
2.2 antimicrobial agents beta lactam drugs2.2 antimicrobial agents beta lactam drugs
2.2 antimicrobial agents beta lactam drugs
 
2.1 Chemotherapy and antimicrobial agents
2.1 Chemotherapy and antimicrobial agents2.1 Chemotherapy and antimicrobial agents
2.1 Chemotherapy and antimicrobial agents
 
2. 3 antimicrobial agents supha amminoglycoside tetracycline
2. 3 antimicrobial agents supha amminoglycoside tetracycline2. 3 antimicrobial agents supha amminoglycoside tetracycline
2. 3 antimicrobial agents supha amminoglycoside tetracycline
 
1.introduction to pharmacology
1.introduction to pharmacology1.introduction to pharmacology
1.introduction to pharmacology
 
BSc Nursing Syllabus of Nepal Updated
BSc Nursing Syllabus of Nepal Updated BSc Nursing Syllabus of Nepal Updated
BSc Nursing Syllabus of Nepal Updated
 
6.3 drugs for treating shock
6.3 drugs for treating shock6.3 drugs for treating shock
6.3 drugs for treating shock
 
6.2 drugs in ischemic heart disease
6.2 drugs in ischemic heart disease6.2 drugs in ischemic heart disease
6.2 drugs in ischemic heart disease
 
6.0 drugs used in Cardio Vascular System
6.0 drugs used in Cardio Vascular System6.0 drugs used in Cardio Vascular System
6.0 drugs used in Cardio Vascular System
 
5.2 drugs used on bronchial asthma
5.2 drugs used on bronchial asthma5.2 drugs used on bronchial asthma
5.2 drugs used on bronchial asthma
 
5. drugs acting in respiratory system
5. drugs acting in respiratory system5. drugs acting in respiratory system
5. drugs acting in respiratory system
 
4.3 neuromuscular blocking agents and Myasthenia Gravis drugs
4.3 neuromuscular blocking agents and Myasthenia Gravis drugs4.3 neuromuscular blocking agents and Myasthenia Gravis drugs
4.3 neuromuscular blocking agents and Myasthenia Gravis drugs
 
4.2 drugs in gout and RA
4.2 drugs in gout and RA4.2 drugs in gout and RA
4.2 drugs in gout and RA
 
4.1 drugs in muculoskelatal
4.1 drugs in muculoskelatal4.1 drugs in muculoskelatal
4.1 drugs in muculoskelatal
 
3.4 drugs used in inestinal worm infestations
3.4 drugs used in inestinal worm infestations3.4 drugs used in inestinal worm infestations
3.4 drugs used in inestinal worm infestations
 
3.1antispasmodicdrugs
3.1antispasmodicdrugs3.1antispasmodicdrugs
3.1antispasmodicdrugs
 
3. drugs used in gastrointestinal system
3. drugs used in gastrointestinal system3. drugs used in gastrointestinal system
3. drugs used in gastrointestinal system
 
2.6 antimicrobial agents(anti viral)
2.6 antimicrobial agents(anti viral)2.6 antimicrobial agents(anti viral)
2.6 antimicrobial agents(anti viral)
 
2.5 antimicrobial agents( anti fungal)
2.5 antimicrobial agents( anti fungal)2.5 antimicrobial agents( anti fungal)
2.5 antimicrobial agents( anti fungal)
 
Anatomy mnemonics Guide
Anatomy mnemonics GuideAnatomy mnemonics Guide
Anatomy mnemonics Guide
 

Recently uploaded

PHP Frameworks: I want to break free (IPC Berlin 2024)
PHP Frameworks: I want to break free (IPC Berlin 2024)PHP Frameworks: I want to break free (IPC Berlin 2024)
PHP Frameworks: I want to break free (IPC Berlin 2024)
Ralf Eggert
 
Smart TV Buyer Insights Survey 2024 by 91mobiles.pdf
Smart TV Buyer Insights Survey 2024 by 91mobiles.pdfSmart TV Buyer Insights Survey 2024 by 91mobiles.pdf
Smart TV Buyer Insights Survey 2024 by 91mobiles.pdf
91mobiles
 
FIDO Alliance Osaka Seminar: Passkeys at Amazon.pdf
FIDO Alliance Osaka Seminar: Passkeys at Amazon.pdfFIDO Alliance Osaka Seminar: Passkeys at Amazon.pdf
FIDO Alliance Osaka Seminar: Passkeys at Amazon.pdf
FIDO Alliance
 
DevOps and Testing slides at DASA Connect
DevOps and Testing slides at DASA ConnectDevOps and Testing slides at DASA Connect
DevOps and Testing slides at DASA Connect
Kari Kakkonen
 
Secstrike : Reverse Engineering & Pwnable tools for CTF.pptx
Secstrike : Reverse Engineering & Pwnable tools for CTF.pptxSecstrike : Reverse Engineering & Pwnable tools for CTF.pptx
Secstrike : Reverse Engineering & Pwnable tools for CTF.pptx
nkrafacyberclub
 
GDG Cloud Southlake #33: Boule & Rebala: Effective AppSec in SDLC using Deplo...
GDG Cloud Southlake #33: Boule & Rebala: Effective AppSec in SDLC using Deplo...GDG Cloud Southlake #33: Boule & Rebala: Effective AppSec in SDLC using Deplo...
GDG Cloud Southlake #33: Boule & Rebala: Effective AppSec in SDLC using Deplo...
James Anderson
 
Monitoring Java Application Security with JDK Tools and JFR Events
Monitoring Java Application Security with JDK Tools and JFR EventsMonitoring Java Application Security with JDK Tools and JFR Events
Monitoring Java Application Security with JDK Tools and JFR Events
Ana-Maria Mihalceanu
 
Assuring Contact Center Experiences for Your Customers With ThousandEyes
Assuring Contact Center Experiences for Your Customers With ThousandEyesAssuring Contact Center Experiences for Your Customers With ThousandEyes
Assuring Contact Center Experiences for Your Customers With ThousandEyes
ThousandEyes
 
Generative AI Deep Dive: Advancing from Proof of Concept to Production
Generative AI Deep Dive: Advancing from Proof of Concept to ProductionGenerative AI Deep Dive: Advancing from Proof of Concept to Production
Generative AI Deep Dive: Advancing from Proof of Concept to Production
Aggregage
 
Observability Concepts EVERY Developer Should Know -- DeveloperWeek Europe.pdf
Observability Concepts EVERY Developer Should Know -- DeveloperWeek Europe.pdfObservability Concepts EVERY Developer Should Know -- DeveloperWeek Europe.pdf
Observability Concepts EVERY Developer Should Know -- DeveloperWeek Europe.pdf
Paige Cruz
 
Empowering NextGen Mobility via Large Action Model Infrastructure (LAMI): pav...
Empowering NextGen Mobility via Large Action Model Infrastructure (LAMI): pav...Empowering NextGen Mobility via Large Action Model Infrastructure (LAMI): pav...
Empowering NextGen Mobility via Large Action Model Infrastructure (LAMI): pav...
Thierry Lestable
 
Elizabeth Buie - Older adults: Are we really designing for our future selves?
Elizabeth Buie - Older adults: Are we really designing for our future selves?Elizabeth Buie - Older adults: Are we really designing for our future selves?
Elizabeth Buie - Older adults: Are we really designing for our future selves?
Nexer Digital
 
Epistemic Interaction - tuning interfaces to provide information for AI support
Epistemic Interaction - tuning interfaces to provide information for AI supportEpistemic Interaction - tuning interfaces to provide information for AI support
Epistemic Interaction - tuning interfaces to provide information for AI support
Alan Dix
 
Introduction to CHERI technology - Cybersecurity
Introduction to CHERI technology - CybersecurityIntroduction to CHERI technology - Cybersecurity
Introduction to CHERI technology - Cybersecurity
mikeeftimakis1
 
Securing your Kubernetes cluster_ a step-by-step guide to success !
Securing your Kubernetes cluster_ a step-by-step guide to success !Securing your Kubernetes cluster_ a step-by-step guide to success !
Securing your Kubernetes cluster_ a step-by-step guide to success !
KatiaHIMEUR1
 
A tale of scale & speed: How the US Navy is enabling software delivery from l...
A tale of scale & speed: How the US Navy is enabling software delivery from l...A tale of scale & speed: How the US Navy is enabling software delivery from l...
A tale of scale & speed: How the US Navy is enabling software delivery from l...
sonjaschweigert1
 
SAP Sapphire 2024 - ASUG301 building better apps with SAP Fiori.pdf
SAP Sapphire 2024 - ASUG301 building better apps with SAP Fiori.pdfSAP Sapphire 2024 - ASUG301 building better apps with SAP Fiori.pdf
SAP Sapphire 2024 - ASUG301 building better apps with SAP Fiori.pdf
Peter Spielvogel
 
Le nuove frontiere dell'AI nell'RPA con UiPath Autopilot™
Le nuove frontiere dell'AI nell'RPA con UiPath Autopilot™Le nuove frontiere dell'AI nell'RPA con UiPath Autopilot™
Le nuove frontiere dell'AI nell'RPA con UiPath Autopilot™
UiPathCommunity
 
Leading Change strategies and insights for effective change management pdf 1.pdf
Leading Change strategies and insights for effective change management pdf 1.pdfLeading Change strategies and insights for effective change management pdf 1.pdf
Leading Change strategies and insights for effective change management pdf 1.pdf
OnBoard
 
By Design, not by Accident - Agile Venture Bolzano 2024
By Design, not by Accident - Agile Venture Bolzano 2024By Design, not by Accident - Agile Venture Bolzano 2024
By Design, not by Accident - Agile Venture Bolzano 2024
Pierluigi Pugliese
 

Recently uploaded (20)

PHP Frameworks: I want to break free (IPC Berlin 2024)
PHP Frameworks: I want to break free (IPC Berlin 2024)PHP Frameworks: I want to break free (IPC Berlin 2024)
PHP Frameworks: I want to break free (IPC Berlin 2024)
 
Smart TV Buyer Insights Survey 2024 by 91mobiles.pdf
Smart TV Buyer Insights Survey 2024 by 91mobiles.pdfSmart TV Buyer Insights Survey 2024 by 91mobiles.pdf
Smart TV Buyer Insights Survey 2024 by 91mobiles.pdf
 
FIDO Alliance Osaka Seminar: Passkeys at Amazon.pdf
FIDO Alliance Osaka Seminar: Passkeys at Amazon.pdfFIDO Alliance Osaka Seminar: Passkeys at Amazon.pdf
FIDO Alliance Osaka Seminar: Passkeys at Amazon.pdf
 
DevOps and Testing slides at DASA Connect
DevOps and Testing slides at DASA ConnectDevOps and Testing slides at DASA Connect
DevOps and Testing slides at DASA Connect
 
Secstrike : Reverse Engineering & Pwnable tools for CTF.pptx
Secstrike : Reverse Engineering & Pwnable tools for CTF.pptxSecstrike : Reverse Engineering & Pwnable tools for CTF.pptx
Secstrike : Reverse Engineering & Pwnable tools for CTF.pptx
 
GDG Cloud Southlake #33: Boule & Rebala: Effective AppSec in SDLC using Deplo...
GDG Cloud Southlake #33: Boule & Rebala: Effective AppSec in SDLC using Deplo...GDG Cloud Southlake #33: Boule & Rebala: Effective AppSec in SDLC using Deplo...
GDG Cloud Southlake #33: Boule & Rebala: Effective AppSec in SDLC using Deplo...
 
Monitoring Java Application Security with JDK Tools and JFR Events
Monitoring Java Application Security with JDK Tools and JFR EventsMonitoring Java Application Security with JDK Tools and JFR Events
Monitoring Java Application Security with JDK Tools and JFR Events
 
Assuring Contact Center Experiences for Your Customers With ThousandEyes
Assuring Contact Center Experiences for Your Customers With ThousandEyesAssuring Contact Center Experiences for Your Customers With ThousandEyes
Assuring Contact Center Experiences for Your Customers With ThousandEyes
 
Generative AI Deep Dive: Advancing from Proof of Concept to Production
Generative AI Deep Dive: Advancing from Proof of Concept to ProductionGenerative AI Deep Dive: Advancing from Proof of Concept to Production
Generative AI Deep Dive: Advancing from Proof of Concept to Production
 
Observability Concepts EVERY Developer Should Know -- DeveloperWeek Europe.pdf
Observability Concepts EVERY Developer Should Know -- DeveloperWeek Europe.pdfObservability Concepts EVERY Developer Should Know -- DeveloperWeek Europe.pdf
Observability Concepts EVERY Developer Should Know -- DeveloperWeek Europe.pdf
 
Empowering NextGen Mobility via Large Action Model Infrastructure (LAMI): pav...
Empowering NextGen Mobility via Large Action Model Infrastructure (LAMI): pav...Empowering NextGen Mobility via Large Action Model Infrastructure (LAMI): pav...
Empowering NextGen Mobility via Large Action Model Infrastructure (LAMI): pav...
 
Elizabeth Buie - Older adults: Are we really designing for our future selves?
Elizabeth Buie - Older adults: Are we really designing for our future selves?Elizabeth Buie - Older adults: Are we really designing for our future selves?
Elizabeth Buie - Older adults: Are we really designing for our future selves?
 
Epistemic Interaction - tuning interfaces to provide information for AI support
Epistemic Interaction - tuning interfaces to provide information for AI supportEpistemic Interaction - tuning interfaces to provide information for AI support
Epistemic Interaction - tuning interfaces to provide information for AI support
 
Introduction to CHERI technology - Cybersecurity
Introduction to CHERI technology - CybersecurityIntroduction to CHERI technology - Cybersecurity
Introduction to CHERI technology - Cybersecurity
 
Securing your Kubernetes cluster_ a step-by-step guide to success !
Securing your Kubernetes cluster_ a step-by-step guide to success !Securing your Kubernetes cluster_ a step-by-step guide to success !
Securing your Kubernetes cluster_ a step-by-step guide to success !
 
A tale of scale & speed: How the US Navy is enabling software delivery from l...
A tale of scale & speed: How the US Navy is enabling software delivery from l...A tale of scale & speed: How the US Navy is enabling software delivery from l...
A tale of scale & speed: How the US Navy is enabling software delivery from l...
 
SAP Sapphire 2024 - ASUG301 building better apps with SAP Fiori.pdf
SAP Sapphire 2024 - ASUG301 building better apps with SAP Fiori.pdfSAP Sapphire 2024 - ASUG301 building better apps with SAP Fiori.pdf
SAP Sapphire 2024 - ASUG301 building better apps with SAP Fiori.pdf
 
Le nuove frontiere dell'AI nell'RPA con UiPath Autopilot™
Le nuove frontiere dell'AI nell'RPA con UiPath Autopilot™Le nuove frontiere dell'AI nell'RPA con UiPath Autopilot™
Le nuove frontiere dell'AI nell'RPA con UiPath Autopilot™
 
Leading Change strategies and insights for effective change management pdf 1.pdf
Leading Change strategies and insights for effective change management pdf 1.pdfLeading Change strategies and insights for effective change management pdf 1.pdf
Leading Change strategies and insights for effective change management pdf 1.pdf
 
By Design, not by Accident - Agile Venture Bolzano 2024
By Design, not by Accident - Agile Venture Bolzano 2024By Design, not by Accident - Agile Venture Bolzano 2024
By Design, not by Accident - Agile Venture Bolzano 2024
 

Visual binning

  • 1. 6/17/13 Visual Binning publib.boulder.ibm.com/infocenter/spssstat/v20r0m0/advanced/print.jsp?topic=/com.ibm.spss.statistics.help/idh_bander_gating.htm&pageBreak=true&breakConfi… 1/9 Visual Binning Contents 1. To Bin Variables 2. Binning Variables 3. Automatically Generating Binned Categories 4. Copying Binned Categories 5. User-Missing Values in Visual Binning
  • 2. 6/17/13 Visual Binning publib.boulder.ibm.com/infocenter/spssstat/v20r0m0/advanced/print.jsp?topic=/com.ibm.spss.statistics.help/idh_bander_gating.htm&pageBreak=true&breakConfi… 2/9 Visual Binning Visual Binning is designed to assist you in the process of creating new variables based on grouping contiguous values of existing variables into a limited number of distinct categories. You can use Visual Binning to: • Create categorical variables from continuous scale variables. For example, you could use a scale income variable to create a new categorical variable that contains income ranges. • Collapse a large number of ordinal categories into a smaller set of categories. For example, you could collapse a rating scale of nine down to three categories representing low, medium, and high. In the first step, you: Select the numeric scale and/or ordinal variables for which you want to create new categorical (binned) variables. Optionally, you can limit the number of cases to scan. For data files with a large number of cases, limiting the number of cases scanned can save time, but you should avoid this if possible because it will affect the distribution of values used in subsequent calculations in Visual Binning. Note: String variables and nominal numeric variables are not displayed in the source variable list. Visual Binning requires numeric variables, measured on either a scale or ordinal level, since it assumes that the data values represent some logical order that can be used to group values in a meaningful fashion. You can change the defined measurement level of a variable in Variable View in the Data Editor. See the topic Variable measurement level for more information. © Copyright IBM Corporation 1989, 2011.
  • 3. 6/17/13 Visual Binning publib.boulder.ibm.com/infocenter/spssstat/v20r0m0/advanced/print.jsp?topic=/com.ibm.spss.statistics.help/idh_bander_gating.htm&pageBreak=true&breakConfi… 3/9 1. To Bin Variables From the menus in the Data Editor window choose: Transform > Visual Binning... Select the numeric scale and/or ordinal variables for which you want to create new categorical (binned) variables. Note: String variables and nominal numeric variables are not displayed in the source variable list. Visual Binning requires numeric variables, measured on either a scale or ordinal level, since it assume that the data values represent some logical order that can be used to group values in a meaningful fashion. Select a variable in the Scanned Variable List. Enter a name for the new binned variable. Variable names must be unique and must follow variable naming rules. See the topic Variable names for more information. Define the binning criteria for the new variable. See the topic Binning Variables for more information. Click OK. © Copyright IBM Corporation 1989, 2011.
  • 4. 6/17/13 Visual Binning publib.boulder.ibm.com/infocenter/spssstat/v20r0m0/advanced/print.jsp?topic=/com.ibm.spss.statistics.help/idh_bander_gating.htm&pageBreak=true&breakConfi… 4/9 2. Binning Variables The Visual Binning main dialog box provides the following information for the scanned variables: Scanned Variable List. Displays the variables you selected in the initial dialog box. You can sort the list by measurement level (scale or ordinal) or by variable label or name by clicking on the column headings. Cases Scanned. Indicates the number of cases scanned. All scanned cases without user- missing or system-missing values for the selected variable are used to generate the distribution of values used in calculations in Visual Binning, including the histogram displayed in the main dialog box and cutpoints based on percentiles or standard deviation units. Missing Values. Indicates the number of scanned cases with user-missing or system-missing values. Missing values are not included in any of the binned categories. See the topic User- Missing Values in Visual Binning for more information. Current Variable. The name and variable label (if any) for the currently selected variable that will be used as the basis for the new, binned variable. Binned Variable. Name and optional variable label for the new, binned variable. • Name. You must enter a name for the new variable. Variable names must be unique and must follow variable naming rules. See the topic Variable names for more information. • Label. You can enter a descriptive variable label up to 255 characters long. The default variable label is the variable label (if any) or variable name of the source variable with (Binned) appended to the end of the label. Minimum and Maximum. Minimum and maximum values for the currently selected variable, based on the scanned cases and not including values defined as user-missing. Nonmissing Values. The histogram displays the distribution of nonmissing values for the currently selected variable, based on the scanned cases. • After you define bins for the new variable, vertical lines on the histogram are displayed to indicate the cutpoints that define bins. • You can click and drag the cutpoint lines to different locations on the histogram, changing the bin ranges. • You can remove bins by dragging cutpoint lines off the histogram. Note: The histogram (displaying nonmissing values), the minimum, and the maximum are based on the scanned values. If you do not include all cases in the scan, the true distribution may not be accurately reflected, particularly if the data file has been sorted by the selected variable. If you scan zero cases, no information about the distribution of values is available. Grid. Displays the values that define the upper endpoints of each bin and optional value labels for each bin. • Value. The values that define the upper endpoints of each bin. You can enter values or use Make Cutpoints to automatically create bins based on selected criteria. By default, a cutpoint with a value of HIGH is automatically included. This bin will contain any nonmissing values above the other cutpoints. The bin defined by the lowest cutpoint will include all nonmissing values lower than or equal to that value (or simply lower than that value, depending on how you define upper endpoints). • Label. Optional, descriptive labels for the values of the new, binned variable. Since the values
  • 5. 6/17/13 Visual Binning publib.boulder.ibm.com/infocenter/spssstat/v20r0m0/advanced/print.jsp?topic=/com.ibm.spss.statistics.help/idh_bander_gating.htm&pageBreak=true&breakConfi… 5/9 of the new variable will simply be sequential integers from 1 to n, labels that describe what the values represent can be very useful. You can enter labels or use Make Labels to automatically create value labels. To Delete a Bin from the Grid Right-click on the either the Value or Label cell for the bin. From the pop-up context menu, select Delete Row. Note: If you delete the HIGH bin, any cases with values higher than the last specified cutpoint value will be assigned the system-missing value for the new variable. To Delete All Labels or Delete All Defined Bins Right-click anywhere in the grid. From the pop-up context menu select either Delete All Labels or Delete All Cutpoints. Upper Endpoints. Controls treatment of upper endpoint values entered in the Value column of the grid. • Included (<=). Cases with the value specified in the Value cell are included in the binned category. For example, if you specify values of 25, 50, and 75, cases with a value of exactly 25 will go in the first bin, since this will include all cases with values less than or equal to 25. • Excluded (<). Cases with the value specified in the Value cell are not included in the binned category. Instead, they are included in the next bin. For example, if you specify values of 25, 50, and 75, cases with a value of exactly 25 will go in the second bin rather than the first, since the first bin will contain only cases with values less than 25. Make Cutpoints. Generates binned categories automatically for equal width intervals, intervals with the same number of cases, or intervals based on standard deviations. This is not available if you scanned zero cases. See the topic Automatically Generating Binned Categories for more information. Make Labels. Generates descriptive labels for the sequential integer values of the new, binned variable, based on the values in the grid and the specified treatment of upper endpoints (included or excluded). Reverse scale. By default, values of the new, binned variable are ascending sequential integers from 1 to n. Reversing the scale makes the values descending sequential integers from n to 1. Copy Bins. You can copy the binning specifications from another variable to the currently selected variable or from the selected variable to multiple other variables. See the topic Copying Binned Categories for more information. © Copyright IBM Corporation 1989, 2011.
  • 6. 6/17/13 Visual Binning publib.boulder.ibm.com/infocenter/spssstat/v20r0m0/advanced/print.jsp?topic=/com.ibm.spss.statistics.help/idh_bander_gating.htm&pageBreak=true&breakConfi… 6/9 3. Automatically Generating Binned Categories The Make Cutpoints dialog box allows you to auto-generate binned categories based on selected criteria. To Use the Make Cutpoints Dialog Box From the menus in the Data Editor window choose: Transform > Visual Binning... Select the numeric scale and/or ordinal variables for which you want to create new categorical (binned) variables. Click Continue. Select (click) a variable in the Scanned Variable List. Click Make Cutpoints. Select the criteria for generating cutpoints that will define the binned categories. Click Apply. Note: The Make Cutpoints dialog box is not available if you scanned zero cases. Equal Width Intervals. Generates binned categories of equal width (for example, 1–10, 11–20, and 21–30) based on any two of the following three criteria: • First Cutpoint Location. The value that defines the upper end of the lowest binned category (for example, a value of 10 indicates a range that includes all values up to 10). • Number of Cutpoints. The number of binned categories is the number of cutpoints plus one. For example, 9 cutpoints generate 10 binned categories. • Width. The width of each interval. For example, a value of 10 would bin age in years into 10- year intervals. Equal Percentiles Based on Scanned Cases. Generates binned categories with an equal number of cases in each bin (using the aempirical algorithm for percentiles), based on either of the following criteria: • Number of Cutpoints. The number of binned categories is the number of cutpoints plus one. For example, three cutpoints generate four percentile bins (quartiles), each containing 25% of the cases. • Width (%). Width of each interval, expressed as a percentage of the total number of cases. For example, a value of 33.3 would produce three binned categories (two cutpoints), each containing 33.3% of the cases. If the source variable contains a relatively small number of distinct values or a large number of cases with the same value, you may get fewer bins than requested. If there are multiple identical values at a cutpoint, they will all go into the same interval; so the actual percentages may not always be exactly equal. Cutpoints at Mean and Selected Standard Deviations Based on Scanned Cases. Generates binned categories based on the values of the mean and standard deviation of the distribution of the variable.
  • 7. 6/17/13 Visual Binning publib.boulder.ibm.com/infocenter/spssstat/v20r0m0/advanced/print.jsp?topic=/com.ibm.spss.statistics.help/idh_bander_gating.htm&pageBreak=true&breakConfi… 7/9 • If you don't select any of the standard deviation intervals, two binned categories will be created, with the mean as the cutpoint dividing the bins. • You can select any combination of standard deviation intervals based on one, two, and/or three standard deviations. For example, selecting all three would result in eight binned categories--six bins in one standard deviation intervals and two bins for cases more than three standard deviations above and below the mean. In a normal distribution, 68% of the cases fall within one standard deviation of the mean; 95%, within two standard deviations; and 99%, within three standard deviations. Creating binned categories based on standard deviations may result in some defined bins outside of the actual data range and even outside of the range of possible data values (for example, a negative salary range). Note: Calculations of percentiles and standard deviations are based on the scanned cases. If you limit the number of cases scanned, the resulting bins may not contain the proportion of cases that you wanted in those bins, particularly if the data file is sorted by the source variable. For example, if you limit the scan to the first 100 cases of a data file with 1000 cases and the data file is sorted in ascending order of age of respondent, instead of four percentile age bins each containing 25% of the cases, you may find that the first three bins each contain only about 3.3% of the cases, and the last bin contains 90% of the cases. © Copyright IBM Corporation 1989, 2011.
  • 8. 6/17/13 Visual Binning publib.boulder.ibm.com/infocenter/spssstat/v20r0m0/advanced/print.jsp?topic=/com.ibm.spss.statistics.help/idh_bander_gating.htm&pageBreak=true&breakConfi… 8/9 4. Copying Binned Categories When creating binned categories for one or more variables, you can copy the binning specifications from another variable to the currently selected variable or from the selected variable to multiple other variables. To Copy Binning Specifications From the menus in the Data Editor window choose: Transform > Visual Binning... Select the numeric scale and/or ordinal variables for which you want to create new categorical (binned) variables. Click Continue. Define binned categories for at least one variable--but do not click OK or Paste. Select (click) a variable in the Scanned Variable List for which you have defined binned categories. Click To Other Variables. Select the variables for which you want to create new variables with the same binned categories. Click Copy. or Select (click) a variable in the Scanned Variable List to which you want to copy defined binned categories. Click From Another Variable. Select the variable with the defined binned categories that you want to copy. Click Copy. If you have specified value labels for the variable from which you are copying the binning specifications, those are also copied. Note: Once you click OK in the Visual Binning main dialog box to create new binned variables (or close the dialog box in any other way), you cannot use Visual Binning to copy those binned categories to other variables. © Copyright IBM Corporation 1989, 2011.
  • 9. 6/17/13 Visual Binning publib.boulder.ibm.com/infocenter/spssstat/v20r0m0/advanced/print.jsp?topic=/com.ibm.spss.statistics.help/idh_bander_gating.htm&pageBreak=true&breakConfi… 9/9 5. User-Missing Values in Visual Binning Values defined as user-missing (values identified as codes for missing data) for the source variable are not included in the binned categories for the new variable. User-missing values for the source variables are copied as user-missing values for the new variable, and any defined value labels for missing value codes are also copied. If a missing value code conflicts with one of the binned category values for the new variable, the missing value code for the new variable is recoded to a nonconflicting value by adding 100 to the highest binned category value. For example, if a value of 1 is defined as user-missing for the source variable and the new variable will have six binned categories, any cases with a value of 1 for the source variable will have a value of 106 for the new variable, and 106 will be defined as user-missing. If the user-missing value for the source variable had a defined value label, that label will be retained as the value label for the recoded value of the new variable. Note: If the source variable has a defined range of user-missing values of the form LO-n, where n is a positive number, the corresponding user-missing values for the new variable will be negative numbers. © Copyright IBM Corporation 1989, 2011.