Download as PDF, PPTX
![Cheminformatics
Primitive types in R
20/189
The language
> x <- 1.2
Parallel R
> x <- 2
Database access
> y <- "abcdegf"
> y
[1] "abcdegf"
> z <- c(1,2,3,4,5)
> z
[1] 1 2 3 4 5
> z <- 1:5
> z
[1] 1 2 3 4 5](https://image.slidesharecdn.com/cheminfo-in-r-100517174658-phpapp01/85/Cheminformatics-in-R-20-320.jpg)
![Cheminformatics
Matrices in R
21/189
The language
Parallel R
Make a matrix from a vector Database access
The matrix is constructed column-wise
> z <- c(1,2,3,4,5,6,7,8,9,10)
> m <- matrix(z, nrow=2, ncol=5)
> m
[,1] [,2] [,3] [,4] [,5]
[1,] 1 3 5 7 9
[2,] 2 4 6 8 10](https://image.slidesharecdn.com/cheminfo-in-r-100517174658-phpapp01/85/Cheminformatics-in-R-21-320.jpg)
![Cheminformatics
Lists in R
24/189
A 1D collection of arbitrary objects (ArrayList in Java)
We can access the lists by indexing: mylist[1] or The language
mylist[[1]] for the first element or mylist[c(1,2,3)] for Parallel R
the first 3 elements Database access
x <- 1.0
y <- "hello there"
s <- c(1,2,3)
mylist <- list(x,y,s)
> mylist
[[1]]
[1] 1
[[2]]
[1] "hello there"
[[3]]
[1] 1 2 3](https://image.slidesharecdn.com/cheminfo-in-r-100517174658-phpapp01/85/Cheminformatics-in-R-24-320.jpg)
![Cheminformatics
Lists in R
25/189
It’s useful to name individual elements of a list
The language
Parallel R
x <- "oxygen"
z <- 8 Database access
m <- 32
mylist <- list(name="oxygen",
atomicNumber=z,
molWeight=m)
> mylist
$name
[1] "oxygen"
$atomicNumber
[1] 8
$molWeight
[1] 32](https://image.slidesharecdn.com/cheminfo-in-r-100517174658-phpapp01/85/Cheminformatics-in-R-25-320.jpg)
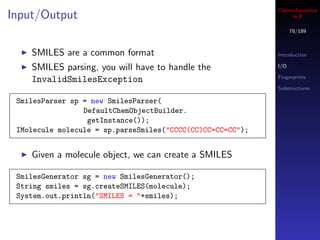
![Cheminformatics
Lists in R
26/189
The language
Parallel R
Database access
We can then get the molecular weight by writing
> mylist$molWeight
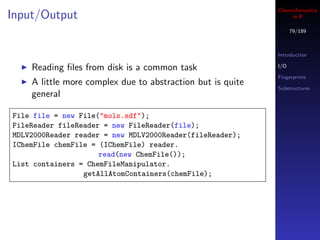
[1] 32](https://image.slidesharecdn.com/cheminfo-in-r-100517174658-phpapp01/85/Cheminformatics-in-R-26-320.jpg)
![Cheminformatics
Identifying types in R
27/189
It’s useful initially, to identify the type of the object The language
Usually just printing it out explains what it is Parallel R
Database access
You can be more concise by doing
> x <- 1
> class(x)
[1] "numeric"
> x <- "hello world"
> class(x)
[1] "character"
> x <- matrix(c(1,2,3,4), nrow=2)
> class(x)
[1] "matrix"](https://image.slidesharecdn.com/cheminfo-in-r-100517174658-phpapp01/85/Cheminformatics-in-R-27-320.jpg)
![Cheminformatics
Indexing in R
28/189
The language
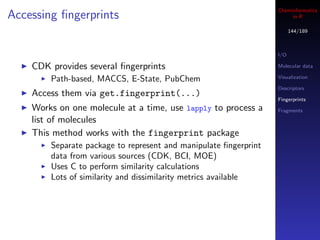
Indexing fundamental to using R and is applicable to Parallel R
vectors, matrices, data.frame’s and lists Database access
all indices start from 1 (not 0!)
For a 1D vector, we get the i’th element by x[i]
For a 2D matrix of data.frame we get the i, j element by
x[i,j]
But we can also index using vectors
Called an index vector
Allows us to select or exclude multiple elements
simultaneously](https://image.slidesharecdn.com/cheminfo-in-r-100517174658-phpapp01/85/Cheminformatics-in-R-28-320.jpg)
![Cheminformatics
Indexing in R
29/189
Say we have a vector, x and a matrix y
The language
Parallel R
> x
Database access
[1] 1 2 3 4 5 6 7 8 9 10
> y
[,1] [,2] [,3] [,4] [,5]
[1,] 1 4 7 10 13
[2,] 2 5 8 11 14
[3,] 3 6 9 12 15
Some ways to get elements from x
5th element → x[5]
The 3rd, 4th and 5th elements → x[ c(3,4,5) ]
Everything but the 3rd, 4th and 5th elements →
x[ -c(3,4,5) ]](https://image.slidesharecdn.com/cheminfo-in-r-100517174658-phpapp01/85/Cheminformatics-in-R-29-320.jpg)
![Cheminformatics
Indexing in R
30/189
Say we have a matrix y
The language
Parallel R
> y
Database access
[,1] [,2] [,3] [,4] [,5]
[1,] 1 4 7 10 13
[2,] 2 5 8 11 14
[3,] 3 6 9 12 15
Some ways to get elements from y
Element in the first row, second column → y[1,2]
All elements in the 1st column → y[,1]
All elements in the 3rd row → y[3,]
Elements in the first 2 columns → y[ , c(1,2) ]
Elements not in the first 2 columns → y[ , -c(1,2) ]](https://image.slidesharecdn.com/cheminfo-in-r-100517174658-phpapp01/85/Cheminformatics-in-R-30-320.jpg)
![Cheminformatics
Indexing in R
31/189
The language
You can also use a boolean vector to index another vector
Parallel R
In this case, the index vector must of the same length as Database access
your target vector
If the i’th element in the index vector is TRUE then the
i’th element of the target is selected
> x <- c(1,2,3,4)
> idx <- c(TRUE, FALSE, FALSE, TRUE)
> x[ idx ]
[1] 1 4
It’s a pain to have to create a whole index vector by hand](https://image.slidesharecdn.com/cheminfo-in-r-100517174658-phpapp01/85/Cheminformatics-in-R-31-320.jpg)
![Cheminformatics
Indexing in R
32/189
A more intuitive way to do this, is to make use of R’s
vector operations The language
x == 2 will compare each element of x with the value 2 Parallel R
and return TRUE or FALSE Database access
The result is a boolean vector
> x <- c(1,2,3,4)
> x == 2
[1] FALSE TRUE FALSE FALSE
So we can select the elements of x that are equal to 2 by
doing
> x <- c(1,2,3,4)
> x[ x == 2 ]
[1] 2](https://image.slidesharecdn.com/cheminfo-in-r-100517174658-phpapp01/85/Cheminformatics-in-R-32-320.jpg)
![Cheminformatics
Indexing in R
33/189
Or select elements of x that are greater than 2
The language
Parallel R
> x <- c(1,2,3,4)
Database access
> x[ x > 2 ]
[1] 3 4
Or select elements of x that are 2 or 4
> x <- c(1,2,3,4)
> x[ x == 2 | x == 4 ]
[1] 2 4
The single bar (|) is intentional
Logical operations using vectors should use |, & rather
than the usual ||, &&](https://image.slidesharecdn.com/cheminfo-in-r-100517174658-phpapp01/85/Cheminformatics-in-R-33-320.jpg)
![Cheminformatics
List indexing in R
34/189
With list objects we can index using [ or [[ The language
[ keeps element names, [[ drops names Parallel R
Database access
Can’t use index vectors or boolean vectors with [[
> y <- list(a=’b’, b=123, x=c(1,2,3))
> y[3]
$x
[1] 1 2 3
> y[[3]]
[1] 1 2 3
> y[[1:2]]
Error in y[[1:2]] : subscript out of bounds](https://image.slidesharecdn.com/cheminfo-in-r-100517174658-phpapp01/85/Cheminformatics-in-R-34-320.jpg)
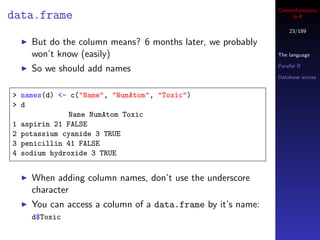
![Cheminformatics
Subsetting in R
35/189
The language
Get a subset of the rows of a matrix or data.frame based Parallel R
on values in a certain column Database access
We can generate a boolean index vector
For data.frame’s, we can use a more intuitive approach
d <- data.frame(a=1:10, b=runif(10), c=rnorm(10))
d[d$a <= 6,]
subset(d, a <= 6)
subset(d, a >= 7 & b < 0.4)](https://image.slidesharecdn.com/cheminfo-in-r-100517174658-phpapp01/85/Cheminformatics-in-R-35-320.jpg)
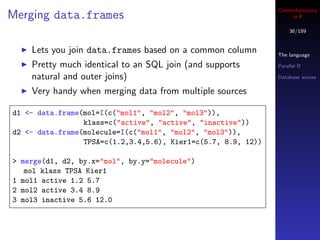
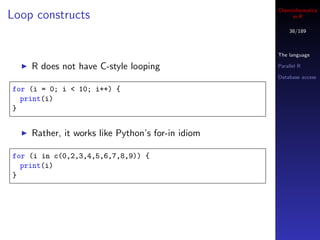
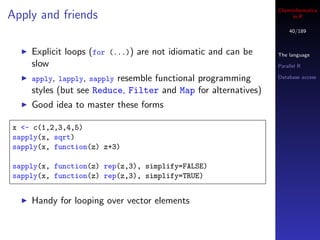
![Cheminformatics
Loop constructs in R
39/189
The language
In general, to loop n times, you create a vector with n Parallel R
elements, say by writing 1 : n Database access
But like Python loops, you can just loop over elements of
a vector or list and use them
> objects <- list(x=1, y="hello world", z=c(1,2,3))
> for (i in objects) print(i)
[1] 1
[1] "hello world"
[1] 1 2 3
Good R style discourages explicit loops](https://image.slidesharecdn.com/cheminfo-in-r-100517174658-phpapp01/85/Cheminformatics-in-R-39-320.jpg)
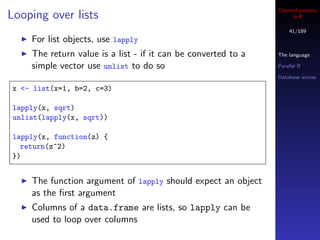
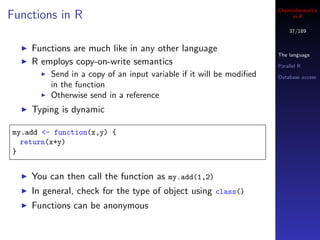
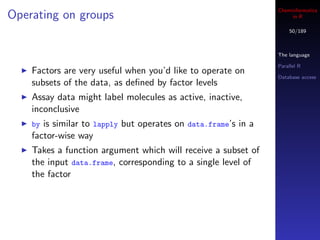
![Cheminformatics
What is a factor? in R
48/189
The factor type is used to represent categorical variables The language
Toxic, non-toxic Parallel R
Active, inactive Database access
Yes, no, maybe
They correspond to enum’s in C/Java
A factor variable looks like an ordinary vector of
characters
Internally they are represented by integers
A factor variable has a property called the levels
Indicates what values are valid for the factor
> levels(dat$Class)
[1] "nontoxic" "toxic"](https://image.slidesharecdn.com/cheminfo-in-r-100517174658-phpapp01/85/Cheminformatics-in-R-48-320.jpg)
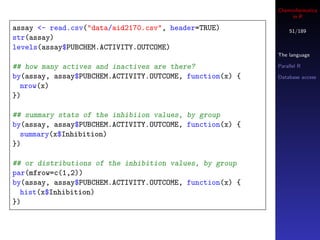
![Cheminformatics
What is a factor? in R
49/189
The language
If you try to assign an invalid value to a factor you get a Parallel R
warning Database access
> dat$Class[1] <- "Yes"
Warning message:
In ‘[<-.factor‘(‘*tmp*‘, 1, value = "Yes") :
invalid factor level, NAs generated
> dat$Class[1:10]
[1] <NA> toxic toxic nontoxic toxic nontoxic nontoxic nontoxic
[9] nontoxic toxic
Levels: nontoxic toxic](https://image.slidesharecdn.com/cheminfo-in-r-100517174658-phpapp01/85/Cheminformatics-in-R-49-320.jpg)
![Cheminformatics
A serial solution in R
57/189
Evaluate all 4-member combinations of the numbers The language
{1, 2, . . . , 34} Parallel R
These are the indices of the descriptor columns Database access
Loop over the rows, use the values as column indices of
the descriptor matrix, build a model
## First some data prep
library(gtools)
load("data/bergstrom/bergstrom.Rda")
depv <- train.desc[,1]
desc <- train.desc[,-1]
idx <- 1:nrow(desc)
combos <- combinations(ncol(desc), 4)](https://image.slidesharecdn.com/cheminfo-in-r-100517174658-phpapp01/85/Cheminformatics-in-R-57-320.jpg)
![Cheminformatics
A serial solution in R
58/189
The language
Parallel R
rmse <- function(x,y) sqrt(sum((x-y)^2)/length(x))
Database access
system.time(
rmse.serial <- apply(combos, 1, function(idx, mydata, y) {
dat <- data.frame(y=y, x=mydata[,idx])
m <- lm(y~., dat)
return(rmse(m$fitted,y))
}, mydata=desc, y=depv)
)
Takes about 200 seconds](https://image.slidesharecdn.com/cheminfo-in-r-100517174658-phpapp01/85/Cheminformatics-in-R-58-320.jpg)
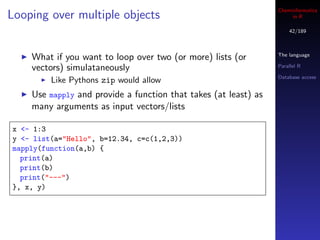
![Cheminformatics
The parallel solution in R
59/189
Code is pretty much identical
The language
First need to initialize the “cluster” - in this case we’ll
Parallel R
run multiple processes on the same machine
Database access
library(snow)
clus <- makeCluster(rep("localhost",2), type="SOCK")
system.time(
rmse.par <- parApply(clus, combos, 1, function(idx, mydata, y) {
dat <- data.frame(y=y, x=mydata[,idx])
m <- lm(y~., dat)
return(rmse(m$fitted,y))
}, mydata=desc, y=depv)
)
Takes about 120 seconds, but easily scales up with
multiple cores](https://image.slidesharecdn.com/cheminfo-in-r-100517174658-phpapp01/85/Cheminformatics-in-R-59-320.jpg)
![Cheminformatics
Basic usage - connecting in R
63/189
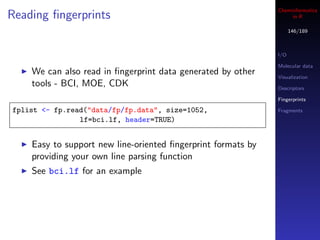
We’ll use a database I prepared and placed at
data/db/assay.db The language
Lets first get some information about the tables and field Parallel R
definitions Database access
library(RSQLite)
## specific to RSQLite
sqlite <- dbDriver("SQLite")
con <- dbConnect(sqlite, dbname = "data/db/assay.db")
> dbListTables(con)
[1] "assay"
> dbListFields(con, "assay")
[1] "row_names" "aid" "PUBCHEM_SID" "PUBCHEM_CID"
"PUBCHEM_ACTIVITY_OUTCOME" "PUBCHEM_ACTIVITY_SCORE"
"PUBCHEM_ASSAYDATA_COMMENT"](https://image.slidesharecdn.com/cheminfo-in-r-100517174658-phpapp01/85/Cheminformatics-in-R-63-320.jpg)
![Cheminformatics
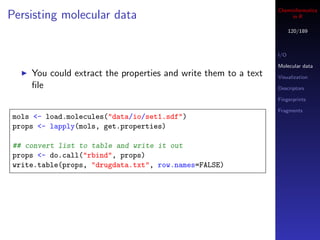
Saving data in a database in R
66/189
Can directly write a data.frame to a database file
RSQLite will automatically generate a CREATE TABLE The language
statement Parallel R
Database access
library(rpubchem)
## get some assay data from PubChem
assay <- sapply(c(396, 429, 438, 445), function(x) {
data.frame(aid=x, get.assay(x))[,1:6]
}, simplify=FALSE)
## join all assays into a single data.frame
assay <- do.call("rbind", assay)
## Make a new table
sqlite <- dbDriver("SQLite")
con <- dbConnect(sqlite, dbname = "assay.db")
dbWriteTable(con, "assay", assay)
dbDisconnect(con)](https://image.slidesharecdn.com/cheminfo-in-r-100517174658-phpapp01/85/Cheminformatics-in-R-66-320.jpg)


![Cheminformatics
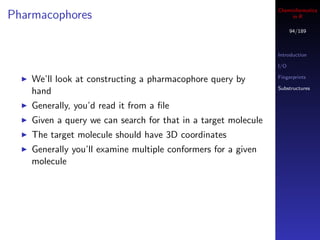
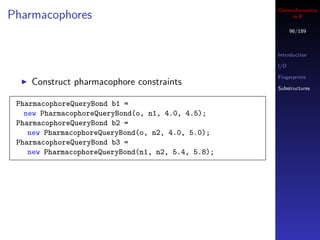
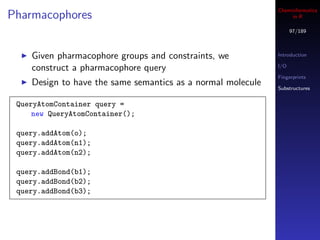
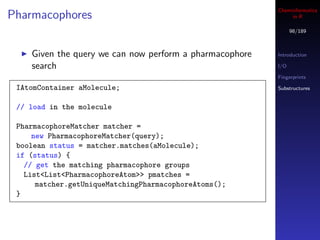
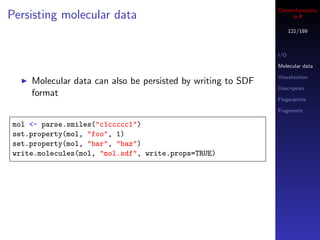
Pharmacophores in R
95/189
Introduction
I/O
Fingerprints
Construct pharmacophore groups
Substructures
PharmacophoreQueryAtom o =
new PharmacophoreQueryAtom("D", "[!H0;#7,#8,#9]");
PharmacophoreQueryAtom n1 =
new PharmacophoreQueryAtom("A", "c1ccccc1");
PharmacophoreQueryAtom n2 =
new PharmacophoreQueryAtom("A", "c1ccccc1");](https://image.slidesharecdn.com/cheminfo-in-r-100517174658-phpapp01/85/Cheminformatics-in-R-95-320.jpg)
![Cheminformatics
Configuring molecules in R
108/189
I/O
Molecular data
## no explicit configuration needed Visualization
mols <- load.molecules("data/io/bp.smi")
Descriptors
get.exact.mass(mols[[1]])
Fingerprints
## explicit configuration required Fragments
mol <- parse.smiles("c1ccccc1")
get.exact.mass(mol)
The last call will give a NullPointerException since
the isotopic masses have not been configured](https://image.slidesharecdn.com/cheminfo-in-r-100517174658-phpapp01/85/Cheminformatics-in-R-108-320.jpg)
![Cheminformatics
Hydrogens - implicit & explicit in R
110/189
SMILES indicates that when hydrogens are not specified,
they are to be considered implicit I/O
Molecular data
But MDL MOL files have no such specification, so if no Visualization
H’s specified, the molecule will not have explicit or Descriptors
implicit hydrogens Fingerprints
Fragments
mol <- load.molecules("data/noh.mol")[[1]]
unlist(lapply(get.atoms(mol), get.symbol))
In such cases, convert.implicit.to.explicit will
add implicit H’s (to satisfy valencies) and then convert
them to explicit
convert.implicit.to.explicit(mol)
unlist(lapply(get.atoms(mol), get.symbol))](https://image.slidesharecdn.com/cheminfo-in-r-100517174658-phpapp01/85/Cheminformatics-in-R-110-320.jpg)
![Cheminformatics
Accessing data fields in R
116/189
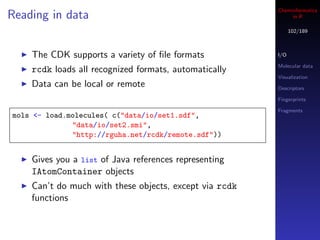
The CDK reads SDF tags and their values into the
IAtomContainer object I/O
We can access them via the get.property and Molecular data
get.properties Visualization
Descriptors
Fingerprints
> mols <- load.molecules("data/io/set1.sdf") Fragments
> get.properties(mols[[1]])
$DRUGBANK_ID
[1] "DB00135"
$DRUGBANK_IUPAC_NAME
[1] "(2S)-2-amino-3-(4-hydroxyphenyl)propanoic acid"
$‘cdk:Title‘
[1] "135"
...](https://image.slidesharecdn.com/cheminfo-in-r-100517174658-phpapp01/85/Cheminformatics-in-R-116-320.jpg)
![Cheminformatics
Accessing data fields in R
117/189
I/O
Molecular data
Visualization
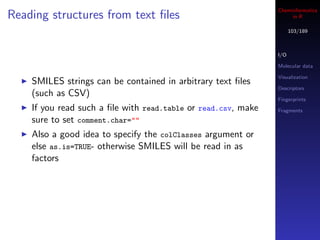
If you know the name of the field, just pull the value
Descriptors
directly
Fingerprints
Fragments
get.property(mols[[1]], "DRUGBANK_GENERIC_NAME")
Note that values for all tags are character, so you need
to cast them to the appropriate types manually](https://image.slidesharecdn.com/cheminfo-in-r-100517174658-phpapp01/85/Cheminformatics-in-R-117-320.jpg)
![Cheminformatics
Extra tags in R
118/189
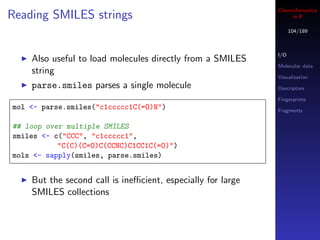
In some cases, you’ll see tag names that are not in the I/O
SDF file Molecular data
Visualization
The CDK uses molecule property fields to attach
Descriptors
arbitrary data.
Fingerprints
For example, the title field from a SDF entry is stored Fragments
using the cdk:Title name
In general, all CDK-derived properties have names
prefixed by “cdk:”
## identify CDK-derived properties
props <- get.properties(mols[[1]])
props[ grep("^cdk:", names(props)) ]](https://image.slidesharecdn.com/cheminfo-in-r-100517174658-phpapp01/85/Cheminformatics-in-R-118-320.jpg)
![Cheminformatics
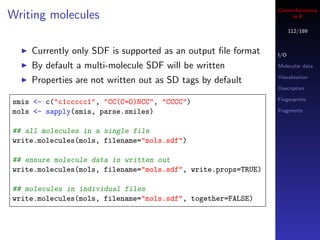
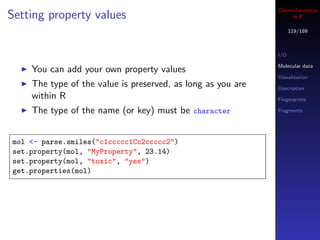
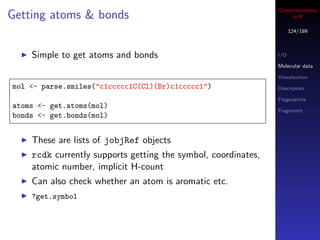
Working with molecules in R
123/189
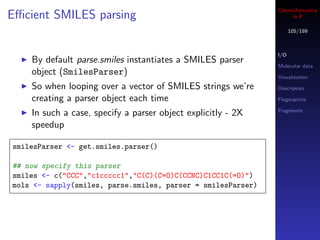
A useful task is to wash or standardize molecules
I/O
CDK doesn’t provide a method to do this directly Molecular data
But a common operation is to check for disconnected Visualization
molecules and keep the largest fragment Descriptors
Fingerprints
> m <- parse.smiles("c1ccccc1") Fragments
> is.connected(m)
[1] TRUE
>
> m <- parse.smiles("C1CC(N=C1)C(=O)[O-].[Na+]")
> is.connected(m)
[1] FALSE
>
> largest <- get.largest.component(m)
> length(get.atoms(largest))
[1] 8](https://image.slidesharecdn.com/cheminfo-in-r-100517174658-phpapp01/85/Cheminformatics-in-R-123-320.jpg)
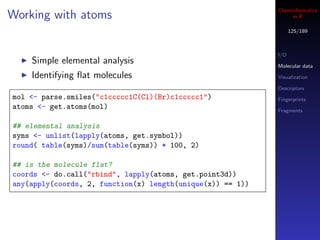
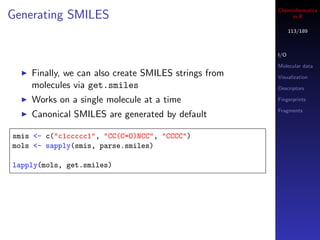
![Cheminformatics
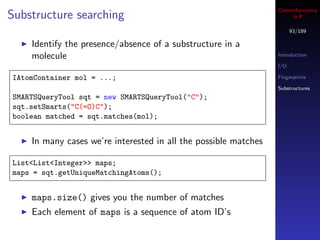
SMARTS matching in R
126/189
rcdk supports substructure searches with SMARTS or I/O
SMILES Molecular data
May not be practical for large collections of molecules Visualization
due to memory Descriptors
Fingerprints
Fragments
mols <- sapply(c("CC(C)(C)C",
"c1ccc(Cl)cc1C(=O)O",
"CCC(N)(N)CC"), parse.smiles)
query <- "[#6D2]"
hits <- matches(query, mols)
> print(hits)
CC(C)(C)C c1ccc(Cl)cc1C(=O)O CCC(N)(N)CC
FALSE TRUE TRUE](https://image.slidesharecdn.com/cheminfo-in-r-100517174658-phpapp01/85/Cheminformatics-in-R-126-320.jpg)
![Cheminformatics
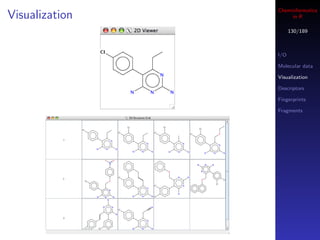
Visualization in R
129/189
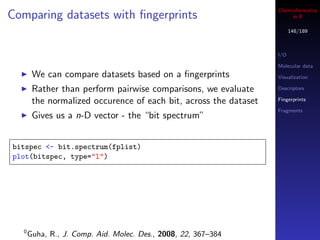
rcdk supports visualization of 2D structure images in I/O
two ways Molecular data
First, you can bring up a Swing window Visualization
Descriptors
Second, you can obtain the depiction as a raster image
Fingerprints
Doesn’t work on OS X Fragments
mols <- load.molecules("data/dhfr_3d.sd")
## view a single molecule in a Swing window
view.molecule.2d(mols[[1]])
## view a table of molecules
view.molecule.2d(mols[1:10])](https://image.slidesharecdn.com/cheminfo-in-r-100517174658-phpapp01/85/Cheminformatics-in-R-129-320.jpg)
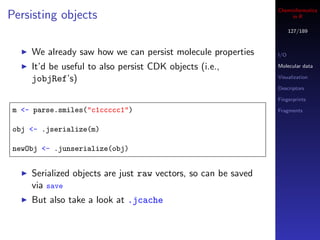
![Cheminformatics
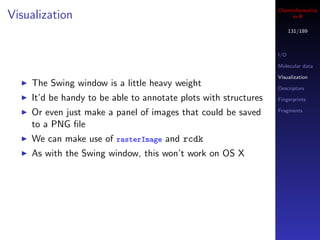
Visualization in R
133/189
By playing around with plotting parameters we can fill up
I/O
the plot region with an image
Molecular data
The values being plotted define the coordinates used to Visualization
overlay the raster image Descriptors
Fingerprints
Fragments
mols <- load.molecules("data/dhfr_3d.sd")
## A table of 16 structures
par(mfrow=c(4,4), mar=c(0,0,0,0))
for (i in 1:16) {
img <- view.image.2d(mols[[i]], 200, 200)
plot(1:10, xaxt="n", yaxt="n", xaxs="i", yaxs="i", col="white")
rasterImage(img, 1,1, 10,10)
}](https://image.slidesharecdn.com/cheminfo-in-r-100517174658-phpapp01/85/Cheminformatics-in-R-133-320.jpg)
![Cheminformatics
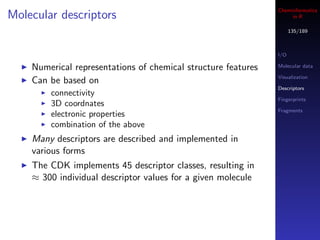
Descriptor calculations in R
139/189
I/O
You can also specify descriptor categories, to get a subset Molecular data
Visualization
dnames <- get.desc.names("topological") Descriptors
Fingerprints
## what categories are available?
Fragments
> get.desc.categories()
[1] "electronic" "protein" "topological" "geometrical" "constitutional" "hy
Depending on the input structures, some descriptors may
not make sense
If you evaluate 3D descriptors from SMILES input, they’d
all be set to NA](https://image.slidesharecdn.com/cheminfo-in-r-100517174658-phpapp01/85/Cheminformatics-in-R-139-320.jpg)
![Cheminformatics
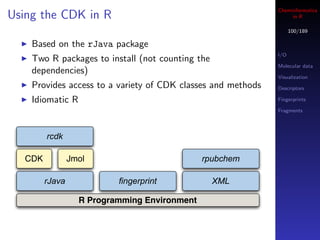
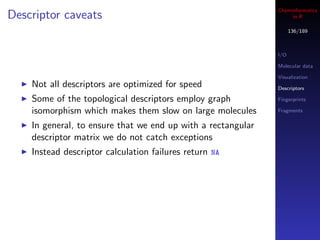
Accessing fingerprints in R
145/189
I/O
mols <- load.molecules("data/dhfr_3d.sd") Molecular data
Visualization
## get a single fingerprint Descriptors
fp <- get.fingerprint(mols[[1]], type="maccs") Fingerprints
Fragments
## process a list of molecules
fplist <- lapply(mols, get.fingerprint, type="maccs")
Each fingerprint is an S4 object
See the fingerprint package man pages for more
details](https://image.slidesharecdn.com/cheminfo-in-r-100517174658-phpapp01/85/Cheminformatics-in-R-145-320.jpg)
![Cheminformatics
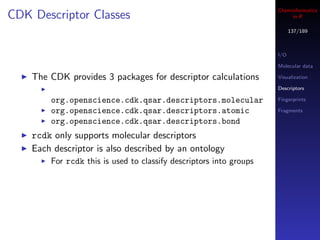
Similarity metrics in R
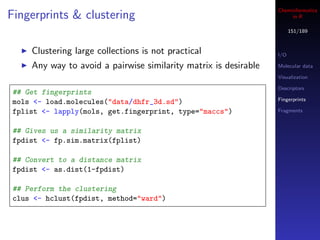
147/189
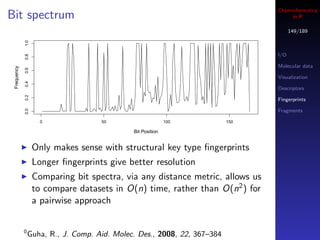
The fingerprint package implements 28 similarity and
dissimilarity metrics
I/O
All accessed via the distance function (so you call this Molecular data
even if you want similarity) Visualization
Implemented in C, but still, large similarity matrix Descriptors
Fingerprints
calculations are not a good idea!
Fragments
## similarity between 2 individual fingerprints
distance(fplist[[1]], fplist[[2]], method="tanimoto")
distance(fplist[[1]], fplist[[2]], method="mt")
## similarity matrix - compare similarity distributions
m1 <- fp.sim.matrix(fplist, "tanimoto")
m2 <- fp.sim.matrix(fplist, "carbo")
par(mfrow=c(1,2))
hist(m1, xlim=c(0,1))
hist(m2, xlim=c(0,1))](https://image.slidesharecdn.com/cheminfo-in-r-100517174658-phpapp01/85/Cheminformatics-in-R-147-320.jpg)
[O-])NCc3ccc(cc3)C(=O)N4CCCCC4")
Visualization
## get the fragmenter Descriptors
fragmenter <- .jnew("org/openscience/cdk/tools/GenerateFragments")
Fingerprints
Fragments
## do fragmentation
.jcall(fragmenter, "V", "generateMurckoFragments",
.jcast(mol, "org/openscience/cdk/interfaces/IMolecule"),
TRUE, TRUE, as.integer(6))
## get fragments as SMILES
frags <- .jcall(fragmenter,
"[S",
"getMurckoFrameworksAsSmileArray")](https://image.slidesharecdn.com/cheminfo-in-r-100517174658-phpapp01/85/Cheminformatics-in-R-160-320.jpg)
![Cheminformatics
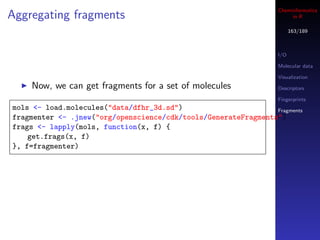
Aggregating fragments in R
164/189
This gives us a list of fragment SMILES I/O
Molecular data
Visualization
> frags[1:3]
[[1]] Descriptors
[1] "C1=CC=C(C=C1)C=2C=NC=NC=2" Fingerprints
Fragments
[[2]]
[1] "C1=CC=C(C=C1)C=2C=NC=NC=2"
[[3]]
[1] "C1=CC=C(C=C1)C=2C=NC=NC=2"
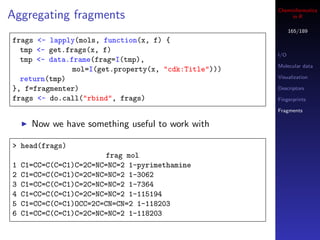
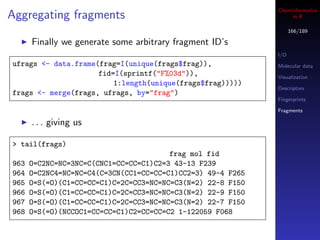
What we want is a data.frame that associates fragments,
fragment ID’s and the SMILES from which they are
derived](https://image.slidesharecdn.com/cheminfo-in-r-100517174658-phpapp01/85/Cheminformatics-in-R-164-320.jpg)
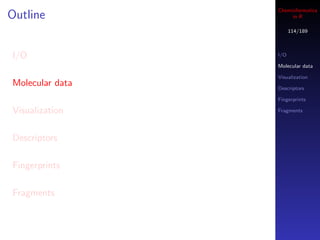
![Cheminformatics
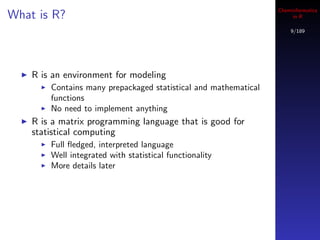
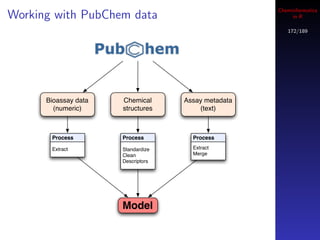
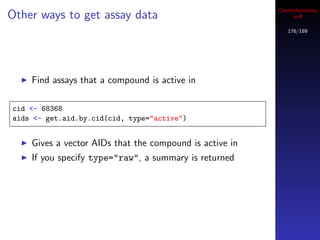
Other ways to get assay data in R
175/189
If you’re looking for a group of assays, say related to
HDAC inhibitors, perform a keyword search
## gives a vector of integer AIDs
aids <- find.assay.id("HDAC", quiet=FALSE)
## what are the assays?
sapply(aids[1:10], get.assay.desc)](https://image.slidesharecdn.com/cheminfo-in-r-100517174658-phpapp01/85/Cheminformatics-in-R-176-320.jpg)
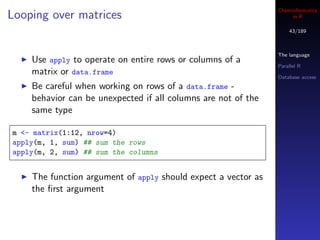
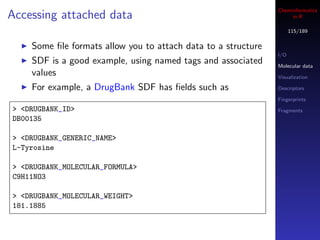
![Cheminformatics
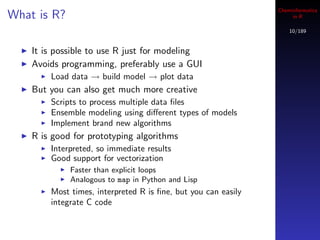
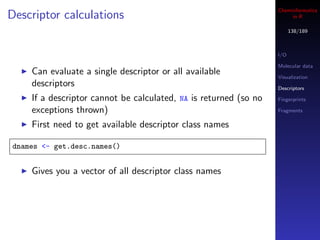
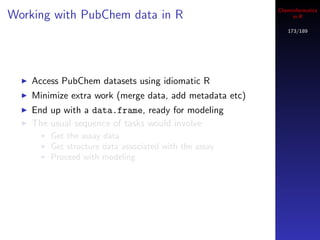
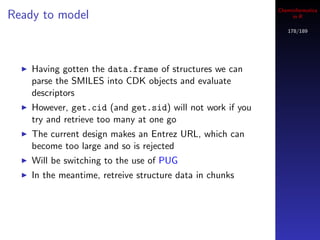
Getting structure information in R
Get structure data by CID or SID 177/189
cids <- get.cid(assay$PUBCHEM.CID[1:10])
Gives you a data.frame containing name, structure and
some properties
> str(structs)
’data.frame’: 10 obs. of 11 variables:
$ CID : chr "644436" "645300" "645983" "648874" ...
$ IUPACName : chr "2-(2-methylphenyl)-1,3-benzoxazol-5-amine"
$ CanonicalSmile : chr "CC1=CC=CC=C1C2=NC3=C(O2)C=CC(=C3)N"
$ MolecularFormula : chr "C14H12N2O" "C18H15N3O2" "C24H34N6O3"
$ MolecularWeight : num 224 305 455 407 290 ...
$ TotalFormalCharge : int 0 0 0 0 0 0 0 0 0 0
$ XLogP : num 3.1 3.2 3 4.5 2.1 2.9 1.8 2.5 0.7 1.7
$ HydrogenBondDonorCount : int 1 0 1 1 2 2 1 1 2 2
$ HydrogenBondAcceptorCount: int 3 4 7 5 4 3 7 8 5 4
$ HeavyAtomCount : int 17 23 33 29 21 26 33 31 20 21
$ TPSA : num 52 57 94.4 68 84.5 70.7 94.4 125 104 69.6](https://image.slidesharecdn.com/cheminfo-in-r-100517174658-phpapp01/85/Cheminformatics-in-R-178-320.jpg)
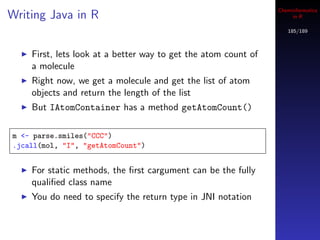
![Cheminformatics
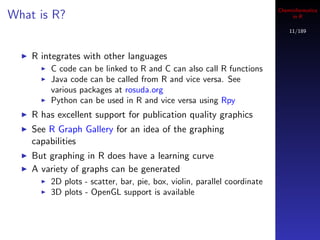
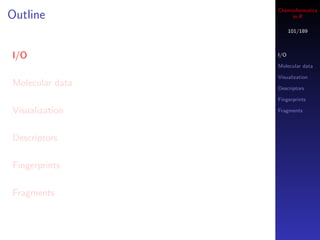
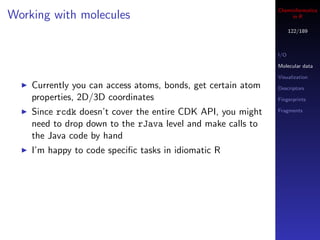
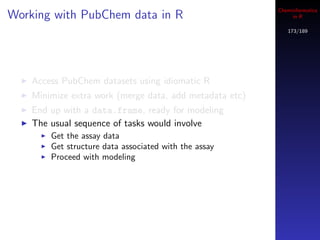
Writing Java in R in R
186/189
JNI Signature Java Type
I int
Z boolean
B byte
C char
Lfully-qualified-class; fully-qualified-class
[type type[]
For the L signature, remember the semi-colon at the end](https://image.slidesharecdn.com/cheminfo-in-r-100517174658-phpapp01/85/Cheminformatics-in-R-187-320.jpg)
![Cheminformatics
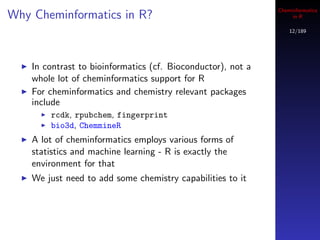
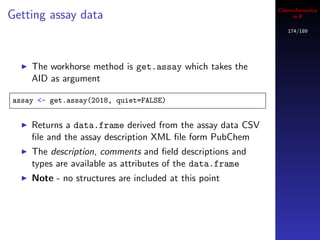
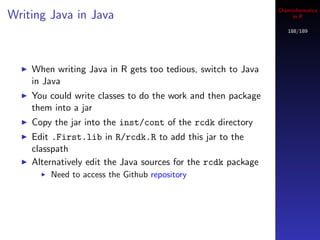
Writing Java in R in R
187/189
Another example is getting the largest connected
component
We make use of the ConnectivityChecker class and
the partitionIntoMolecules method
mol <- parse.smiles("CCC(=O)C[O-].[Na+]")
molSet <- .jcall("org.openscience.cdk.graph.ConnectivityChecker",
"Lorg/openscience/cdk/interfaces/IMoleculeSet;",
"partitionIntoMolecules", mol)
ncomp <- .jcall(molSet, "I", "getMoleculeCount")](https://image.slidesharecdn.com/cheminfo-in-r-100517174658-phpapp01/85/Cheminformatics-in-R-188-320.jpg)

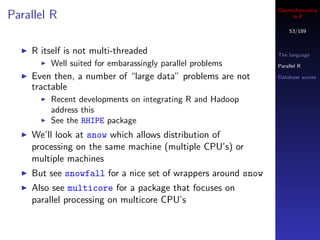
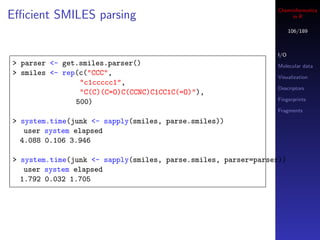
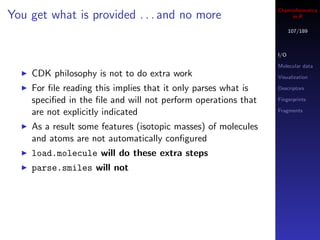
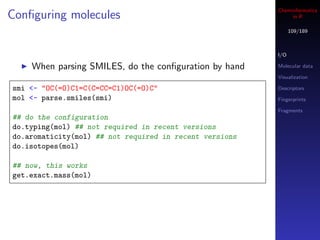
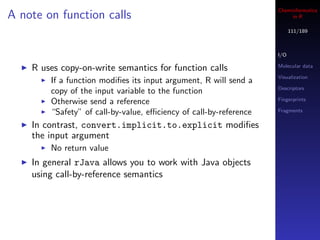
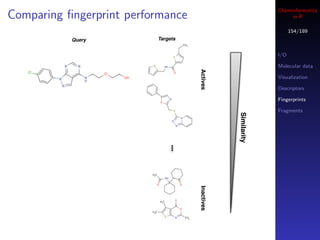
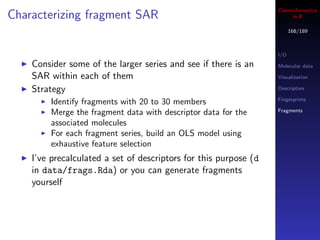
This document provides an overview of using R for cheminformatics. It discusses prerequisites for the workshop, including installing relevant packages. The outline covers an overview of the R language itself, parallel and distributed computing in R, and accessing databases from R. The document also provides some basic information on getting help, running code, and saving work in R.