More Related Content
Similar to Montgomery county sold median price
Similar to Montgomery county sold median price (18)
More from Prudential Fox & Roach, Realtors
More from Prudential Fox & Roach, Realtors (20)
Montgomery county sold median price
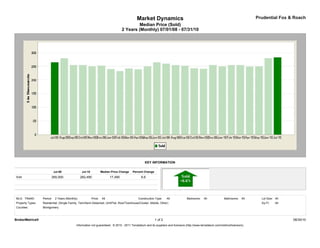
- 1. Market Dynamics Prudential Fox & Roach
Median Price (Sold)
2 Years (Monthly) 07/01/08 - 07/31/10
KEY INFORMATION
Jul-08 Jul-10 Median Price Change Percent Change
Sold 265,000 282,490 17,490 6.6
MLS: TReND Period: 2 Years (Monthly) Price: All Construction Type: All Bedrooms: All Bathrooms: All Lot Size: All
Property Types: Residential: (Single Family, Twin/Semi-Detached, Unit/Flat, Row/Townhouse/Cluster, Mobile, Other) Sq Ft: All
Counties: Montgomery
BrokerMetrics® 1 of 2 08/30/10
Information not guaranteed. © 2010 - 2011 Terradatum and its suppliers and licensors (http://www.terradatum.com/metrics/licensors).
- 2. Market Dynamics Prudential Fox & Roach
Median Price (Sold)
2 Years (Monthly) 07/01/08 - 07/31/10
FOR SALE UNDER CONTRACT SOLD EXPIRED NEW LISTINGS
Time Period Median $ # Properties Median $ # Properties Median $ # Properties Median $ # Properties Median $ # Properties
Jul-10 286,500 6,824 265,000 540 282,490 543 289,900 634 276,450 1,264
Jun-10 289,900 6,760 284,000 553 280,000 1,125 299,900 647 284,900 1,331
May-10 294,900 6,440 299,900 513 250,000 814 309,450 498 285,000 1,228
Apr-10 289,900 6,800 268,200 1,160 249,450 750 284,900 428 289,900 1,786
Mar-10 285,000 6,427 264,900 953 255,000 578 323,950 460 274,900 1,757
Feb-10 289,000 5,633 263,900 568 254,900 365 289,900 395 283,000 1,067
Jan-10 289,000 5,652 269,900 584 249,950 374 306,240 502 269,900 1,240
Dec-09 291,000 5,469 249,900 396 255,000 536 310,900 661 256,000 579
Nov-09 298,950 5,922 265,000 467 240,795 877 339,900 565 269,900 894
Oct-09 299,000 6,345 257,350 746 243,000 783 319,000 571 269,900 1,118
Sep-09 299,250 6,546 249,900 760 252,000 734 334,990 559 279,900 1,294
Aug-09 298,400 6,574 250,000 764 254,700 818 329,900 558 264,900 1,147
Jul-09 299,900 6,697 249,900 755 260,000 852 330,900 515 269,900 1,223
Jun-09 299,900 6,862 264,900 816 265,000 873 317,250 572 279,740 1,312
May-09 299,900 6,840 275,000 809 249,900 647 310,000 481 279,900 1,306
Apr-09 299,900 6,828 265,000 770 239,450 512 309,950 524 279,900 1,463
Mar-09 299,900 6,548 259,900 655 242,000 462 334,900 528 279,900 1,457
Feb-09 300,000 6,118 249,900 531 232,200 366 364,900 496 295,500 1,203
Jan-09 299,900 6,065 244,900 444 240,250 310 309,900 706 279,900 1,113
Dec-08 300,000 5,927 239,900 359 252,500 498 329,950 616 259,900 555
Nov-08 304,450 6,354 264,900 383 250,000 484 307,490 599 269,997 756
Oct-08 309,000 6,777 259,000 469 255,000 617 319,000 710 275,000 1,071
Sep-08 309,900 6,989 264,800 571 255,000 645 328,400 712 299,900 1,341
Aug-08 305,000 6,936 259,450 624 279,900 794 319,900 664 279,900 1,163
Jul-08 309,900 7,175 274,900 692 265,000 837 329,900 710 289,900 1,436
BrokerMetrics® 2 of 2 08/30/10
Information not guaranteed. © 2010 - 2011 Terradatum and its suppliers and licensors (http://www.terradatum.com/metrics/licensors).