More Related Content
Similar to 2010 February Montgomery County Sold Median Price
Similar to 2010 February Montgomery County Sold Median Price (20)
More from Prudential Fox & Roach, Realtors
More from Prudential Fox & Roach, Realtors (20)
2010 February Montgomery County Sold Median Price
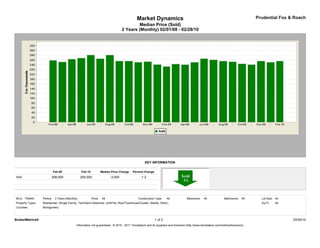
- 1. Market Dynamics Prudential Fox & Roach
Median Price (Sold)
2 Years (Monthly) 02/01/08 - 02/28/10
KEY INFORMATION
Feb-08 Feb-10 Median Price Change Percent Change
Sold 258,000 255,000 -3,000 -1.2
MLS: TReND Period: 2 Years (Monthly) Price: All Construction Type: All Bedrooms: All Bathrooms: All Lot Size: All
Property Types: Residential: (Single Family, Twin/Semi-Detached, Unit/Flat, Row/Townhouse/Cluster, Mobile, Other) Sq Ft: All
Counties: Montgomery
BrokerMetrics® 1 of 2 03/30/10
Information not guaranteed. © 2010 - 2011 Terradatum and its suppliers and licensors (http://www.terradatum.com/metrics/licensors).
- 2. Market Dynamics Prudential Fox & Roach
Median Price (Sold)
2 Years (Monthly) 02/01/08 - 02/28/10
FOR SALE UNDER CONTRACT SOLD EXPIRED NEW LISTINGS
Time Period Median $ # Properties Median $ # Properties Median $ # Properties Median $ # Properties Median $ # Properties
Feb-10 289,900 5,599 259,900 566 255,000 351 289,900 413 289,900 1,058
Jan-10 289,900 5,651 269,000 580 249,900 359 306,240 530 274,825 1,222
Dec-09 294,900 5,506 249,900 392 255,000 533 319,990 685 259,900 574
Nov-09 299,000 5,977 265,000 466 240,000 872 339,899 579 269,950 890
Oct-09 299,000 6,414 254,900 745 243,500 784 319,500 582 269,900 1,115
Sep-09 299,250 6,630 249,900 759 252,000 735 334,900 572 279,900 1,293
Aug-09 298,150 6,664 250,000 763 255,000 817 329,450 564 264,900 1,150
Jul-09 299,900 6,790 249,925 756 260,000 850 331,400 520 270,000 1,223
Jun-09 299,900 6,962 264,900 817 265,000 873 316,550 578 279,900 1,313
May-09 299,900 6,946 275,000 810 249,900 647 319,900 487 279,900 1,304
Apr-09 299,900 6,936 265,000 769 239,900 513 309,900 525 282,700 1,470
Mar-09 299,900 6,651 259,450 656 242,250 462 334,900 529 279,900 1,461
Feb-09 299,999 6,217 249,900 531 232,200 366 364,900 496 296,700 1,208
Jan-09 299,900 6,161 244,900 444 240,500 311 309,945 708 279,900 1,115
Dec-08 300,000 6,020 239,900 359 252,500 498 329,900 615 259,900 558
Nov-08 300,000 6,462 264,900 384 250,000 484 308,375 616 269,994 757
Oct-08 309,000 6,887 259,220 460 255,000 602 319,900 722 275,000 1,071
Sep-08 309,900 7,094 264,800 573 255,000 661 323,302 705 299,900 1,339
Aug-08 304,900 7,033 256,100 604 279,900 793 320,000 674 279,900 1,136
Jul-08 309,900 7,355 275,000 713 265,000 837 329,900 745 287,375 1,436
Jun-08 310,000 7,425 274,950 768 280,000 928 329,374 738 293,396 1,528
May-08 314,800 7,374 279,900 816 267,500 805 329,000 661 299,900 1,674
Apr-08 314,900 7,211 284,900 876 263,000 687 324,900 635 300,000 1,818
Mar-08 312,050 6,850 279,900 813 251,300 632 325,000 644 299,900 1,629
Feb-08 312,490 6,472 269,900 673 258,000 494 340,500 578 307,200 1,510
BrokerMetrics® 2 of 2 03/30/10
Information not guaranteed. © 2010 - 2011 Terradatum and its suppliers and licensors (http://www.terradatum.com/metrics/licensors).